
Abstract
Objectives
To develop and validate a microsimulation model to estimate the health outcomes and costs of chronic kidney disease (CKD) in type 2 diabetes (T2D) to inform health policies and reduce the burden of CKD.
Methods
We developed a comprehensive model for CKD in type 2 diabetes that assesses the impact of risk factors on the progression of urine albumin-to-creatinine ratio and estimated glomerular filtration rate and their impact on stroke, myocardial infarction (MI), congestive heart failure (CHF), end-stage kidney disease (ESKD), and death without dialysis or transplant using individual-level longitudinal data for T2D populations and summary data from published literature. We internally validated the model using data from the Chronic Renal Insufficiency Cohort (CRIC) of patients with T2D and CKD over 7 y and externally validated the model using the Canagliflozin and Renal Events in Diabetes with Established Nephropathy Clinical Evaluation (CREDENCE) trial data over 3 y.
Results
The simulated event rates of ESKD, stroke, MI, CHF, and total mortality and the related 95% confidence intervals included the observed event rates in both the internal and external validation cohorts. Using this new model, we showed that lowering the blood pressure target from 140/90 to 120/80 mm Hg in patients with T2D and CKD was cost-saving at the population level.
Conclusion
The Michigan Model for Diabetes–Chronic Kidney Disease (MMD-CKD) model provides accurate estimates of disease progression in patients with T2D and CKD. Modeling disease progression in this population will facilitate future assessments of the cost-effectiveness of systematic screening and interventions for CKD, which may reduce the health and economic burden of CKD in T2D. This model can also serve as a tool for predicting the clinical outcomes of individual patients with T2D and CKD. MMD-CKD 1.0 R Shiny app and is publicly available (https://michigandiabetesmodelinggroup.github.io/Software_App).
Highlights
We developed and validated a microsimulation model to simulate kidney disease progression, cardiovascular outcomes, mortality, direct medical costs, and quality of life in patients with chronic kidney disease (CKD) and type 2 diabetes (T2D).
This model can be used to evaluate the long-term economic burden of CKD in T2D patients in the United States as well as to assess the costs and benefits associated with specific health policies and interventions.
In addition, this model can help inform individual patients of their risk of end-stage kidney disease (ESKD) and cardiovascular events, thereby facilitating shared decision making.
Keywords
Chronic kidney disease (CKD) is a major cause of morbidity and mortality in type 2 diabetes (T2D) patients and an important risk factor for cardiovascular disease. In 2017, CKD resulted in 1.2 million deaths and 35.8 million disability-adjusted life-years worldwide. 1 The direct and indirect costs of CKD and end-stage kidney disease (ESKD) are substantial. T2D accounts for 87% to 91% of all diabetes cases and is the most frequent cause of CKD globally. 2 Together, T1D and T2D account for approximately half of the ESKD incidence worldwide. 3 In the United States, persons with diabetes comprise the fastest growing group of kidney dialysis and transplant recipients. 4 In 2018, approximately 40% of adults waiting for a kidney transplant had diabetes, 4 and 1.6 million Medicare beneficiaries with diabetes had CKD. Medicare expenditures for these individuals were approximately $40 billion. 5 CKD imposes large nonmedical societal costs, driven mostly by lost productivity, reduced employment and quality of life, and substantial informal caregiver and out-of-pocket burdens. These indirect costs can equal a meaningful share of the total societal costs and increase with disease severity. 6
Early CKD detection is essential for timely and effective treatment to slow CKD progression, prevent the development of ESKD, and reduce cardiovascular complications. Recently, new classes of antidiabetic agents, including glucagon-like peptide-1 receptor agonists, dual agonists, sodium-glucose cotransporter inhibitors, and nonsteroidal mineralocorticoid receptor antagonists, have been shown to have kidney-protective effects. 7 Given the substantial cost related to CKD and the scarcity of health care resources, analytical tools for evaluating the long-term cost-effectiveness of screening, prevention, and treatment strategies for CKD in T2D patients are needed to guide policy, standards of care, and reimbursement.
A systematic literature review by Sugrue et al. 8 identified 101 models for CKD, including 27 models for CKD in T2D. Among these models, only a few used prediction equations for CKD progression, and most were derived from the United Kingdom Prospective Diabetes Study, 9 which was conducted between 1977 and 1997. Simulation models using prediction equations with good discrimination provide much better model transportability than those with overall transition probabilities. A more recent model developed using data from a contemporary clinical trial did not include important risk factors such as hemoglobin A1c (HbA1c), blood pressure (BP), or lipid levels and did not model the changes in key risk factors over time.10,11
This project aimed to develop a microsimulation model to assess the long-term health and economic impact of screening, prevention, and treatment strategies for patients with T2D and CKD, accounting for changes in risk factors over time.
Methods
Development of the Michigan Model for Diabetes–Chronic Kidney Disease
Overview of the methods for model development
We extended a validated existing microsimulation model for T2D, the Michigan Model for Diabetes (MMD) 3.2,12–16 to develop the Michigan Model for Diabetes–Chronic Kidney Disease (MMD-CKD). In the MMD, disease progression is based on 6 discrete-time, discrete-event submodels that simulate diabetes-related complications, major comorbidities, and death due to diabetes-related and non–diabetes-related causes. Transition probabilities are functions of individual characteristics, risk factor levels, and current disease and treatment states. The model estimates the direct medical costs and health-related quality of life (HRQOL) for each individual simulated.
MMD 3.2 explicitly models diabetes management and stroke prevention strategies recommended by the American Diabetes Association and American Heart Association/American Stroke Association through a treatment module. At the beginning of each simulation year, the treatment module recommends treatment adjustments (or no changes) based on each individual’s risk factor levels (HbA1c, BP, lipids), medical history (myocardial infarction [MI], stroke, atrial fibrillation), and other criteria (e.g., stroke clinical risk score 17 ). Each simulated individual adopts or does not adopt treatment recommendations based on preassigned adherence parameters. For those who adopt treatment recommendations, their risk factors change based on the treatment effects reported in the literature. MMD 3.2 also models changes in risk factors related to aging and the natural history of each condition. By adjusting adherence at the population level, we can adjust the proportion of individuals in the population achieving the recommended risk factor control and stroke prevention strategies and quantify the new treatment costs related to the recommendations implemented.
The treatment module explicitly models strategies to achieve optimal glycemic control (from intensive lifestyle intervention to intensive insulin therapy), BP control (from one-half dose of a single medication to a full dose of 3 BP medications), and lipid management (from moderate-dose statin therapy to high-dose statin therapy). This allows us to assess the impact of each strategy relative to baseline risk factors and treatment levels in the population.
MMD 3.2 is programmed in R and is publicly available. Details about MMD 3.2 can be found in the User Manual online (https://michigandiabetesmodelinggroup.github.io/Software_App/MMD_3_2).
MMD-CKD disease model structure
In keeping with the structure of the MMD, MMD-CKD was implemented as a discrete-state, discrete-time microsimulation model in which the health status of each simulated subject is updated yearly. The model has 2 types of states: annual and event states. Patients may remain in an annual state for 1 or more simulation cycles. Patients progress through event states, such as stroke death instantaneously, and transition to the terminal state.
Figure 1 shows the simulation flow and algorithm of MMD-CKD. For each hypothetical patient, the software reads the subject’s baseline characteristics and then advances the subject through a user-specified number of years or until death.
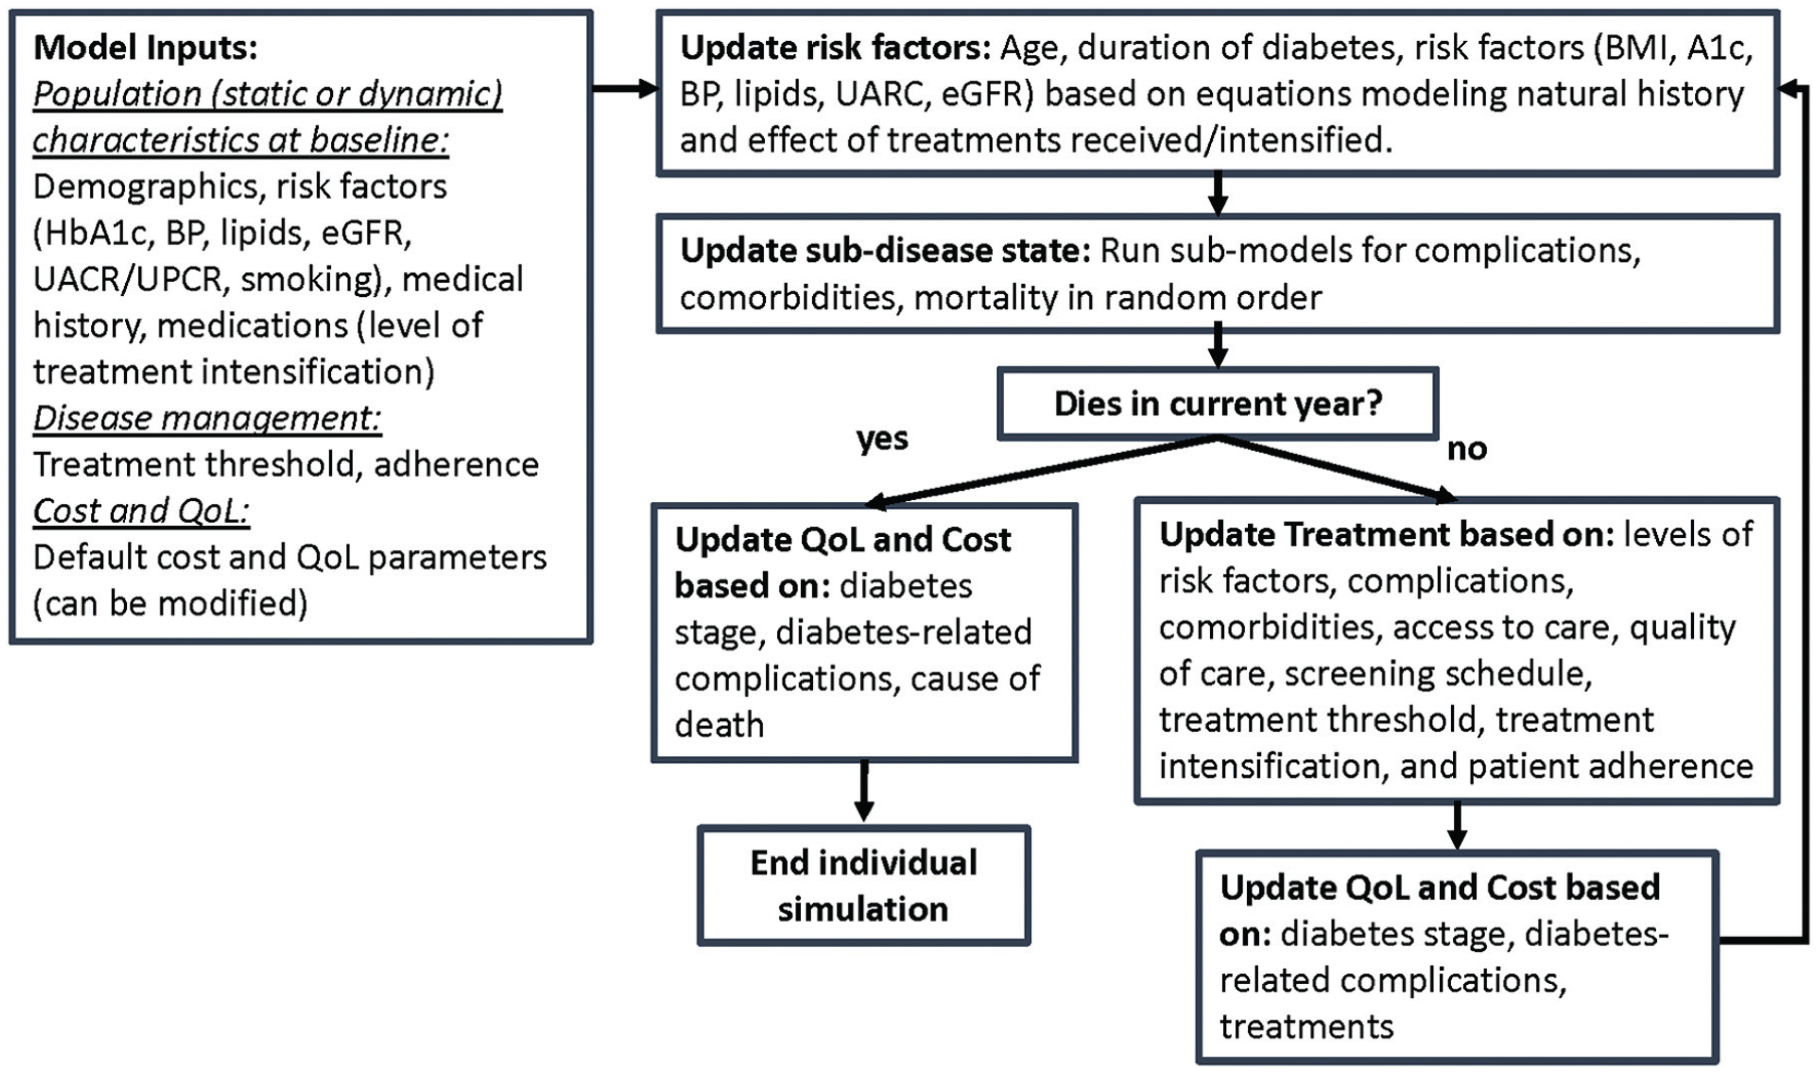
Michigan Model for Diabetes–Chronic Kidney Disease simulation flow chart and algorithm.
Each year, the model updates risk factors, medication treatments, and disease states (e.g., complications and comorbidities) based on transition probabilities and assigns health care costs and health utility values based on current treatments and health states. When simulating disease progression for the discrete-state discrete-time model, we calculate the individual-level probability of events using the 1-y cumulative hazard based on continuous survival time models and assuming that the related covariates remain constant during each year. The final model outcomes include risk factor levels over time, event rates, survival, health-related quality of life, and costs. More details are provided in the User Manual (Supplement 2).
Figure 2 shows the overall structure of the novel MMD-CKD model, which includes 4 parallel submodels (kidney disease, CHD, stroke, and other deaths). A simulated individual in the model flows through multiple submodels in parallel. Figure 2 shows the structure of the kidney disease submodel. It includes 4 disease states: no ESKD, ESKD with dialysis, ESKD with transplant, and ESKD death. CKD stages were not explicitly modeled as disease states in the model. Instead, we modeled the individual-level change in 2 important CKD biomarkers over time (see the Model Parameters section), urine albumin-to-creatinine ratio (UACR) and estimated glomerular filtration rate (eGFR) over time, which were then used to stage each simulated subject. These 2 biomarkers, together with other risk factors, are also included in risk equations that drive the transition from no ESKD to ESKD with dialysis or ESKD with transplant. The MMD-CKD model simulates the disease progression of a closed cohort. It does not model population dynamics such as births and migration. 18 Details of the structure of CHD, stroke, and other death submodels and how competing deaths are handled can be found in the User Manual (Supplement 2).
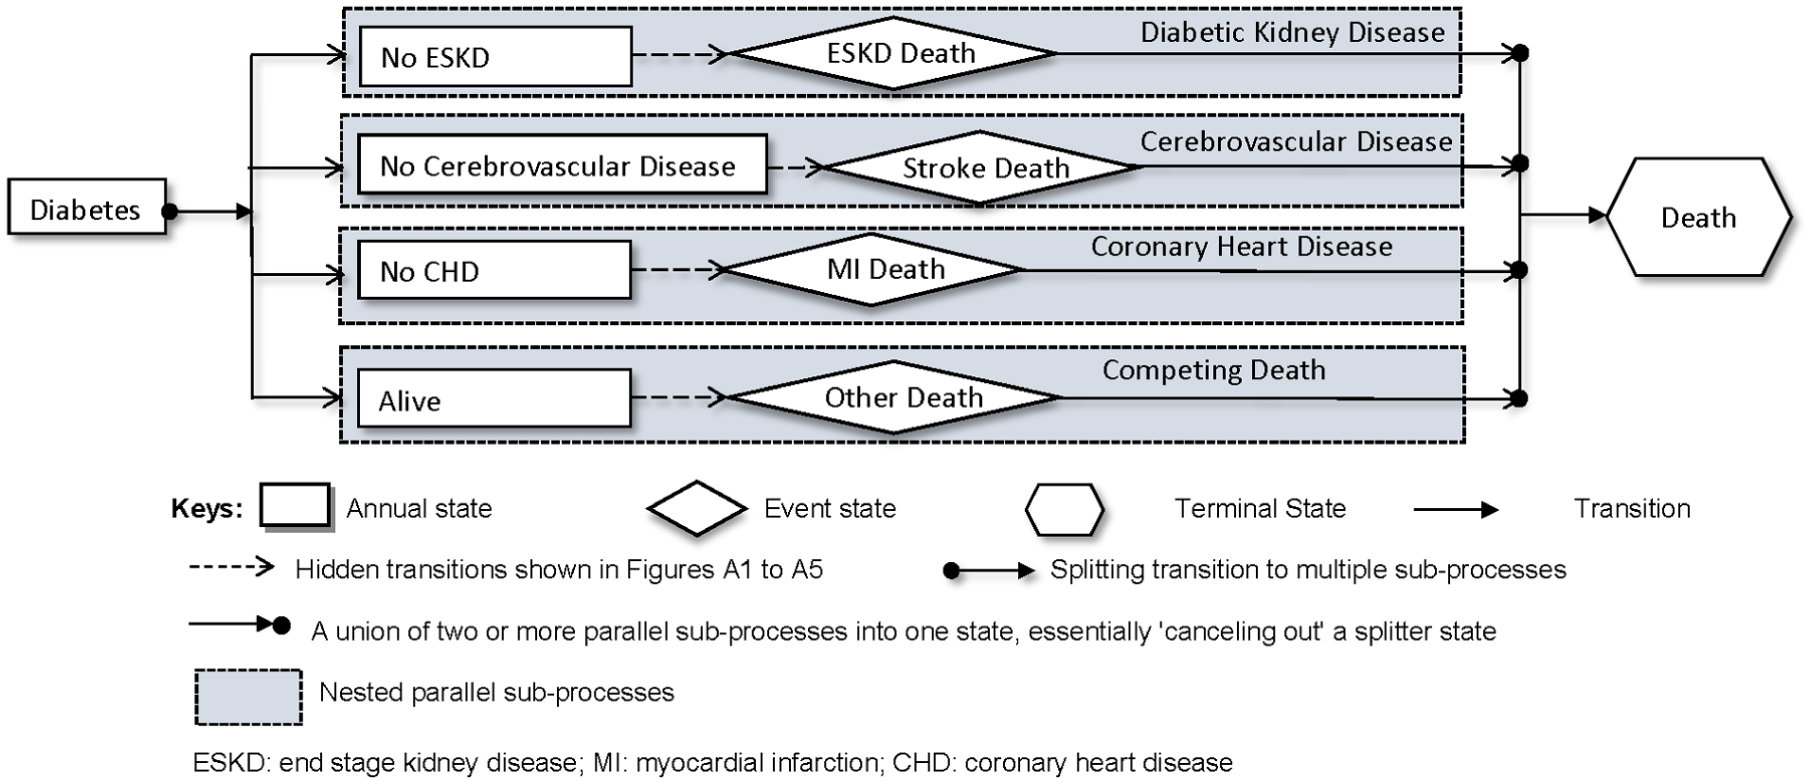
Overall structure of the Michigan Model for Diabetes–Chronic Kidney Disease (MMD-CKD) model. Stroke death and myocardial infarction (MI) death refer to death within 1 y of these events. End-stage kidney disease (ESKD) death refers to death of ESKD patients with dialysis or transplant (can potentially be due to other reasons). Other death refers to death that is not any of the above.
Model parameters
Individual-level data for MMD-CKD model development
Individual-level data from the Chronic Renal Insufficiency Cohort (CRIC) study 19 were obtained from the National Institute of Diabetes and Digestive and Kidney Disease (NIDDK) Central Repository, and individual-level data from the Action to Control Cardiovascular Risk in Diabetes (ACCORD) study 20 were obtained from the National Heart, Lung, and Blood Institute (NHLBI) Biologic Specimen and Data Repository Information Coordinating Center (BioLINCC) and used for model development (see the supplement for details).
Health outcomes
The MMD-CKD simulates complications specified in submodels for CKD (Figure 3), CHD, and stroke (Supplement 2: User Manual). We used CRIC data to develop risk equations for ESKD with dialysis, ESKD with transplant, stroke, MI, congestive heart failure (CHF), and death without ESKD. ESKD with dialysis or transplant was defined as the initiation of maintenance dialysis or renal transplant. Stroke was defined as a fixed (>24 h) acute neurologic deficit due to either ischemia or hemorrhage. MI was defined by a rise and fall in cardiac troponin levels or creatinine kinase–MB enzymes, electrocardiographic changes, and symptoms or signs of myocardial ischemia. MI was also defined by new fixed perfusion abnormalities or wall motion abnormalities on echocardiogram nuclear imaging studies. 19 New-onset CHF was defined as the first hospital admission for signs and symptoms of CHF associated with decreased cardiac output among those with no history of CHF.
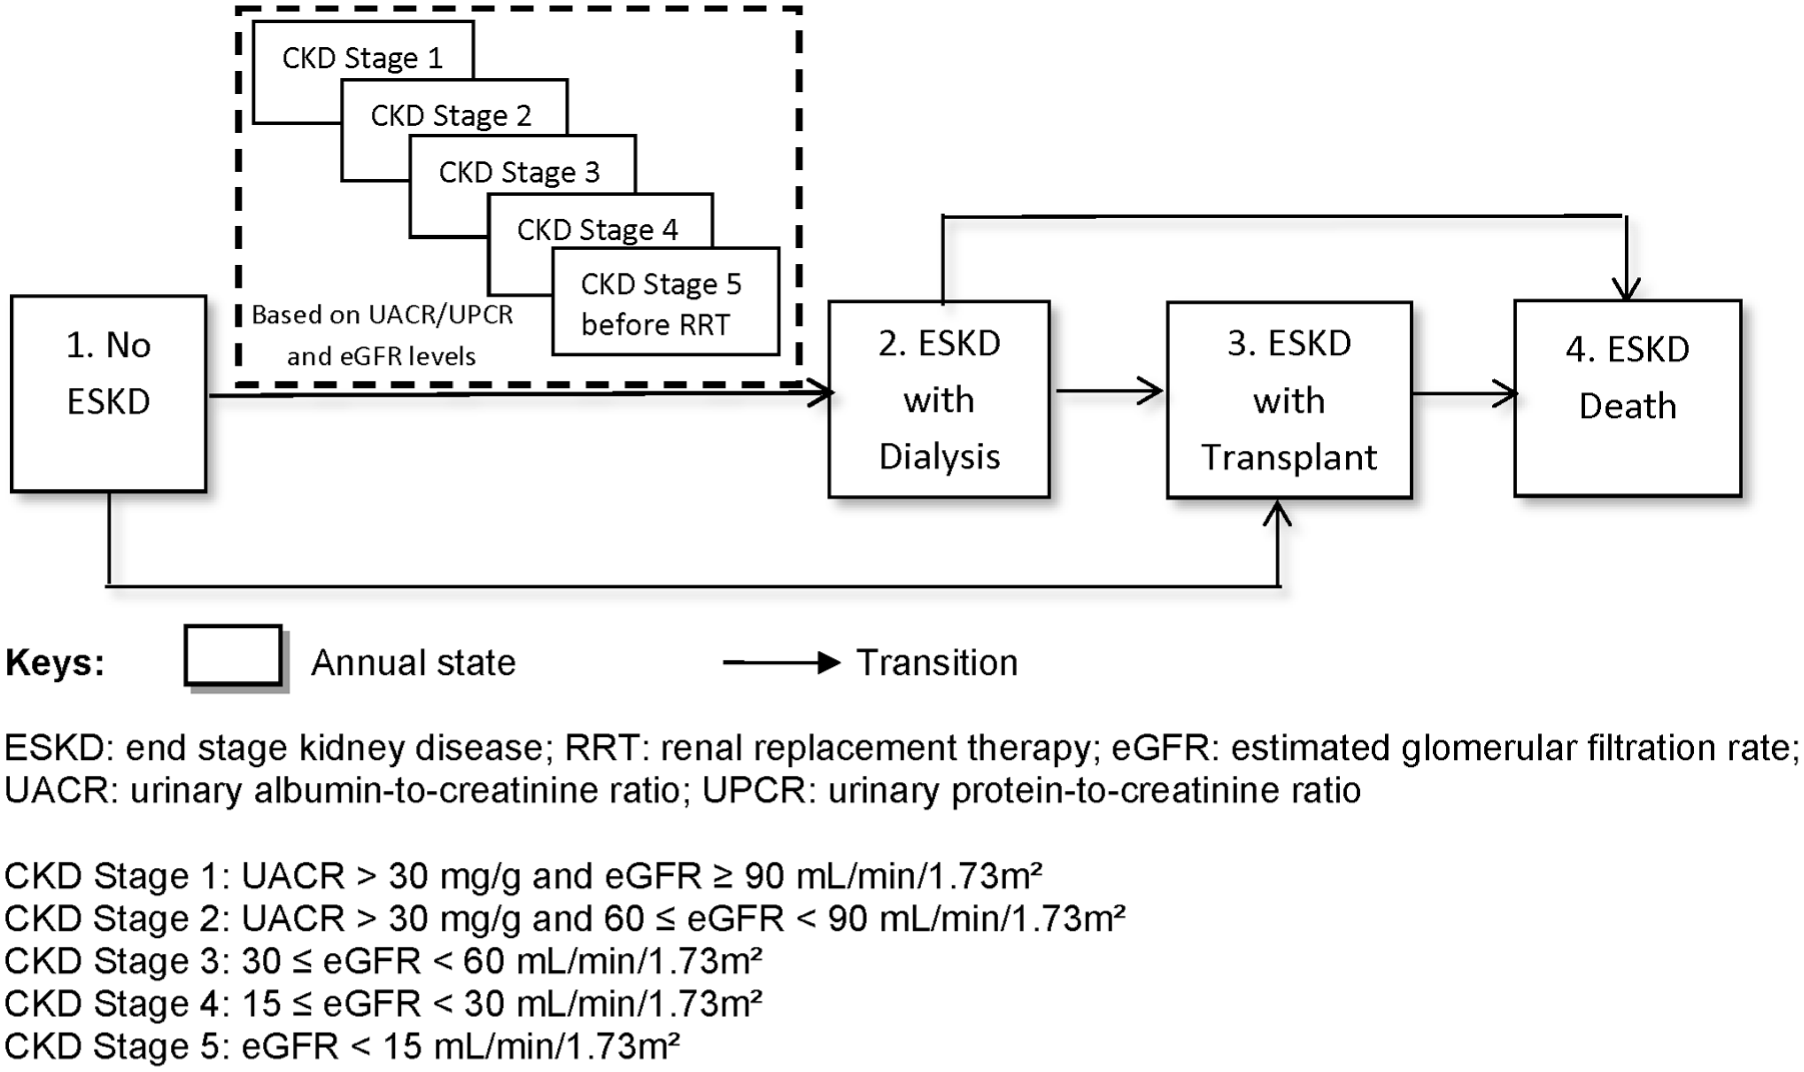
Structure of the kidney disease submodel.
Risk factors
Demographic (age, sex, race) and clinical risk factors (i.e., body mass index [BMI], HbA1c, systolic blood pressure [SBP], diastolic blood pressure [DBP], high-density lipoprotein cholesterol, low-density lipoprotein cholesterol, triglyceride, total cholesterol), and smoking status are included in the MMD as predictors of complications, comorbidities, and death. To develop the MMD-CKD model, we added UACR and eGFR as additional risk factors.
Transition probabilities
A set of internally validated Weibull proportional-hazard risk equations was developed using the CRIC data and used to calculate transition probabilities related to ESKD with dialysis, ESKD with transplant, stroke, MI, hospitalization for CHF, and other deaths. The details of the development and validation of these equations have been reported elsewhere. 21 The correlation between submodel progressions is modeled via risk factors (e.g., laboratory measures and medical history) in risk equations (User Manual [Supplement 2]).
The United States Renal Data System (USRDS) 22 collects, analyzes, and distributes information on CKD and ESKD in the United States. These data include information on the incidence, prevalence, morbidity, dialysis, transplantation, and mortality of ESKD. We used summary data from the 2018 USRDS report to derive the transition probabilities from dialysis to transplant, dialysis to ESKD death, and transplant to ESKD. 23
Modeling changes in CKD risk factors
In MMD, clinical risk factors change over time with age, duration of diabetes, other risk factors, and treatments. By linking yearly changes in one risk factor to the level and changes in other risk factors, we can model the intervention effects on multiple risk factors. For example, changes in HbA1c, BP, and lipids were modeled as functions of other risk factors, including changes in BMI (see the User Manual [Supplement 2] for details).
For MMD-CKD, we used the CRIC and ACCORD study data to develop a set of transition models to capture the yearly changes in UACR and eGFR in patients with T2D. The CRIC cohort included T2D patients with eGFR ≤ 70 (mL/min/1.73 m2), baseline measures of UACR and urine protein creatinine ration (UPCR), and yearly follow-up measure of UPCR. The ACCORD population included T2D patients, a large proportion of whom had eGFR > 60 (mL/min/1.73 m2). They reported UACR and eGFR measurements every 2 y and eGFR measurements. We developed 2 equations to convert the UPCR to UACR using baseline data from the CRIC study. Given the difference between these 2 studies and the complicated pathophysiology and clinical course of diabetic kidney disease, 4 as well as the complicated interaction between glomerular hemodynamic function and albumin excretion, we developed a set of models for different combinations of the current levels of UACR (or UPCR) and eGFR. To develop each of these models, candidate predictors included sex; race and ethnicity; current BMI; current HbA1c; current SBP; smoking status; prior MI or revascularization; prior CHF; age at first diabetes; current age; yearly changes in BMI, HbA1c, and SBP; and the interaction between current HbA1c and log UACR.
To find the best and most parsimonious models for each outcome, we first explored the functional forms for all continuous variables using p-splines. 24 For variables associated with the dependent variable with significant nonlinear patterns, we used logarithmic transformation, linear plus splines, 25 or quadratic functions to achieve a better model fit. We used splines to explore the functional forms of all risk factors considered and backward selection with exclusion criteria P > 0.15 to identify the best prediction models. These models allowed us to capture the heterogeneous individual trajectories of these risk factors over time. 26 More details are provided in the User Manual (Supplement 2).
Cost and quality of life
Both costs and health utility scores vary by CKD stage
The MMD-CKD cost model considers direct medical costs, including the costs of medications, procedures, devices, physical therapy, occupational therapy, and death. The costs of complications were estimated as the cost incurred during the first year a complication occurred (event cost) and the cost in each subsequent year after the complication occurred (ongoing cost). We also considered the cost of death. The MMD-CKD cost model does not include direct nonmedical costs incurred by patients and their families or indirect costs related to lost productivity due to illness, disability, and premature mortality. All costs were expressed in 2025 US dollars.
Health utility scores are a measure of HRQoL, in which perfect health and death are assigned values of 1.0 and 0.0, respectively. The MMD-CKD incorporates a health utility module to calculate yearly and cumulative QALYs based on the subjects’ demographics, diabetes treatment, complications, and comorbidity status.15,27 Each year, MMD-CKD calculates the yearly utility score for each simulated individual by subtracting penalties related to complications from the baseline utility (male, BMI < 30, with no complications). We assumed that each individual’s utility score was constant for a full 1-y cycle. In economic analyses, the health utility score for each health state is multiplied by the time an individual spends in that health state; in our case, the yearly utility score times 1. These are then summed to calculate the quality-adjusted life expectancy, expressed as quality-adjusted life-years (QALYs) accrued over a specified period (see Supplement 2, User Manual, for details).
Model Calibration and Internal Validation
To fit the CRIC-derived risk questions into the existing CHD and stroke submodel structure and account for stroke and MI deaths, we calibrated our model to CRIC data by adjusting the scale parameters in the Weibull survival models for stroke, MI, CHF hospitalization, and other deaths. We first read the baseline characteristics of the CRIC development sample (N = 1,432). Fewer than 4% of the 1,432 CRIC participants had missing baseline data. We imputed these missing values using the sequential regression (also known as chained equations) method. 28 We then ran the MMD-CKD model for 7 y, the duration of the yearly follow-up reported by the CRIC study. We then adjusted the adherence parameters (see details in the User Manual [Supplement 2]) to antihyperglycemic, antihypertensive, and lipid-lowering treatments to match the mean trajectories of BMI, HbA1c, SBP, DBP, and total cholesterol in the CRIC cohort. We also adjusted adherence parameters for aspirin and warfarin treatment and smoking cessation to match the observed prevalence of each of these in the CRIC cohort. Then, while keeping the adherence rate unchanged, we adjusted each of the CRIC-derived stroke, MI, CHF, and other death hazard equations with a multiplication factor to match the simulated cumulative incidence of MI, CHF, stroke, ESKD, and total mortality to the observed cumulative incidence rates of these events in the CRIC cohort. We considered an equation related to a specific event to be calibrated if the relative difference between the simulated and observed cumulative incidence rates at 7 y was <5%. We considered the model to be fully calibrated when all 4 calibrated risk equations met the above criteria. After calibration, we compared the simulated and observed results for internal validation. For both calibration and internal validation, we calculated the mean outcomes and corresponding 95% confidence intervals (CIs) based on 100 repetitions.
External Validation
We then validated the MMD-CKD according to the recommendations of the International Society for Pharmacoeconomics and Outcomes Research (ISPOR) Task Force. 29 To assess the validity of the model, we performed external validation by comparing the model-simulated outcomes with the outcomes observed in the placebo arm of the CREDENCE Study. 30
Without access to individual-level data from the CREDENCE trial, 30 we used information extracted from published manuscripts in the public domain for model validation. We abstracted summary statistics of baseline patient characteristics from baseline characteristics and used DigitizeIt software to retrieve estimates of mean risk factor trajectories or changes in risk factors and estimated cumulative incidence of primary and secondary endpoints from figures. In the first step of model validation, we used the baseline characteristics of CREDENCE to generate a simulated population. Risk factors, biomarkers, and medications were simulated to match the mean levels reported in the study. We then ran the simulation for the mean length of follow-up reported in the study (3 y). In the second step, adherence to treatment was adjusted to allow risk factor levels (weight, HbA1c, SBP, DBP, etc.) to match those reported in the study. We performed a simulation with the number of participants in the CREDENCE placebo arm (N = 2,202) with 500 repetitions to evaluate how closely the simulated results matched the observed results based on the calculated 95% CIs of the simulated results. The mean and standard deviation of the results across 500 iterations were calculated.
Application 1: Simulating the Cost-Effectiveness of Enhanced BP Control in the US Population with T2D and CKD
The Kidney Disease: Improving Global Outcomes (KDIGO) 2021 Clinical Practice Guideline for the Management of Blood Pressure in Chronic Kidney Disease for patients not receiving dialysis suggested that adults with hypertension and CKD be treated with a target SBP of <120 mm Hg. 31 However, the evidence supporting an SBP target of <120 mm Hg is less certain in some subpopulations, including those with diabetes. Randomized trials are needed to examine the various BP targets for patients with T2D and CKD. Here, we used MMD-CKD to examine the effect of an SBP target of <120 mm Hg versus <140 mm Hg in the US population with T2D and CKD.
Using the National Health and Nutrition Examination Survey (NHANES) data from 2015 to 2018, we identified 509 individuals with T2D and CKD (UACR ≥ 30 mg/g or eGFR < 60 mL/min/1.73 m2). The baseline characteristics of this population are shown in Supplement 1. We populated the characteristics of this population into CKD-MMD, including demographics, CKD risk factor levels, diabetic complications and comorbidities, atherosclerotic cardiovascular disease, and medication use. We simulated 2 scenarios with SBP/DBP targets of <140/90 and <120/80 mm Hg, running 100,000 iterations of 509 individuals over a 10-y time horizon. Mean HbA1c was set to equal to the mean value in the NHANES subpopulation with T2D and CKD, with statin and aspirin treatments set to be unchanged over time. To simulate the 2 BP control scenarios, we set the treatment target to 140/90 versus 120/80 mm Hg and assumed that 100% of the population adhered to antihypertensive treatment when one’s SBP/DBP was over the target.
We simulated health care costs associated with treatments, complications, and death over a 10-y simulation time horizon. Estimated costs included the costs of medications, procedures, devices, physical therapy, occupational therapy, and death. We also assessed health outcomes including cumulative risk for ESKD, stroke, MI, CHF, death, and stroke-related quality-adjusted life expectancy expressed as QALYs over a 10-y simulation time horizon. We calculated incremental cost-effectiveness ratios (ICERs) as the additional cost required to achieve 1 stroke-related QALY for each enhanced prevention scenario versus the status-quo scenario. We considered strategies with an ICER <$100,000 per QALY gained to be cost-effective. 32 Analyses were conducted from a health system/payer perspective that considered only direct medical costs related to care. A discount rate of 3% per year was applied to costs and QALYs. All costs were expressed in 2025 US dollars.
Application 2: Prediction of Health Outcomes for an Individual with T2D and CKD
The MMD-CKD model uses 5 prediction models with fair to excellent discrimination (C-index from 0.70 to 0.92) and can be used to predict outcomes for individual patients. To demonstrate this, we used MMD-CKD to estimate the risk of ESKD and cardiovascular comorbidities for an individual NHANES participant with high SBP and HbA1c and to assess the impact of lowering SBP and HbA1c for this individual. We ran 10,000 iterations over a 10-y horizon. Similar outcomes were reported as in Application 1. Analyses were conducted from a health system/payer perspective that considered only direct medical costs related to care. A discount rate of 3% per year was applied to costs and QALYs. All costs were expressed in 2025 US dollars.
We followed the Consolidated Health Economic Evaluation Reporting Standards (CHEERS) 2022 33 to ensure that health economic evaluations are transparent, accurate, and useful for decision making (Supplement 1).
Results
Internal Validation of the MMD-CKD
Figure 4 presents the internal validation results. Figure 4A to F compares the mean of the risk factors (BMI, HbA1c, SBP, DBP, UPCR, and eGFR) observed in the CRIC study to the average and 95% CI of mean risk factor levels simulated with 500 replications using the MMD-CKD model. Overall, the simulated risk factors matched closely the observed levels. Cumulative incidence curves (treating death as a competing event) were calculated for ESKD, eGFR <50% of baseline eGFR or ESKD, stroke, MI, CHF, and Kaplan–Meier cumulative incidence and all-cause mortality. Model predictions (point estimates and 95% CIs) closely matched the observed results. Comparisons of the prevalence of treatments to the observed counterparts in the CRIC cohort are included in Supplement 1.
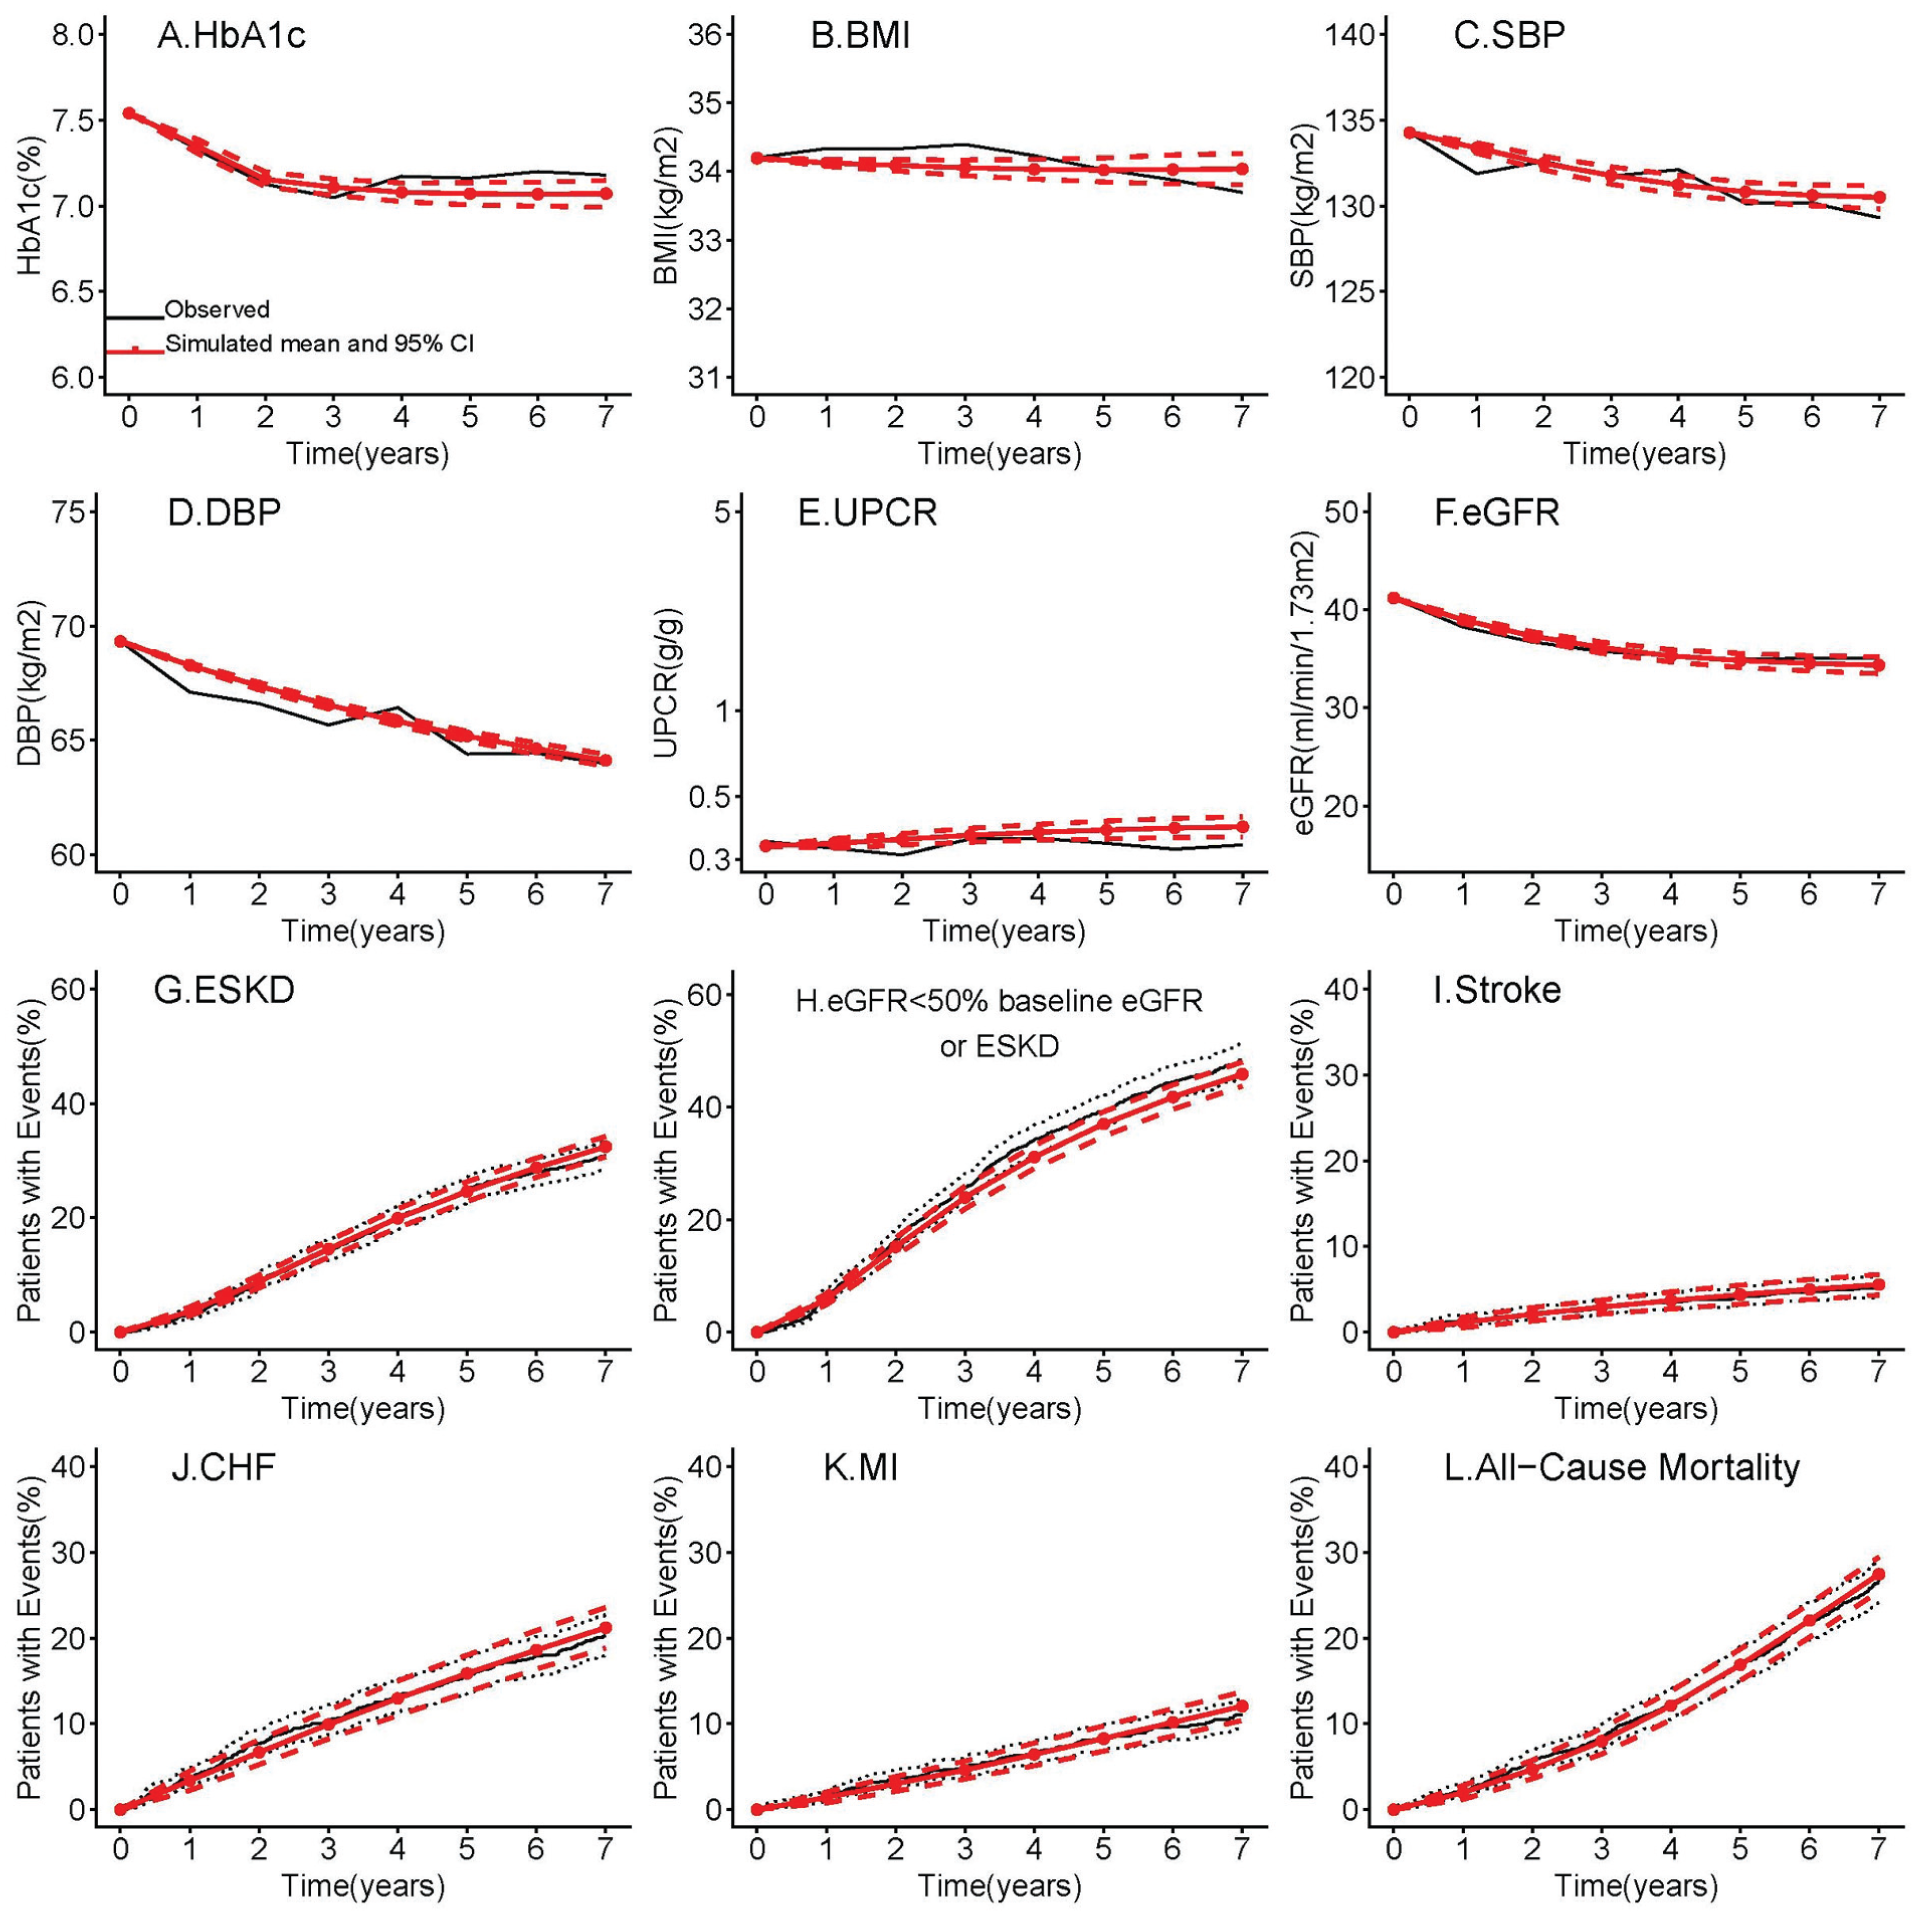
Internal validation of the Michigan Model for Diabetes–Chronic Kidney Disease (MMD-CKD): observed outcomes in the CRIC study and simulated outcomes using the MMD-CKD model. (A–F) The black lines show the observed mean trajectories of risk factors; the solid red lines with solid circles show simulated mean trajectories of risk factors, and the dashed red lines show the 95% confidence intervals for the simulated mean trajectories of the risk factors. (G–L) The black lines show the estimated cumulative incidence of cardiovascular and renal events and death; the solid red lines show the simulated cumulative incidence of cardiovascular and renal events and death, and the dashed red lines are the corresponding 95% confidence intervals.
External Validation against the CREDENCE Study
Figure 5 presents the external validation of the MMD-CKD against CREDENCE. Figures 5A–D and F compare the mean change in the observed risk factors (BMI, HbA1c, SBP, DBP, and eGFR) in the CREDENCE placebo arm to the average and 95% CI of the mean change in these risk factors of 500 simulated replications using the MMD-CKD model. The simulated average mean risk factors closely matched the observed risk factor levels. The predicted cumulative incidence of ESKD matched the CREDENCE results closely (Figure 5H). MMD-CKD slightly overestimated the incidence of all-cause mortality at years 1 and 2 (Figure 5K). Otherwise, the 95% CIs of the model predictions included the observed CREDENCE outcomes (stroke, MI, and CHF) (Figure 5I to (K).
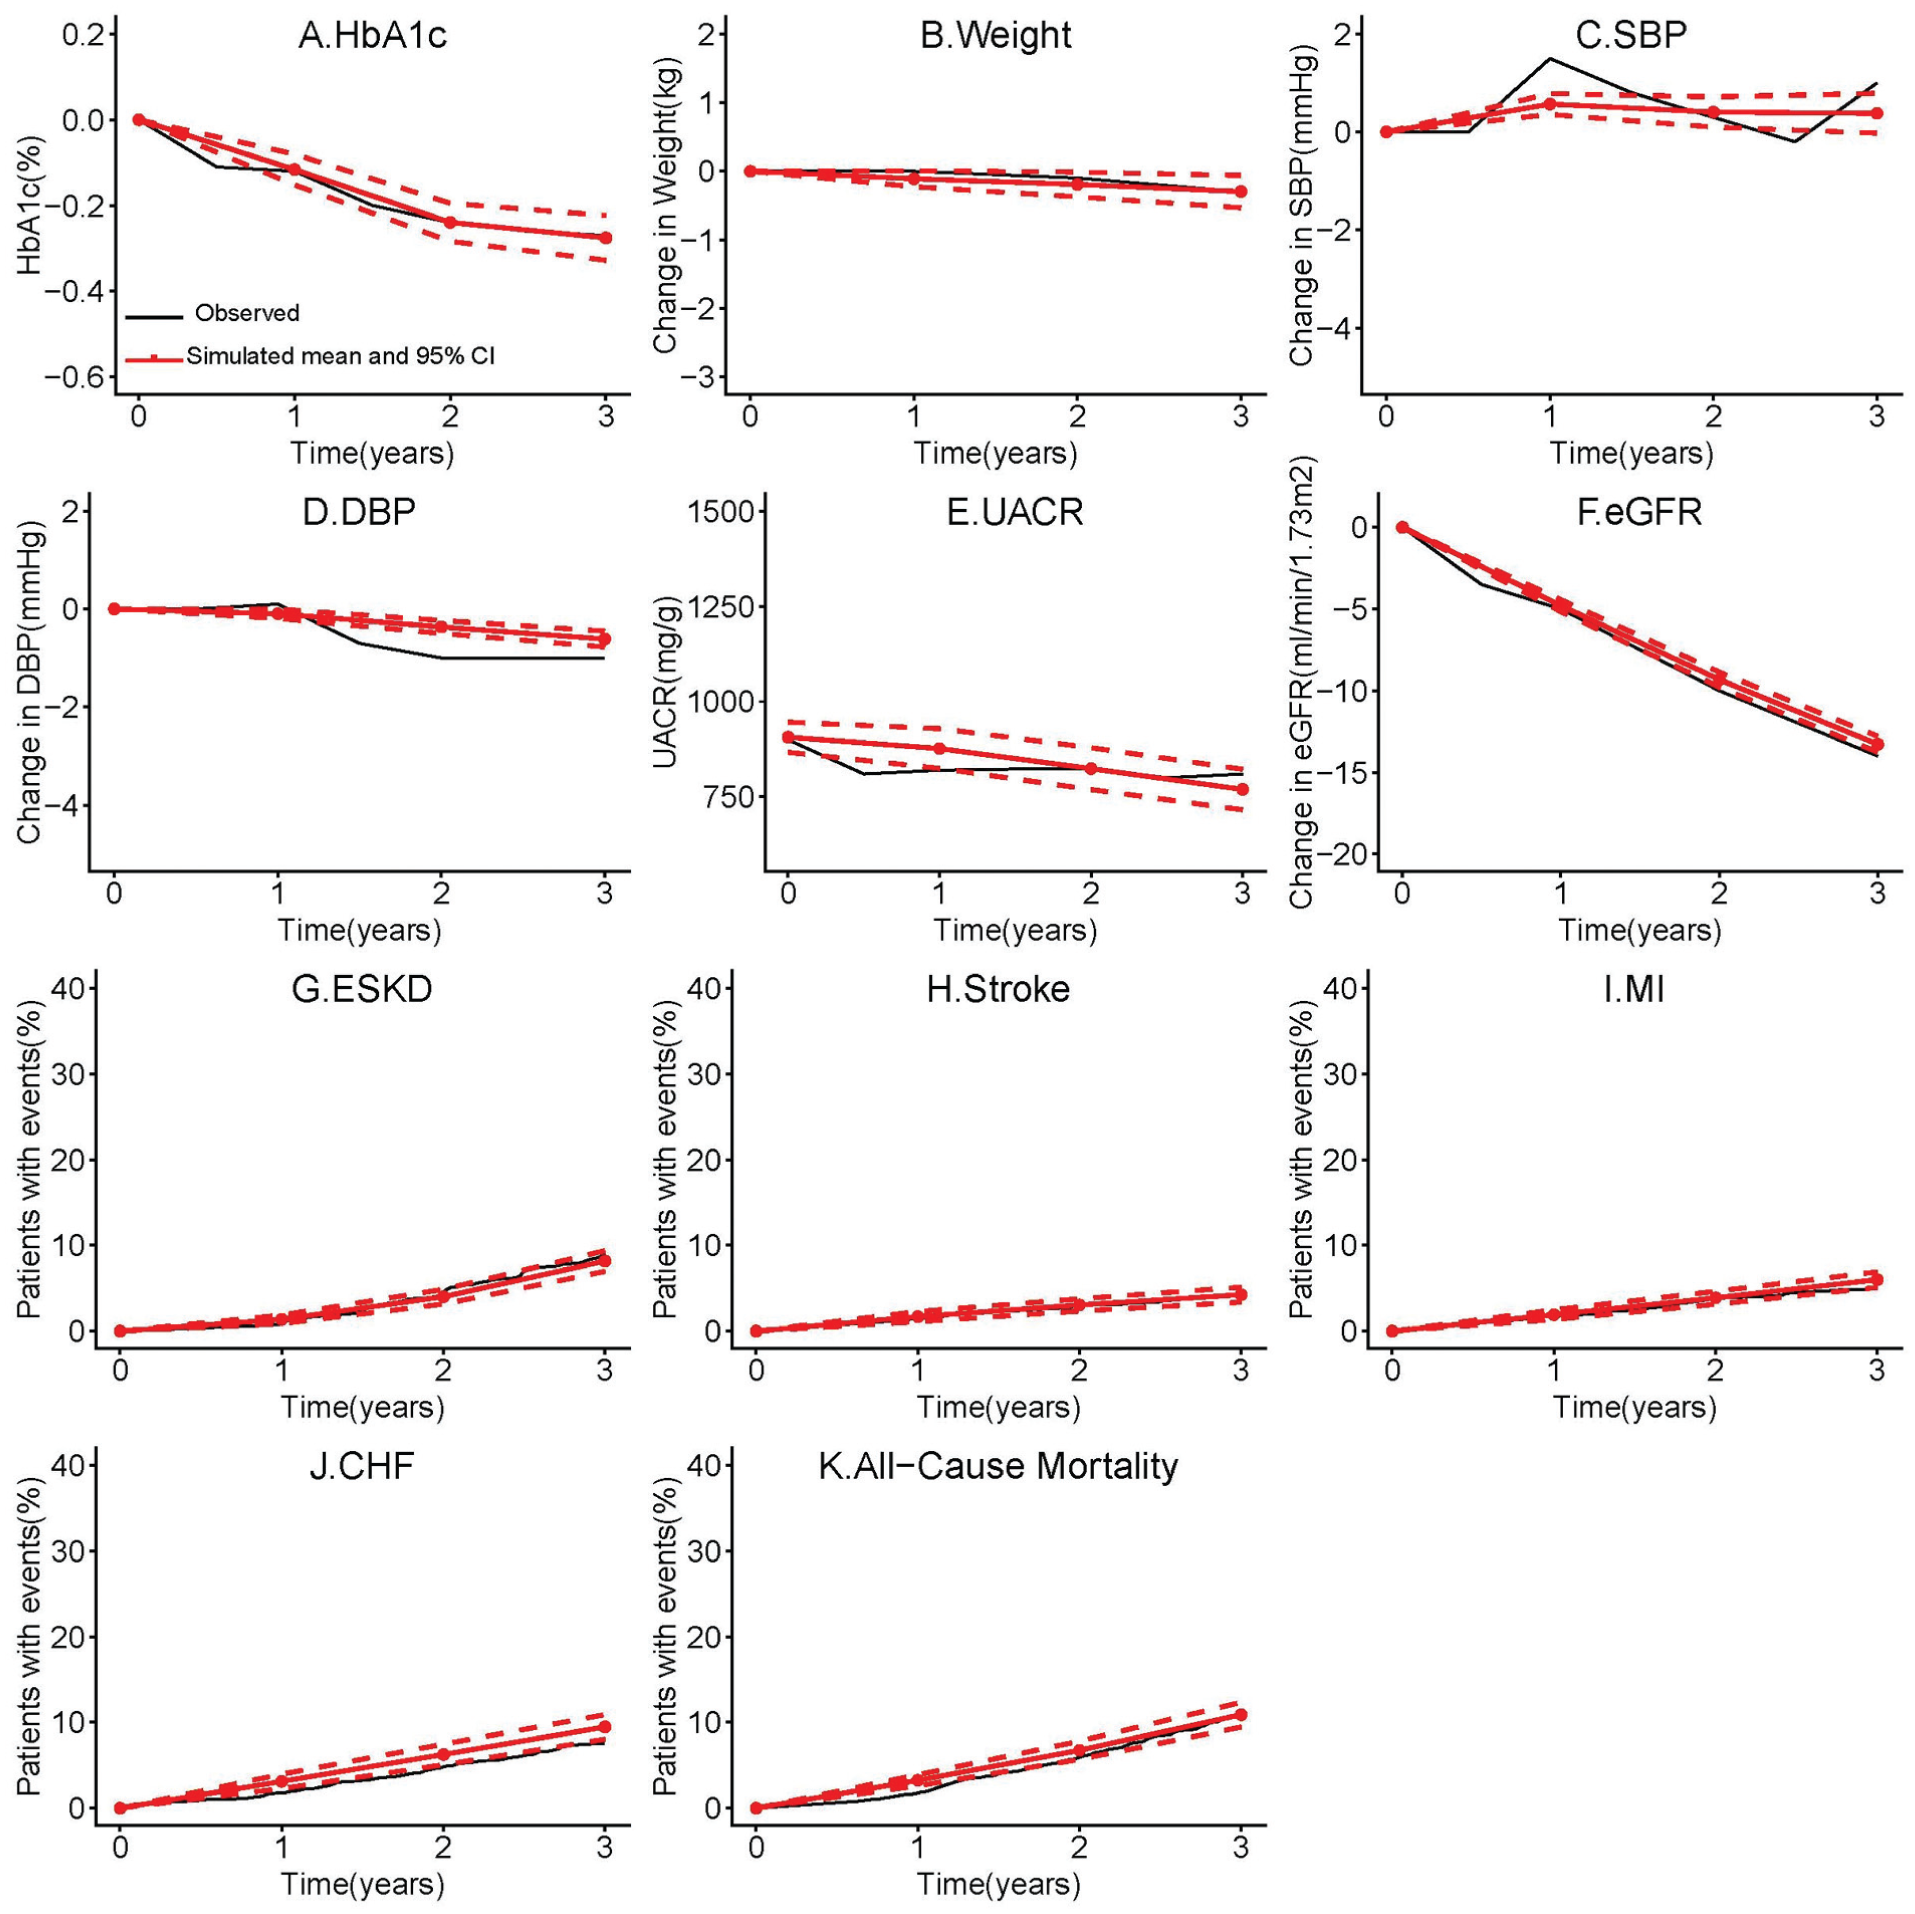
External validation of the Michigan Model for Diabetes–Chronic Kidney Disease (MMD-CKD): observed and simulated outcomes in the CREDENCE study (placebo arm). (A–F) The black lines show the observed mean trajectories of the risk factors; the solid red lines with solid circles show the simulated mean trajectories of the risk factors, and the dashed red lines show the 95% confidence intervals for the simulated mean trajectories of the risk factors. (G–K) The black lines show the estimated cumulative incidence of cardiovascular and renal events and death; the solid red lines show the simulated cumulative incidence of cardiovascular and renal events and death, and the dashed red lines are the corresponding 95% confidence intervals.
Application 1: Cost-Effectiveness of Enhanced BP Control in the US Population with T2D and CKD
The simulation results (Table 1) showed that decreasing the target BP from 140/90 to 120/80 mm Hg in the NHANES population with T2D and CKD could decrease the 10-y cumulative risk for ESKD, stroke, MI, CHF, and mortality by 0.6%, 0.1%, 0.9%, 0.9%, and 0.8%, respectively. This leads to savings of $2,634 and an increase of 0.015 QALY per person over 10 y. Figure A4 and Table A4 in Supplement 1 compare outcomes in the 2 scenarios over 10 y.
Cost-Effectiveness of Blood Pressure Control in NHANES Participants with T2D and CKD in 10-y Horizon (N = 509)
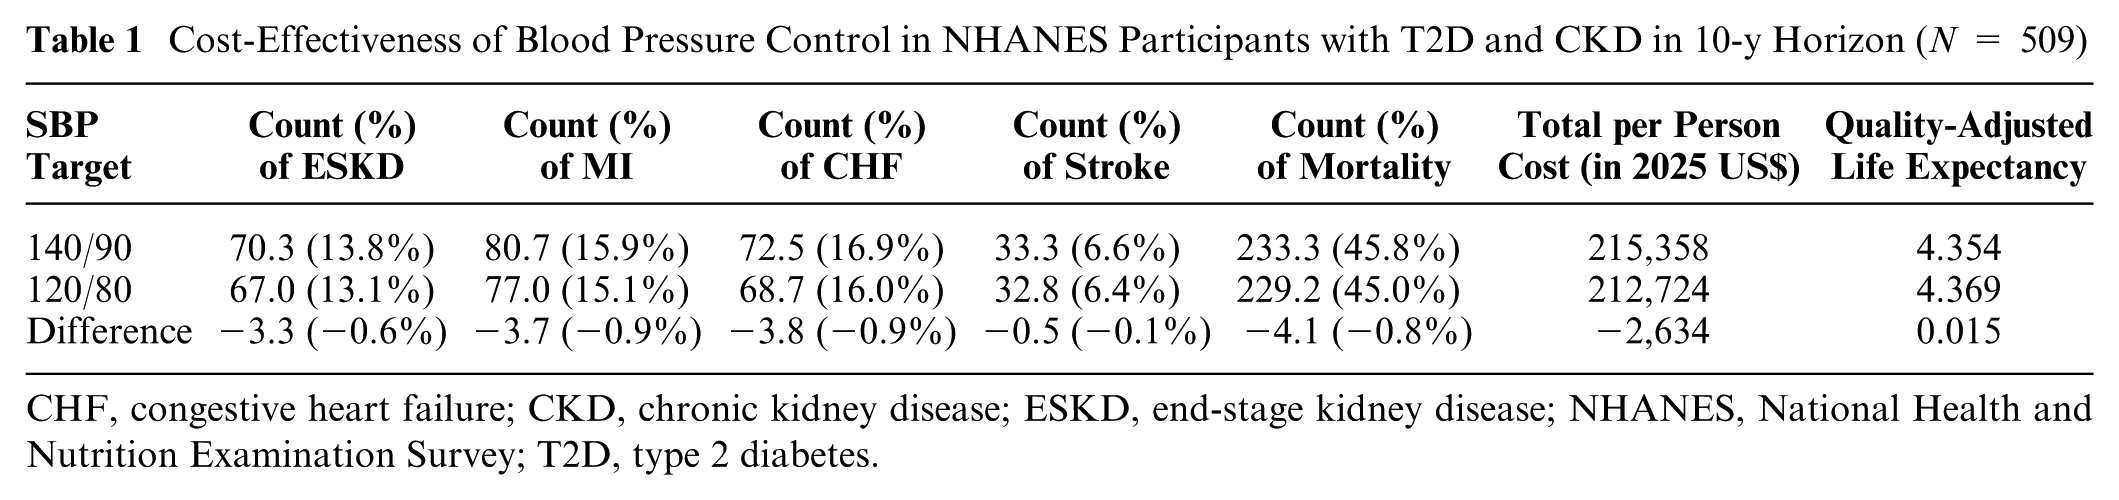
CHF, congestive heart failure; CKD, chronic kidney disease; ESKD, end-stage kidney disease; NHANES, National Health and Nutrition Examination Survey; T2D, type 2 diabetes.
Application 2: Prediction of Health Outcomes for an Individual with T2D and CKD
The exemplary patient is a 49-y-old man with eGFR 59 mL/min/1.73 m2, UACR 3,404 mg/g, SBP 173 mm Hg, HbA1c 11.6%, and no history of stroke or coronary heart disease. If he does not use any antihypertensive, antidiabetic, or lipid-lowering treatment, his chance of having ESKD, stroke, MI, CHF, and death in 10 y is 84.5%, 18.1%, 37.1%, 37.4%, and 55%, respectively. In contrast, if he adheres to optimal antihypertensive and antidiabetic treatment to achieve SBP <120 mm Hg and HbA1c <7%, his risk of having ESKD, stroke, MI, CHF, and death is reduced to 69.2%, 9.4%, 8.6%, 21.9%, and 34.6%, respectively. Supplement 1, Figure A4 shows more detailed results.
Discussion
We have developed and validated a micro-simulation model to evaluate the long-term clinical outcomes and cost-effectiveness of interventions in T2D and CKD, using individual-level data from the CRIC study and ACCORD study and summary data from USRDS reports.
The age range of the CRIC diabetes cohort and ACCORD cohort was 31 to 75 y and 40 to 79 y at the baseline, respectively; the range of diabetes duration was 0 to 44 y and 0 to 33 y, respectively. Both study populations had a diverse racial/ethnic background. Caution should be applied when model results are extrapolated to populations that differ significantly from the model target population: 30 to 79 y of age with T2D and CKD in the United States.
Strengths and Comparisons to Existing Models
Many T2D simulation models include CKD submodels8,9,34–36 but none focus on a population with T2D and CKD. Willis et al. 11 developed the CREDEM-DKD simulation model for diabetic kidney disease using CREDENCE trial data. Their model performed well in internal and external validation exercises. We developed the MMD-CKD using data from a prospective longitudinal cohort study of patients with T2D and CKD with a longer follow-up (median 7 y). Furthermore, we incorporated transition models for predicting the changes of 2 key risk factors for CKD, UPCR or UACR, and eGFR while incorporating other risk factors (e.g., BMI, HbA1c, BP). Our model is the first to use UPCR/UACR in the normo-, micro-, and macro-albuminuric ranges to predict the rate of change in eGFR according to the Kidney Disease Outcomes Quality Initiative (KDOQI) Risk Algorithm. 37 By combining these new equations with other existing risk factors and updating the MMD, we were able to model the coevolution of these key risk factors and treatment effects on CKD progression mediated through changes in BMI levels, glucose, and BP. None of the other CKD prediction models8,9,34–36 for T2D has this feature. In addition, by creating this new MMD-CKD model based on the existing structure of MMD, we are able to model the effects of both treatment and treatment adherence. This feature does not currently exist in other models. Beyond clinical outcomes, medical costs, and HRQoL related to T2D complications and comorbidities in this population can be easily incorporated into the MMD-CKD model.
Limitations
The CRIC study enrolled only participants with eGFR ≤ 70 mL/min/1.73 m2. All of the initial model risk equations were based on this population. To apply our model to T2D patients with eGFR > 70 mL/min/1.73 m2 with or without proteinuria, we developed additional transition models using ACCORD data. Due to the relatively small number of events observed in the ACCORD study placebo group, we did not have enough power to develop risk equations that apply to T2D patients with eGFR > 70 mL/min/1.73 m2. In the CREDENCE study, 35.4% of participants had an eGFR of 60 to 89 mL/min/1.73 m2 and 4.8% had an eGFR of ≥90 mL/min/1.73 m2 at baseline. The excellent concordance we observed in the external validation of our model against the CREDENCE study indicates that the transitional models we developed for the change in eGFR and UACR using the ACCORD data work well, and the MMD-CKD model can likely be used for populations including patients with stages 1 and 2 CKD. To further evaluate the robustness of the MMD-CKD model, additional external validations against individual-level data are ongoing and will be reported elsewhere. Finally, in the 2 applications, we assumed parameters related to SBP and HbA1c are causal, which needs to be further checked. One needs to be cautious when interpreting the simulated interventions effect.
Implications for Clinical Practice and Future Research
In the United States between 2002 and 2016, CKD-related disability-adjusted life-years (DALYs) increased by 52.6%, from 1,269,049 to 1,935,954 DALYs, and death due to CKD increased by 58.3%, from 52,127 to 82,539 deaths. 38 The economic burden of CKD is of concern to patients, caregivers, and payers including the government. Because T2D is the most common cause of CKD, it is essential to assess CKD’s economic burden in the T2D population. The MMD-CKD can be used to evaluate the long-term economic burden of CKD in US subpopulations and provides a tool to examine the costs and the benefits associated with specific health policies and interventions. It also informs decision making and health resource allocation for payers and governments. In addition, as demonstrated in application 2, it can be used as a patient education tool based on predictions for individual patients.
Finding sufficiently large, representative, long-term longitudinal data sources to describe disease progression from normal kidney function to mild CKD in T2D patients was challenging. Electronic medical records from large health systems could potentially provide data for this endeavor. Models such as the MMD-CKD are critical to evaluate early prevention and treatment strategies to identify those with the largest population-level impact on cardiovascular and kidney morbidity and mortality.
Conclusions
Using multiple data sources including individual-level data and national-level summary data, we developed, internally validated, and externally validated a discrete-time, discrete-state microsimulation model for CKD in T2D. The MMD-CKD model can be used to assess the long-term comparative effectiveness and cost-effectiveness of alternative strategies for screening for and treating CKD to prevent its progression. MMD-CKD 1.0 R Shiny app and is publicly available (https://michigandiabetesmodelinggroup.github.io/Software_App).
Supplemental Material
sj-pdf-1-mdm-10.1177_0272989X261455313 – Supplemental material for A Microsimulation Model for Chronic Kidney Disease Progression in Type 2 Diabetes Patients in the United States: Michigan Model for Diabetes–Chronic Kidney Disease Model
Supplemental material, sj-pdf-1-mdm-10.1177_0272989X261455313 for A Microsimulation Model for Chronic Kidney Disease Progression in Type 2 Diabetes Patients in the United States: Michigan Model for Diabetes–Chronic Kidney Disease Model by Wen Ye, Xuemei Ding, Jing Li, Rakesh Singh, Ryan Farej, Shihchen Kuo, Jay C. Elliott, Jason Lott, Chun-Ting Yang, Sheldon X. Kong and William H. Herman in Medical Decision Making
Supplemental Material
sj-pdf-2-mdm-10.1177_0272989X261455313 – Supplemental material for A Microsimulation Model for Chronic Kidney Disease Progression in Type 2 Diabetes Patients in the United States: Michigan Model for Diabetes–Chronic Kidney Disease Model
Supplemental material, sj-pdf-2-mdm-10.1177_0272989X261455313 for A Microsimulation Model for Chronic Kidney Disease Progression in Type 2 Diabetes Patients in the United States: Michigan Model for Diabetes–Chronic Kidney Disease Model by Wen Ye, Xuemei Ding, Jing Li, Rakesh Singh, Ryan Farej, Shihchen Kuo, Jay C. Elliott, Jason Lott, Chun-Ting Yang, Sheldon X. Kong and William H. Herman in Medical Decision Making
Footnotes
Acknowledgements
The CRIC data set was provided by the National Heart, Lung, and Blood Institute (NHLBI) BIOLINCC, and the ACCORD data set was provided by the Diabetes and Digestive and Kidney Diseases (NIDDK) data repository.
The authors declared the following potential conflicts of interest with respect to the research, authorship, and/or publication of this article: Ryan Farej, Rakesh Singh, Sheldon X. Kong, Jay C. Elliott, and Jason Lott were employed by Bayer US LLC at the time the study was conducted. The authors disclosed receipt of the following financial support for the research, authorship, and/or publication of this article: The project described was supported by Bayer HealthCare Pharmaceuticals Inc. (US) and grant P30DK092926 (MCDTR, Methods and Measurement Core) from the National Institute of Diabetes and Digestive and Kidney Disease.
Ethical Considerations
All individual-level data included in this study are deidentified secondary data. This study has been approved by the University of Michigan Institutional Review Board.
Consent to Participate
Not applicable.
Consent for Publication
Not applicable.
Data Availability
Individual-level data used in this study are available from BIOLINCC and the NIDDK data repository.
References
Supplementary Material
Please find the following supplemental material available below.
For Open Access articles published under a Creative Commons License, all supplemental material carries the same license as the article it is associated with.
For non-Open Access articles published, all supplemental material carries a non-exclusive license, and permission requests for re-use of supplemental material or any part of supplemental material shall be sent directly to the copyright owner as specified in the copyright notice associated with the article.