






Abstract
Background
It is difficult for conventional magnetic resonance imaging (MRI) to distinguish benign soft-tissue masses (STMs) from malignant masses.
Purpose
To quantitatively compare the diagnostic value of intravoxel incoherent motion (IVIM) and diffusion kurtosis imaging (DKI) in STMs.
Material and Methods
The data from 58 patients with STMs were retrospectively analyzed. The GE Discovery 3.0-T MRI scanner was used to acquire conventional MRI sequences, IVIM, and DKI images. The chi-square test, independent sample t-test, and Mann–Whitney U tests were used to compare the differences between conventional MRI features, IVIM, and DKI parameters (Dslow, Dfast, f, mean kurtosis [MK], and mean diffusivity [MD]) between the benign and malignant groups. Receiver-operating characteristic (ROC) curve analysis was also performed.
Results
Tumor size and depth are statistically different in STTs. Dslow, MK, and MD values in the malignant groups are significantly lower than the benign groups (P < 0.05). However, Dfast and f values are not statistically different between the two groups. The area under the curve (AUC) of Dslow value (0.859) is higher than MD (0.765) and MK (0.676) values for identifying benign and malignant STMs. The Dslow value showed the best specificity (82.93%). The sensitivity and specificity of IVIM and DKI parameters are higher than that of conventional MRI sequences.
Conclusion
IVIM and DKI can be used to distinguish between benign and malignant STMs, with Dslow as the most meaningful parameter.
Keywords
Introduction
Soft-tissue masses (STMs) originate from a variety of tissues, including both benign and malignant masses. Soft-tissue tumors (STTs) are divided into benign STTs and soft-tissue sarcomas (STSs) of different histological subtypes. The incidence of benign lesions is about 300/100,000 worldwide, although malignant STTs account for 1% of all malignant tumors. Currently, the overall relative five-year survival rate is approximately 50% (1,2). Hence, the accurate differentiation of benign and malignant STMs is vital in the clinic (3–5). For example, differentiating between benign and malignant tumors before surgery can guide the scope of surgical resection, avoid excessive imaging sessions, and aid in treatment planning (6).
Preoperative histopathological examinations are invasive procedures, and the puncture results are often unreliable due to the heterogeneity of STTs (7). In a recently published report, puncture biopsies were also found to induce tumor metastasis (8). In addition to pathology, non-invasive imaging techniques can also help differentiate between benign and malignant tumors (4,9–11). High-resolution and multidirectional imaging of tissues make magnetic resonance imaging (MRI) the optimal choice for diagnosing STMs (4,12–14). However, it can be challenging for radiologists to distinguish certain characteristics of lesions, such as neoplastic versus non-neoplastic and benign versus malignant, on conventional MRI (15,16). Using only conventional MRI is inaccurate because many imaging features lack specificity (15,17), and conventional sequences can only provide limited data, such as the location, shape, and size of the lesion (18).
In recent years, the rapid development of diffusion sequence has allowed clinicians to non-invasively assess the microstructures of various diseases. It has been suggested that biexponential intravoxel incoherent motion (IVIM) and diffusion kurtosis imaging (DKI) can accurately reflect the diffusion of water molecules (19,20). Hence, Le Bihan et al. (21) used IVIM to determine the critical diffusion (true diffusivity [Dslow]) and perfusion parameters (fraction of perfusion [f] and pseudo-diffusion parameter [Dfast]) separately (22). DWI is performed by continuously imaging the same tissue and changing the sensitivity of water diffusion. The imaging gradient intensity, direction, and time profile will affect the sensitivity to diffusion, and is usually reduced to a simplified parameter (b-value) (23). DWI assumes that the diffusion of water molecules obeys the Gaussian distribution; however, the complex cell microstructure in living tissues causes the diffusion of water molecules in real biological tissues to deviate substantially from the Gaussian distribution. The diffusion of water molecules deviates from the traditional Gaussian distribution at high b-values, yet Jensen et al. proposed that DKI could address the non-Gauss distribution (24–26). According to their report, DKI can reflect the complex microstructures of biological tissues better than DWI. A series of reports have been published comparing the diagnostic value of IVIM and DKI in other diseases (16,27,28). However, there are few studies on the diagnostic value of DKI for benign and malignant STTs.
Therefore, the aim of the present study was to compare the diagnostic value of DKI and IVIM for identifying benign and malignant STMs in order to determine the most suitable strategy for distinguishing between benign and malignant STM sequences. We believe our findings could help clinicians and radiologists make more accurate diagnoses without the need for highly invasive procedures.
Material and Methods
This retrospective study was approved by the institutional Ethics Committee.
Patients
A total of 101 consecutive patients with STMs were treated at our institution between January 2018 and January 2020. We have designed some exclusion criteria to obtain STMs that are difficult to distinguish by conventional MRI. The exclusion criteria were as follows: (i) the interval between MRI and surgery was >7 days; (ii) IVIM and DKI images were unavailable; (iii) radiotherapy, chemotherapy, and other treatments were performed before MRI; (iv) missing the final pathological results; (v) diameter of the lesion was < 1 cm; (vi) lesion was located on the trunk; and (vii) well-differentiated lipoma and other STMs that could be diagnosed by conventional MRI. The detailed patient enrollment process is shown in Fig. 1. A total of 58 patients were included in the final cohort.
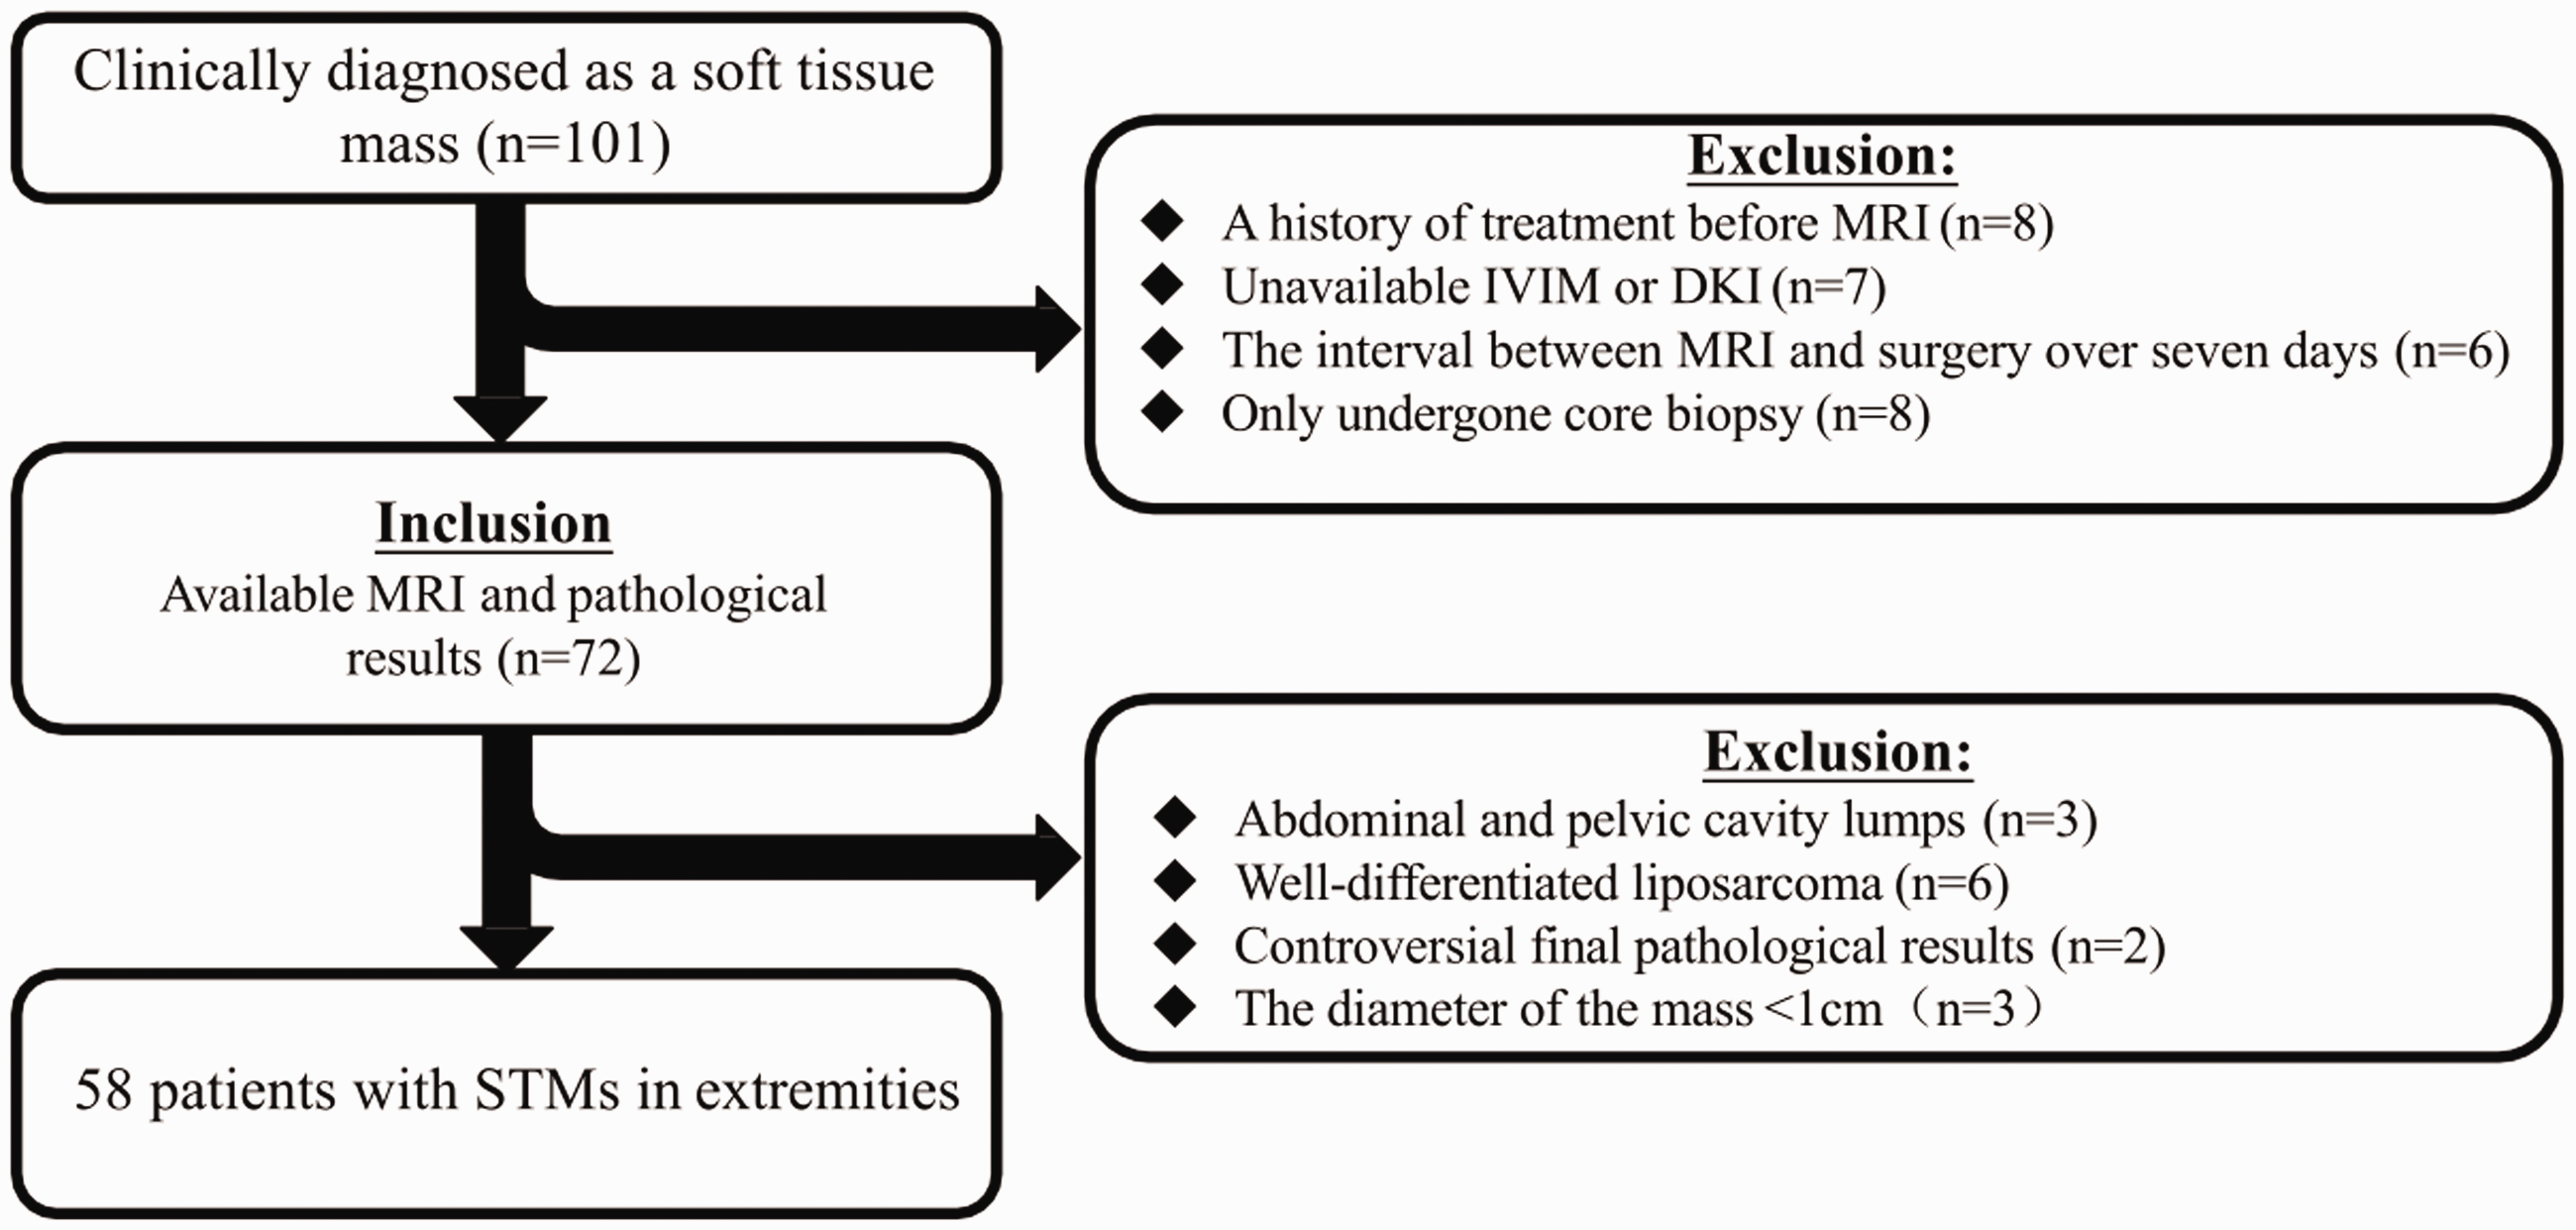
Flow chart depicting the study population selection.
Imaging data acquisition
All patients were examined with a GE Discovery 750 W 3.0-T MRI scanner (Chicago, IL, USA). Conventional MRI acquisition was performed using a fast-spin echo (FSE) sequence, including FSE T2-weighted (T2W), fat suppression T2-weighted (FS-T2W), FSE T1-weighted (T1W), and fat suppression T1W (FS-T1WI). Cross-sectional images, the sagittal plane, and coronal plane were collected in all conventional sequences. The field of view (FOV), slice thickness, and slice gap were adjusted based on the size and position of the lesion. The echo-planar imaging sequence was used in IVIM and DKI. Eight b-values were set in the IVIM sequence (0, 25, 50, 75, 100, 200, 500, 800 s/mm2) with the following parameters: TR/TE = 3000/70 ms; section thickness = 3–9 mm; matrix = 128 × 128; scan time = 2 min 33 s. Three b-values were set in the DKI sequence (0, 1000, 2000 mm2/s) with the following parameters: TR/TE = 5000/88 ms; section thickness = 3–7 mm; matrix = 128 × 128; scan time = 8 min 50 s. The layer spacing, layer number, and FOV were copied from the FS-T2W sequence. Finally, contrast-enhanced imaging was performed.
Imaging data analysis and processing
Image information was transferred to GE Advantage Workstation 4.7, and image processing was performed using the Function tool software. All image features and parameters were measured by two experienced radiologists, with three and five years of work experience, independently. Both radiologists were blinded to the clinical and histological data of the patients.
Conventional MRI analysis
Tumor size, shape, location, heterogeneity, peritumoral enhancement, and tumor border were evaluated by two observers on conventional MRI. The largest diameter of the tumor in the coronal, sagittal, or transverse plane was recorded as the size of the tumor. Tumor size was divided into two groups of ≥5 cm and < 5 cm. The tumor depth included subcutaneous and intramuscular. The peritumoral enhancement was divided into presence and absence, and the tumor boundary was divided into clear and unclear. All the above features used the kappa coefficient to test the consistency between observers: Kappa ≥0.75 was regarded as good consistency; <0.7 to ≥0.4 as general consistency; and < 0.4 as poor consistency.
IVIM and DKI analysis
The MADC and DKI software in Functool was used for image postprocessing by choosing the best threshold to eliminate background noise. Next, the software automatically fitted and generated Dslow, Dfast, f, mean diffusivity (MD), and mean kurtosis (MK) images. The largest tumor level was used to delineate the region of interest (ROI). The intraclass correlation coefficient (ICC) was used to assess inter-observer agreement.
ROI positioning procedure
The ROI refers to the largest level of the tumor on the T1W-enhanced sequence and was outlined on the apparent diffusion coefficient (ADC) map. This area should be far enough from the edge of the tumor to avoid errors caused by volume effects. Any areas showing bleeding, necrosis, cystic changes, myxoid area, or calcification were avoided. Next, these ROIs were copied to the IVIM and DKI images and measured in triplicate to calculate the average.
Pathological analyses
Pathological diagnoses were performed by two pathologists with 5–10 years of work experience. Disputes were resolved by a third pathologist. The patients were divided into benign and malignant groups according to the pathology results.
Statistical analyses
Statistical analysis was performed using SPSS 25.0 (IBM Corp., Chicago, IL, USA). Data were presented as mean ± standard deviation (SD). The chi-square test was used for multivariate analyses. Independent sample t test or Mann–Whitney U test was used to detect the difference in Dslow, Dfast, f, MD, and MK between the benign and malignant masses. P ≤ 0.05 was considered statistically significant. The receiver operating characteristic (ROC) curve analysis was used to evaluate the diagnostic performance of each parameter and to determine the optimal threshold for the diagnosis of benign and malignant STMs.
Results
A total of 58 patients (40 men, 18 women; mean age = 55.8 years; age range = 19–81 years) completed the imaging and had the necessary pathological data. Pathologic assessment revealed that there were 17 patients with benign STMs and 41 with malignant STMs. In total, 25 STMs were located in the thigh (benign, n = 7; malignant, n = 17), 12 in the lower legs (benign, n = 4; malignant, n = 13), 10 in the shoulders (benign, n = 4; malignant, n = 7), and 11 in the arms (benign, n = 2; malignant, n = 4). The classification of tumors is summarized in Table 1. Representative conventional and diffuse MR images of malignant leiomyosarcoma and benign fibroblastomas confirmed by pathology are shown in Figs. 2 and 3, respectively.
Characteristics of the lesion.
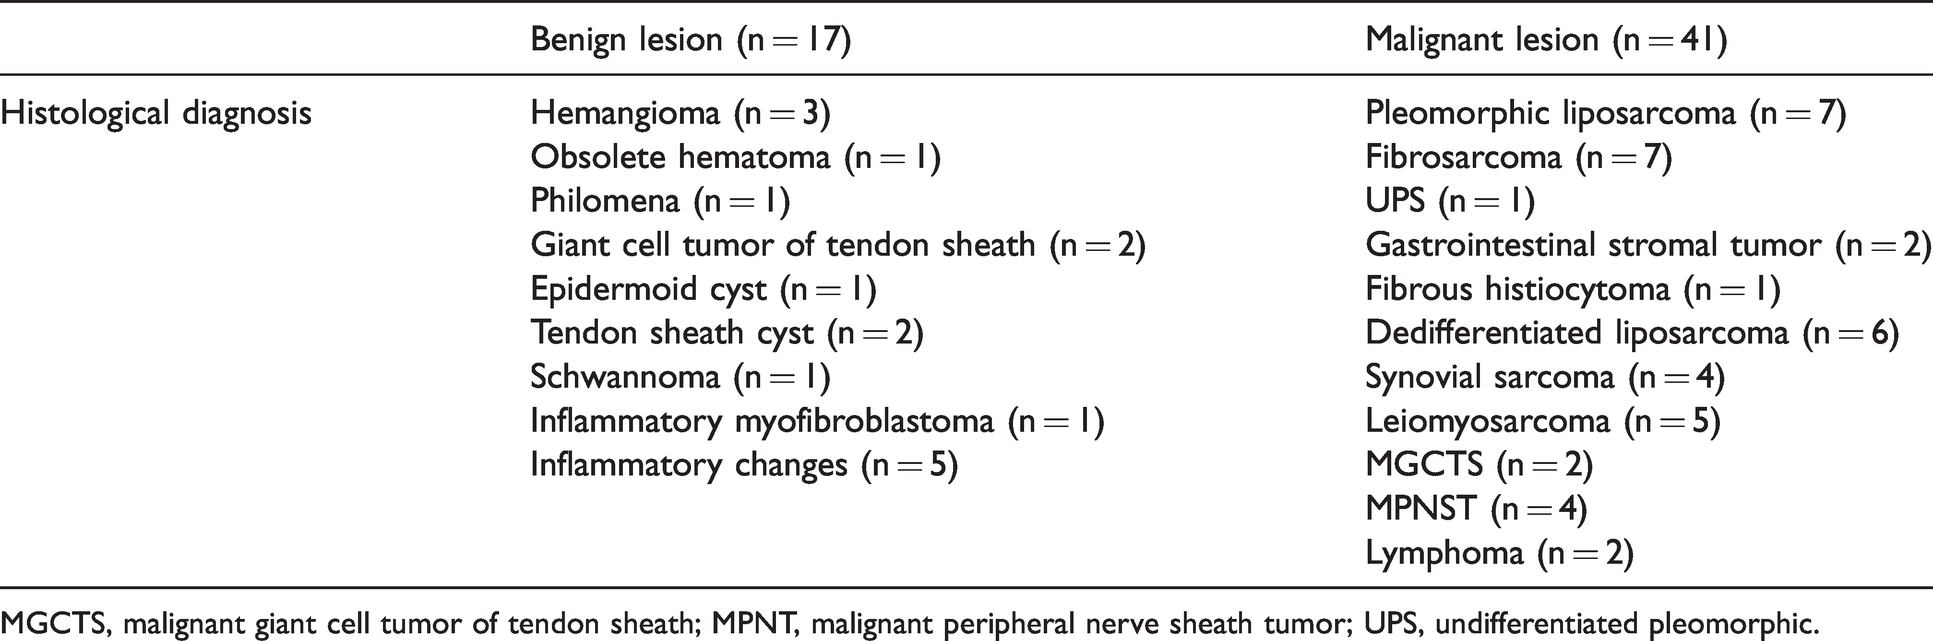
MGCTS, malignant giant cell tumor of tendon sheath; MPNT, malignant peripheral nerve sheath tumor; UPS, undifferentiated pleomorphic.
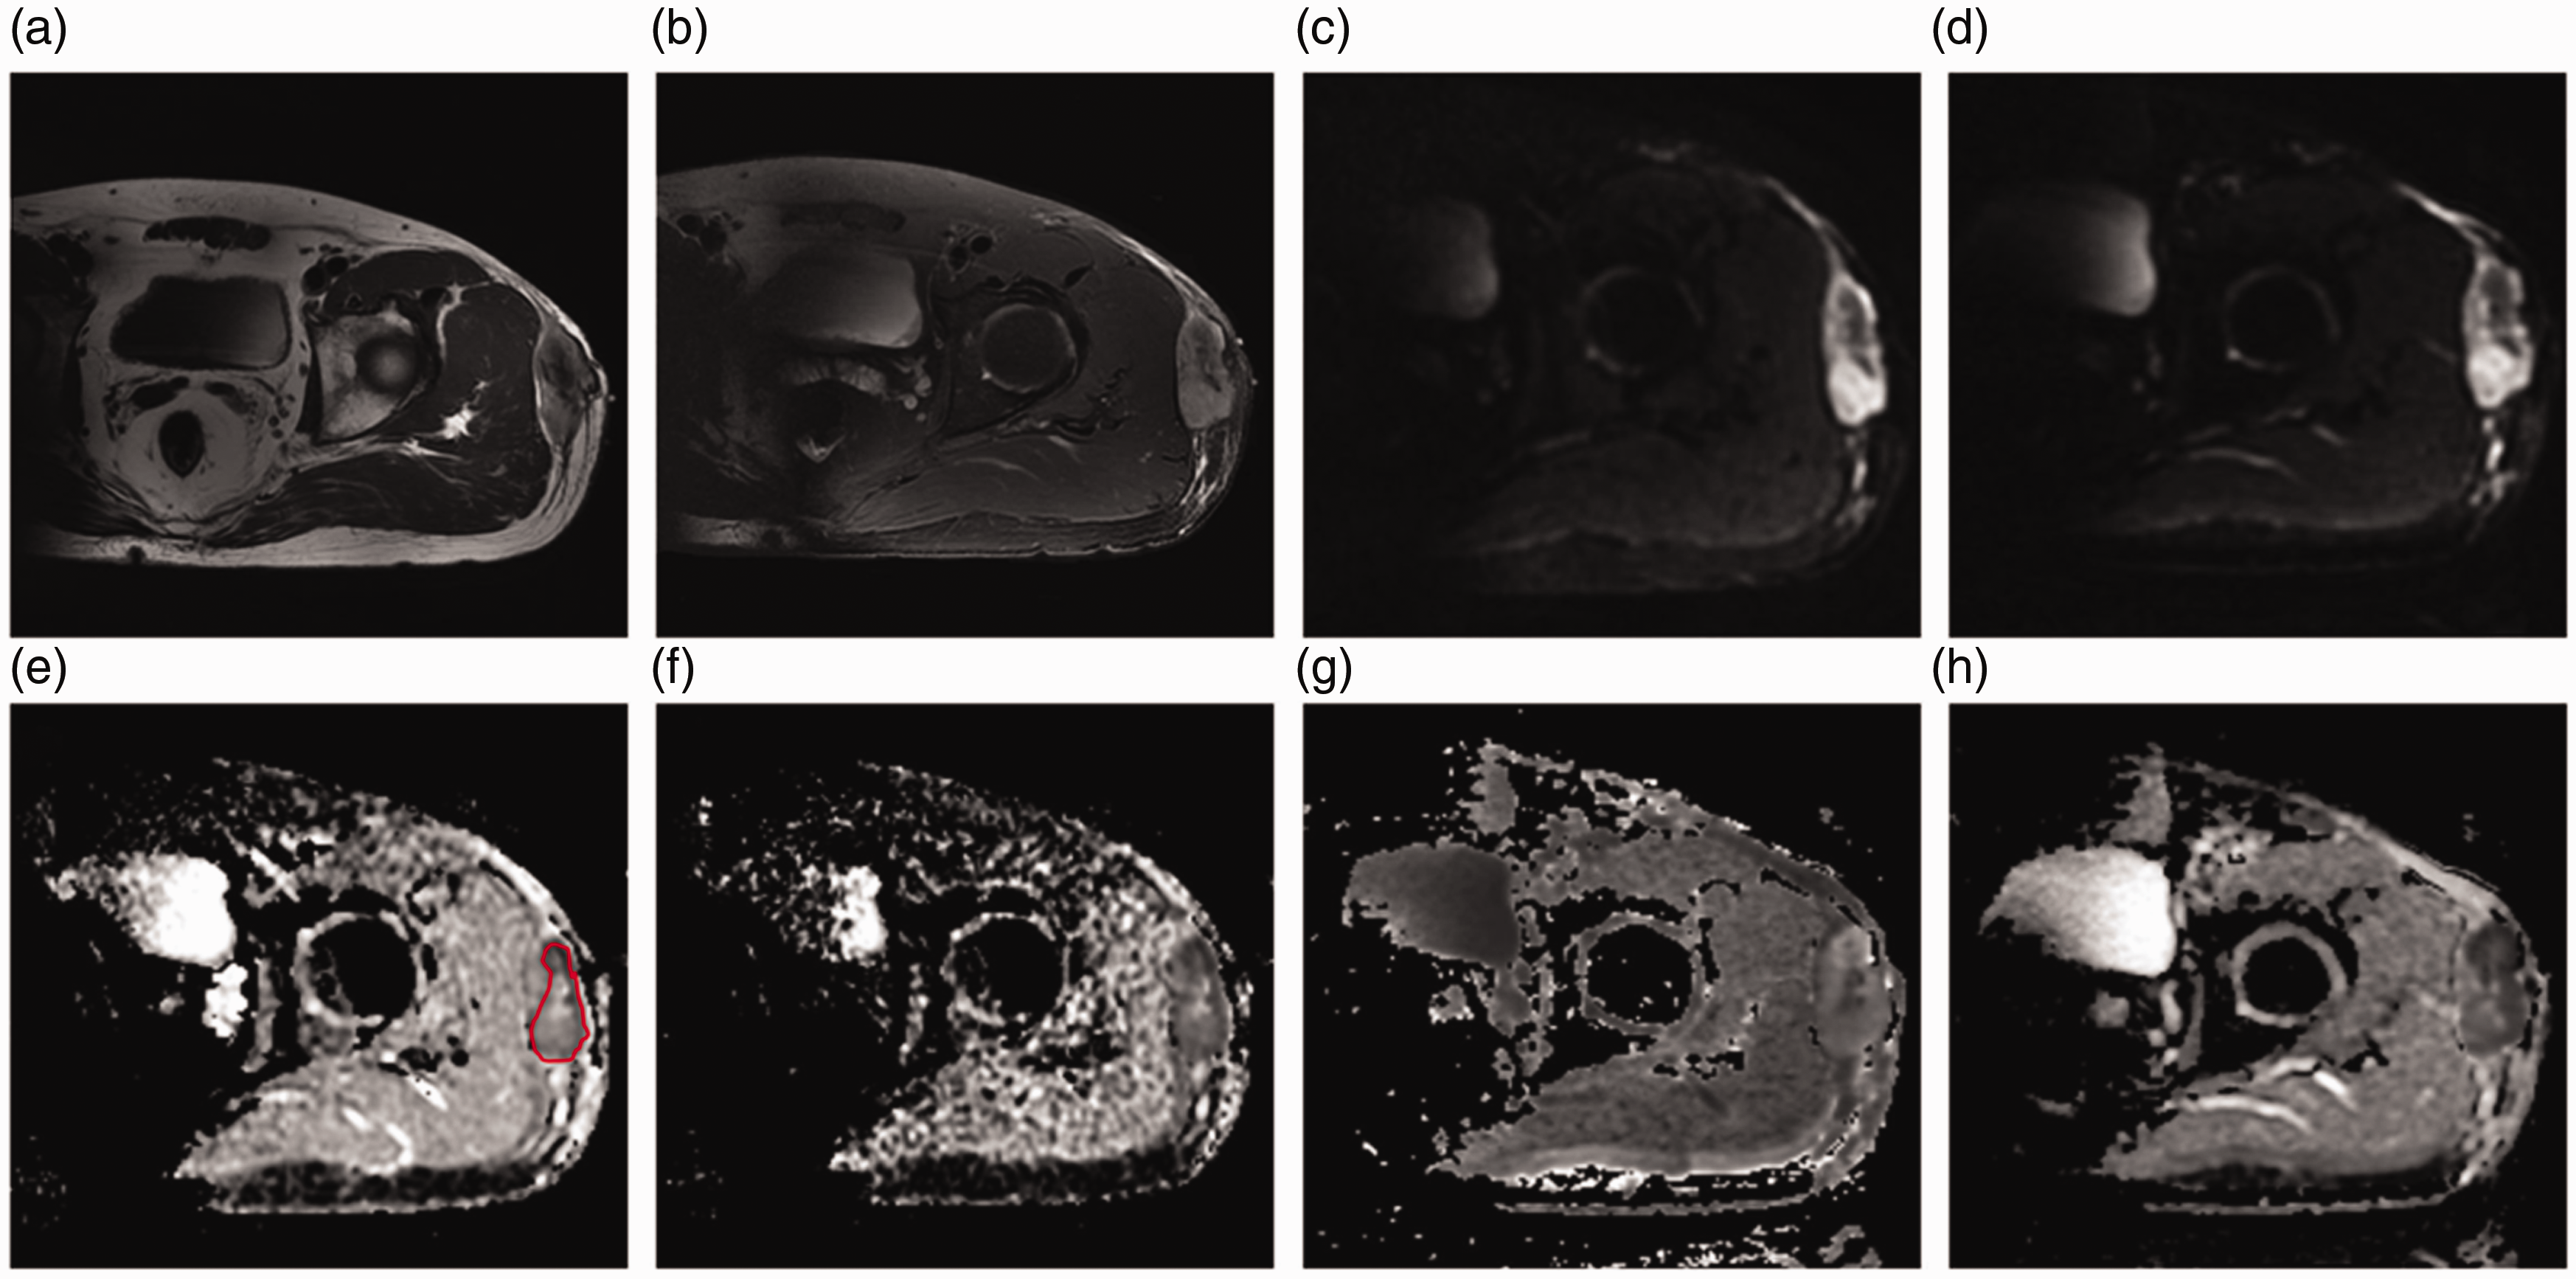
MRI of a 47-year-old man with leiomyosarcoma, showing an irregular mass in the subcutaneous fat layer of the left hip with leaves on the edge. (a) The tumor shows a contoured signal on T2W imaging; (b) the tumor signal of the fat suppression sequence has not been reduced; (c, d) tumor signal in IVIM (b = 100 s/mm2) and DKI (b = 1000 s/mm2/) is high along the edge and low in the center; (e) ADC tumors are mainly low intensity as a whole, with small patches of high-intensity shadow in the center; (f) Dslow value is 0.84 × 10⁻³ mm2/s; (g) MK value is 0.829; and (h) MD value is 1.134 mm2/s. ADC, apparent diffusion coefficient; DKI, diffusion kurtosis imaging; IVIM, intravoxel incoherent motion; MK, mean kurtosis; MD, mean diffusivity; MRI, magnetic resonance imaging; T2W, T2-weighted.
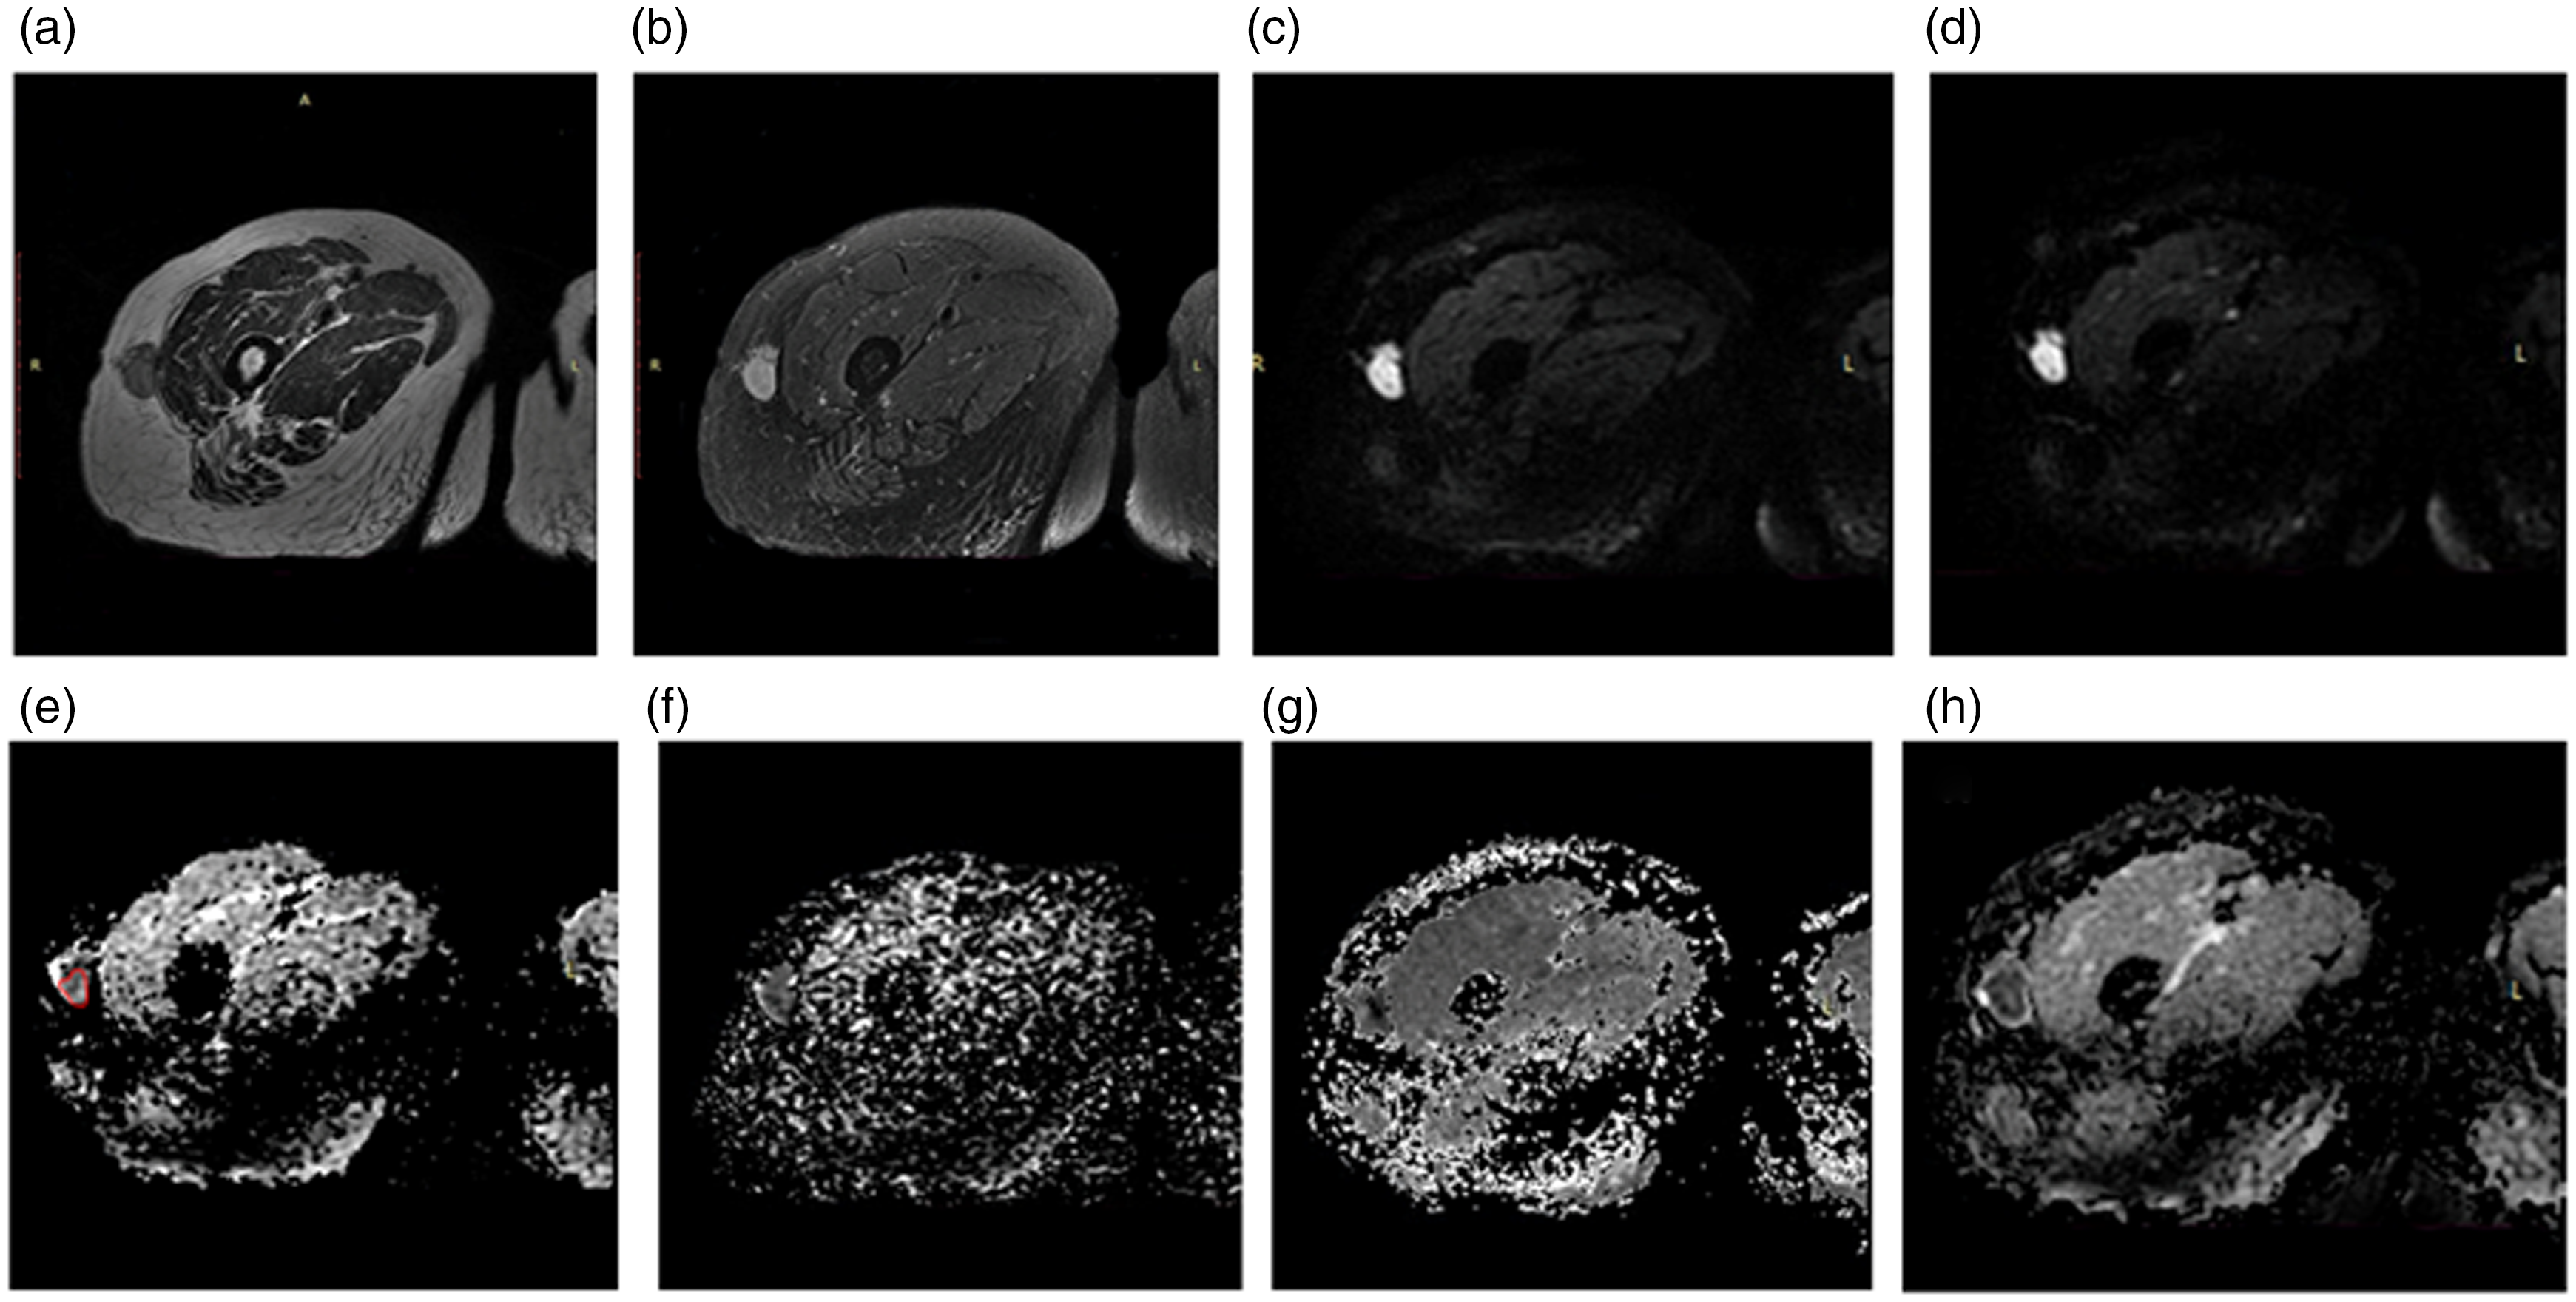
MRI of a 30-year-old woman with benign retinoblastoma, showing an oval mass in the subcutaneous fat layer on the lower and outer side of the left upper arm deltoid muscle, with clear and smooth boundaries. (a) T2W imaging shows even and isometric muscle signal; (b) no clear reduction in lipid suppression sequence; (c, d) masses show mixed signals of high and low signals in IVIM (b = 0 s/mm2) and DKI (b = 2000 s/mm2); (e) mass shows a contoured signal in ADC, and patchy low signal areas can be seen; (f) Dslow value is 0.81 × 10⁻³ mm2/s; (g) MK value is 1.043; (h) MD value is 1.162 mm2/s. ADC, apparent diffusion coefficient; DKI, diffusion kurtosis imaging; IVIM, intravoxel incoherent motion; MD, mean diffusivity; MK, mean kurtosis; MRI, magnetic resonance imaging; T2W, T2-weighted.
The two observers completed the evaluation of conventional MRI features with nearly perfect agreement. Among the conventional MRI features, only tumor size and location are statistically different in benign and malignant STMs (P = 0.032 and P = 0.029). Malignant STMs are deeper and larger than the benign tumors. The sensitivity and specificity of the size and location of benign and malignant STMs are 65.85%, 60.98%, 64.71%, and 70.59%, respectively. The accuracy of using size and depth to predict benign and malignant STMs is 65.52% and 63.79%, respectively.
Among the parameters of IVIM and DKI, the Dslow, f, MD, and MK values of the benign STMs are significantly higher than those for the malignant tumors (all P < 0.05). Differences in Dfast between the malignant and benign STMs were not statistically significant (P > 0.05). There were excellent inter-observer agreements between the two observers in the measurements of all parameters with ICC > 0.9. The characteristics and parameters of benign and malignant STMs are shown in Table 2 and Fig. 4.
Characteristics of benign and malignant STMs.
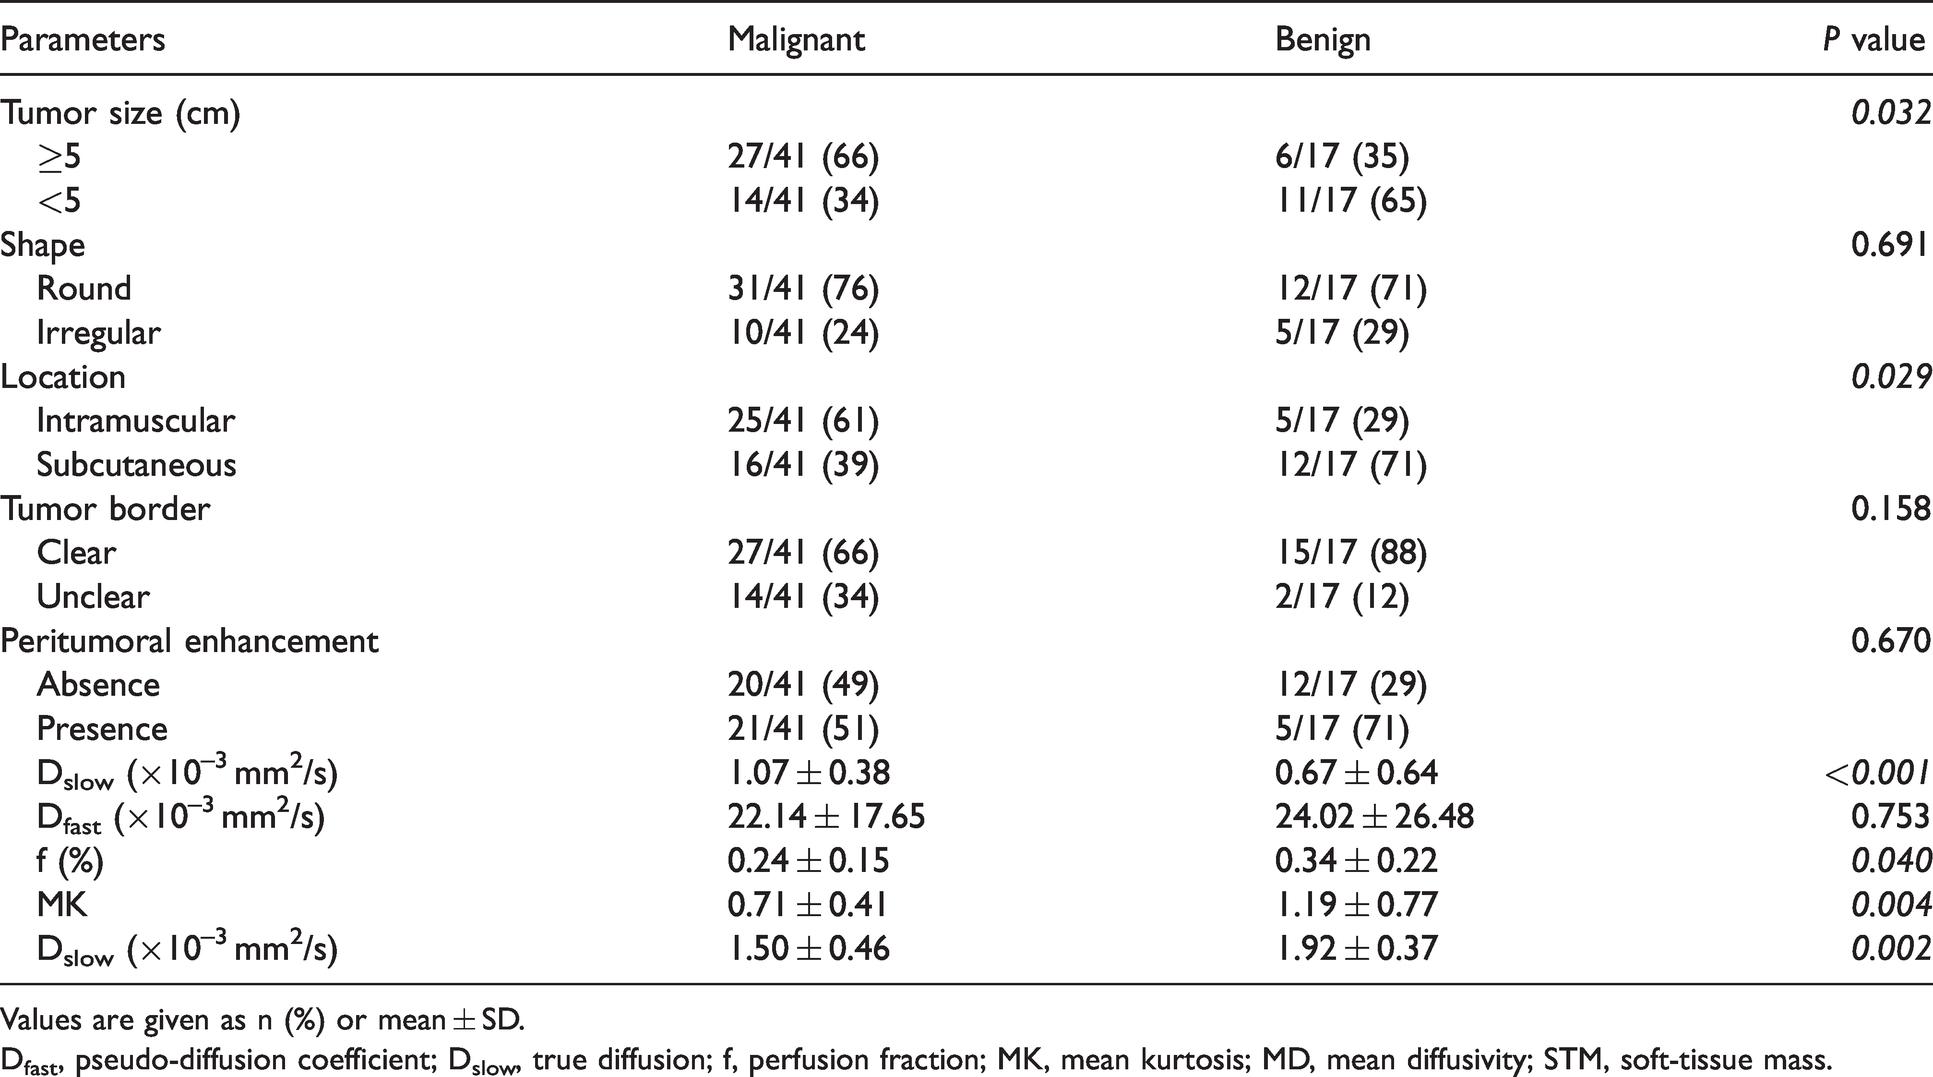
Values are given as n (%) or mean ± SD.
Dfast, pseudo-diffusion coefficient; Dslow, true diffusion; f, perfusion fraction; MK, mean kurtosis; MD, mean diffusivity; STM, soft-tissue mass.
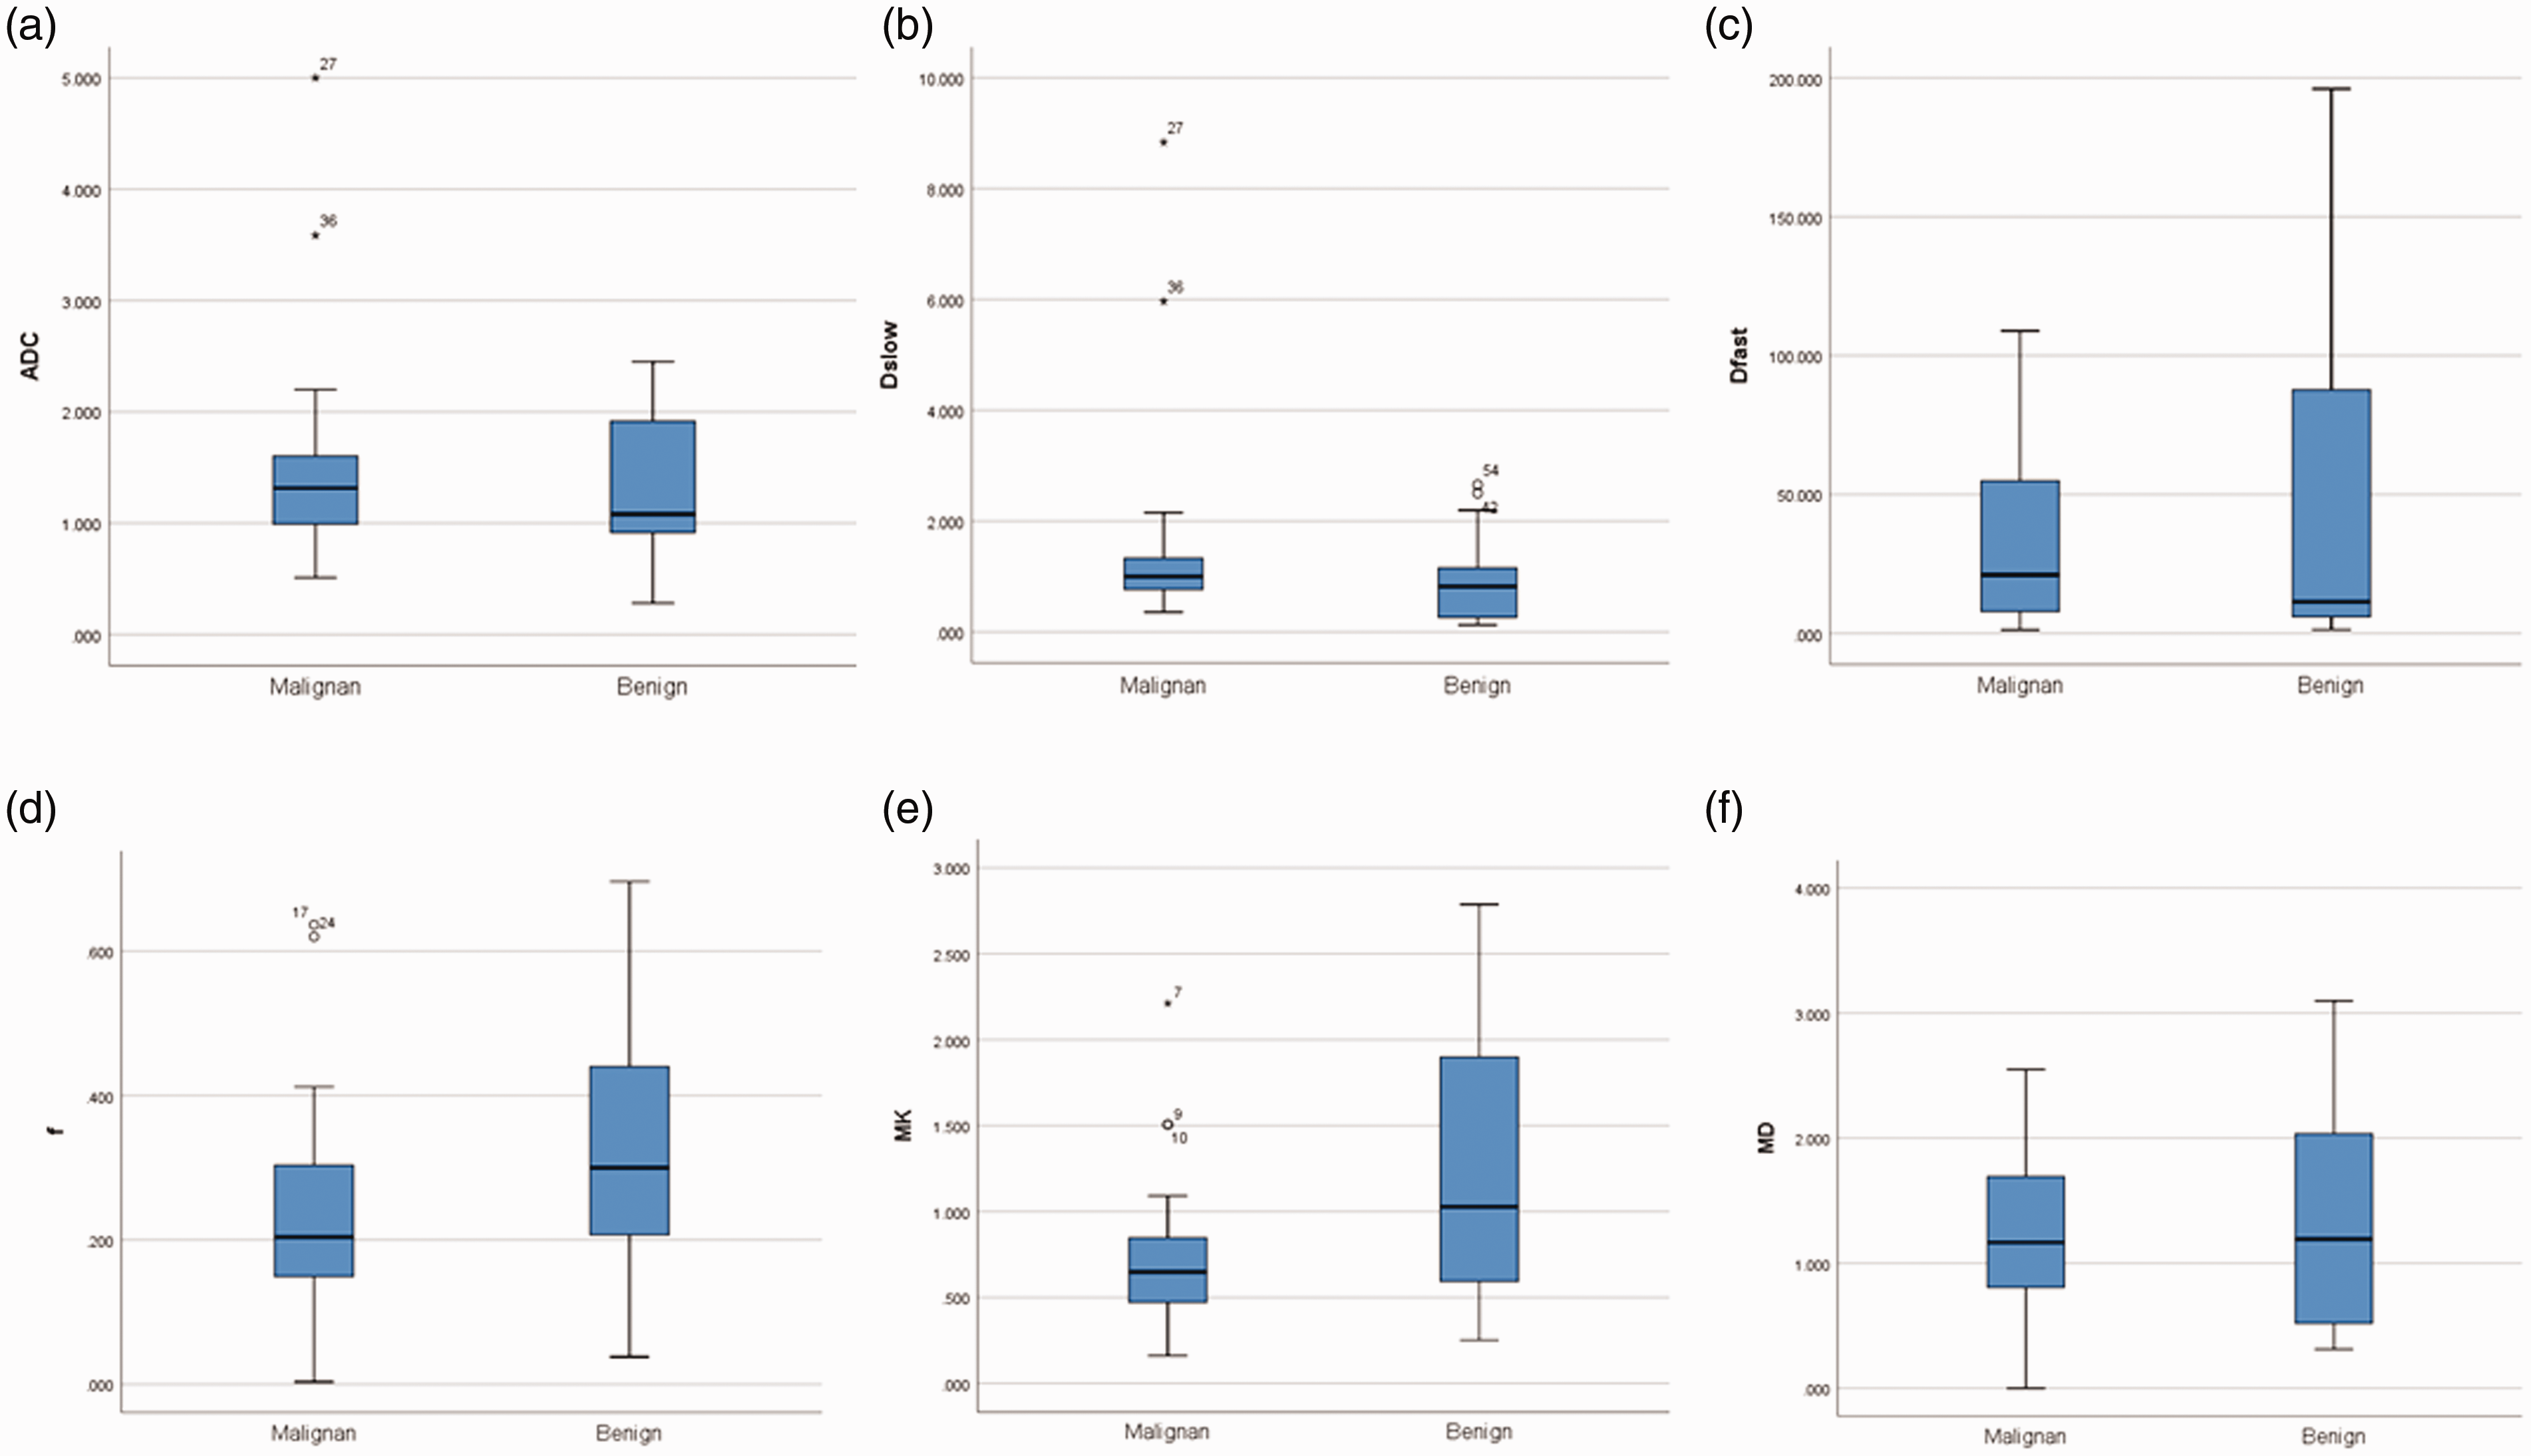
Box-and-whisker plots show the distributions of (a) Dslow, (b) Dfast, (c) f, (d) MK, and (e) MD of the malignant and benign STMs. MD, mean diffusivity; MK, mean kurtosis; STM, soft-tissue mass.
The ROC curves of IVIM and DKI for diagnosing malignant STMs are shown in Fig. 5. In the ROC analysis, Dslow shows the highest area under the curve (AUC) for distinguishing between benign and malignant STMs. The AUC of Dslow is 0.859. At the cutoff of Dslow = 0.594, the sensitivity and specificity are 76.47% and 82.93%, respectively. At the cutoff of MD = 0.423, the sensitivity and specificity are 76.47% and 65.85%, respectively. The AUC of MK (0.676) is lower than Dslow and MD in distinguishing between benign and malignant STMs. There are no significant differences in f between the two groups (P > 0.05). The P value, cutoff value, sensitivity, and specificity for each variable (Dslow, f, MK, and MD values) are shown in Table 3.
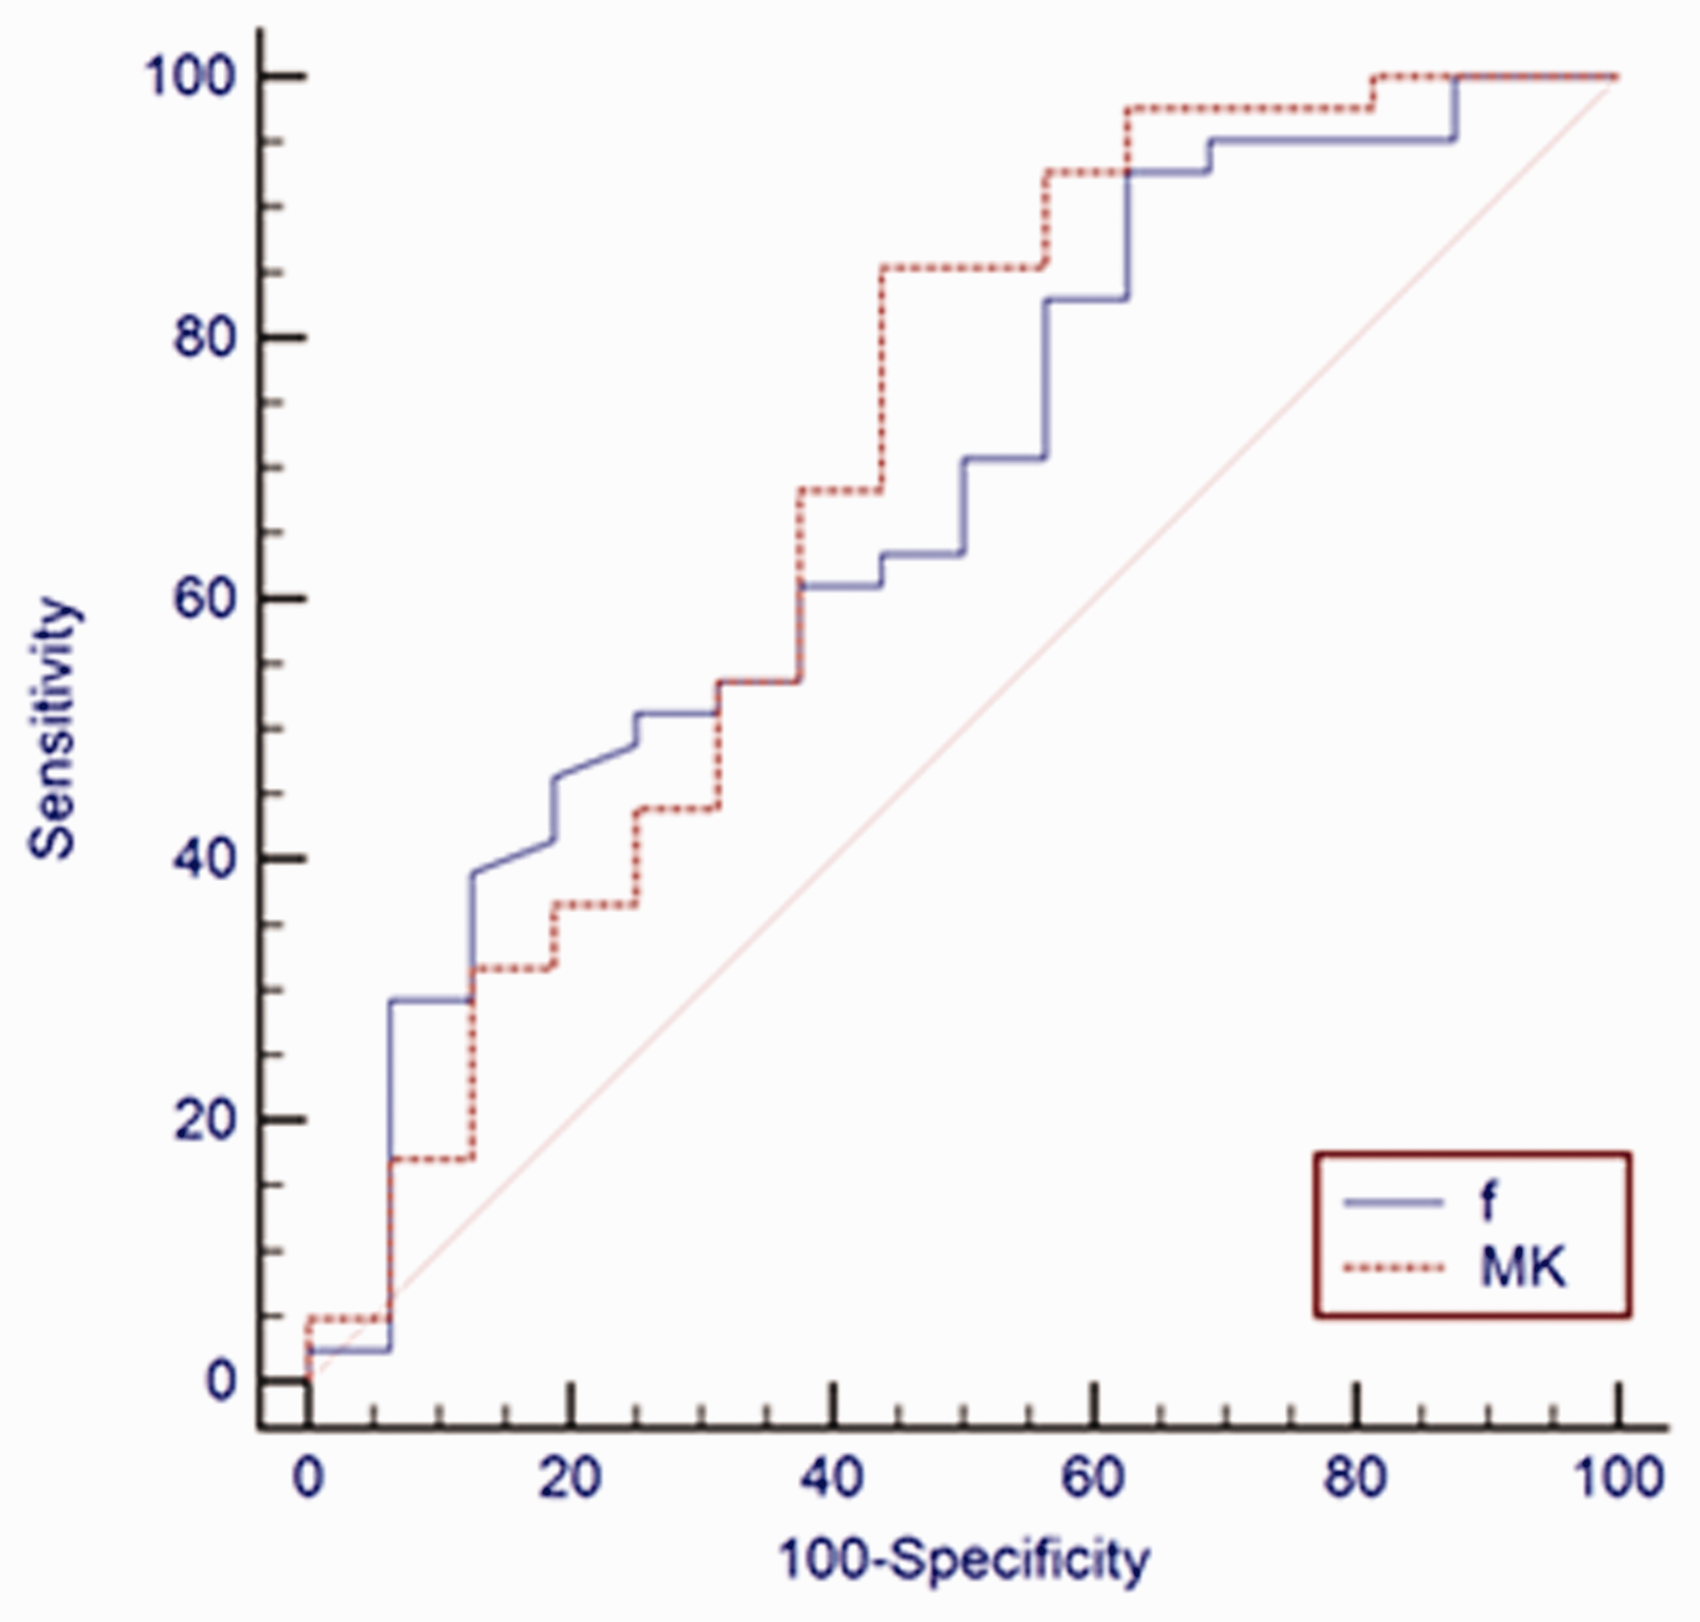
ROC curve for the diagnostic performance of Dfast, Dslow, f, MK, and MD. Dslow shows the best diagnostic performance for identifying the benign and malignant STMs. MD, mean diffusivity; MK, mean kurtosis; ROC, receiver operating characteristic; STM, soft-tissue mass.
Diagnostic performance of the IVIM and DKI parameters.

AUC, area under the curve; DKI, diffusion kurtosis imaging; Dslow, true diffusion; f, perfusion fraction; IVIM, intravoxel incoherent motion; MD, mean diffusivity; MK, mean kurtosis.
Discussion
MRI is widely used in the detection of soft-tissue lesions. Conventional MRI can provide morphological information, such as the size, shape, and location of the lesion. Our findings are similar to those of previous studies (29–31), showing that conventional MRI features, such as size and depth, have potential value in distinguishing benign and malignant STM. At the same time, we speculate that there is no statistical difference in enhancement around the tumor. It may be due to the chronic dilated hematoma that can present as enhancement around the tumor (32). Previously, Song et al. (15) studied the value of conventional MRI features in differentiating benign and malignant STTs and found that the specificity of tumor heterogeneity was 94%. Unlike their report, our results indicate that tumor heterogeneity is not statistically significant. We included some myxoid tumors and Schwannoma, which may cause the results of this study to be different from previous studies.
Due to recent advancements, IVIM and DKI provide a non-invasive method to formulate diagnostic hypotheses as close as possible to the histological diagnosis (1). IVIM and DKI can give insight into the microstructural characteristics and functional information of human tissues, such as the diffusion of water molecules and perfusion of blood in tissues. In previous reports, IVIM was shown to distinguish between benign and malignant STTs (15,29), but DKI is used less often in STTs. In the present study, we included all STMs, which expanded the scope of disease. Besides, we explored the feasibility of IVIM and DKI for distinguishing between benign from malignant STMs. Our results show that IVIM and DKI parameters (Dslow, MK, and MD) can distinguish between benign and malignant STMs. Furthermore, compared with conventional MRI, parameters Dslow and MD have more advantages in distinguishing benign from malignant STMs. In addition, we demonstrate that IVIM has better diagnostic performance than DKI.
A unique aspect of our research is that we include STMs that are not easily distinguishable from STSs. In the study by Wu et al. (25), the feasibility of IVIM and DKI in distinguishing vascular abnormalities from STSs was explored, and it was found that both IVIM and DKI are effective diagnostic methods. Moreover, MK has the highest diagnostic value, which is different from our research. This may be because of the variable scanning position and the instability of the DKI sequence. According to the ROC analysis, Dslow is the most diagnostic marker for distinguishing benign from malignant STMs among all the parameters. Dslow is the true diffusivity, reflecting the pure diffusion information of water molecules in the tissue. This finding is consistent with previous reports (16,29). Previously, Wu et al. (16) and Lim et al. (29) found that Dslow is more accurate than Dfast and f for distinguishing between benign and malignant STTs. Moreover, in their study, the Dslow value for malignant STTs was less than that of benign tumors. In addition, Liu et al. (10) reported that the Dslow value of malignant breast cancer is significantly smaller than that of benign lesions. Lastly, Sumi et al. (33) showed that the Dslow value of malignant salivary gland tumors is significantly different from benign salivary gland tumors. This may be due to the sensitivity of Dslow to tissue cell density. The cell density of malignant lesions is higher than that of benign lesions, further limiting the diffusion of water molecules.
Furthermore, the present study also shows that the perfusion-related parameters Dfast and f are not statistically significant in distinguishing benign and malignant STMs, consistent with the results reported by Lim et al. (29) and Xu et al. (34). In the research by Lim et al., there was no significant difference in Dfast or f-value between benign and malignant musculoskeletal tumors. Dfast is the pseudo-diffusion coefficient, reflecting the blood perfusion information in the tissue. The f-value reflects the volume ratio of the perfusion diffusion effect in the tissue to the total diffusion effect. Dfast and f-values are not useful parameters due to the high degree of heterogeneity in the lesions. In addition, the perfusion difference between benign STMs and malignant STMs may not be obvious. The present study demonstrates that malignant lesions have lower f-values than benign lesions, similar to previous findings (35). Furthermore, our results agree with another study that suggested that the f-value has the highest specificity for identifying benign and malignant STTs (16). Previously, Wu et al. (16) found that the f-value is not statistically significant but has the highest specificity. Hence, the f-value reflects the richness of capillaries. The similar f-values between benign and malignant STMs may be due to the similar and heterogenous vascularity of different lesions. In addition, inflammatory lesions may have more new capillaries.
DKI can reflect the complexity of tissues, while MK primarily reflects the complexity and restriction of the diffusion of water molecules. The MK value is proportional to the complexity of the structure. What is different from previous research is that we found that the MK value of malignant lesions is lower than that of benign lesions. In the study by Ogawa et al. (36), the average MK value of benign musculoskeletal tumors was less than that of malignant tumors. In another previous study, Wan et al. (22) found that the MK value of malignant solitary pulmonary lesions was lower than that of benign lesions. This may be because of the inclusion of benign lesions with inflammatory changes or abscesses as inflammatory cell infiltration and fibrous hyperplasia may complicate the tissue microenvironment.
In the present study, we found that the MD of benign patients (1.92 ± 0.37) is higher than that of malignant patients (1.50 ± 0.46), similar to the findings by Wan et al. (22). MD stands for the diffusion coefficient, which is corrected for the barrier effect caused by the potential interaction with the microstructure of the tissue (36,37). The MD of malignant STMs is often lower than that of benign lesions, likely for the same reason as the Dslow value. The complex organizational structure of the malignant mass limits the diffusion of water molecules.
Unlike previous studies where the AUC of DKI is higher than that of IVIM for the diagnosis of benign and malignant tumors (19,25), our results further show that the Dslow of IVIM has the highest diagnostic value. This is similar to the results of some scholars. Li et al. (38) showed that IVIM is superior to DKI in the diagnosis of ovarian tumors. In addition, Das et al. (39) applied DKI for pulmonary nodules and found that DWI was superior to DKI in distinguishing between benign and malignant lung nodules. In another study, Rosenkrantz et al. (23) proposed that DKI sequences require at least three b-values and directions for success. Technically, the highest b-value used DKI needs to be > 1500 s/mm2. In addition, to avoid the perfusion effect of b-values < 200 s/mm2, we chose three b-values of 0, 1000, and 2000 s/mm2. The optimal b-value selection in STSs has not been reported. Therefore, different experimental results demonstrate that more cases are needed to advance DKI research.
The present study has some limitations. First, the number of patients we collected was limited, and the variety of lesions was widespread. This may lead to selection bias. Therefore, we need more cases to verify our findings. In addition, we outlined the ROIs in the most restricted area of the tumor. Due to the heterogeneity of STSs, we chose ROIs that avoided necrotic and calcified areas. Hence, measurement errors will be inevitable for STSs with high tumor heterogeneity. Finally, the presence of inflammatory lesions in the study may cause some deviations.
In conclusion, our findings indicate that IVIM and DKI can distinguish benign and malignant STMs better than conventional MRI features. The derivative parameter (Dslow) has the most diagnostic value for IVIM. When combined with the MK value, we can improve the specificity of the diagnosis. These findings may help differentiate between benign and malignant STMs in real time, allowing for enhanced clinical treatment and prognostic evaluation in the clinic.
Footnotes
Declaration of conflicting interests
The author(s) declared no potential conflicts of interest with respect to the research, authorship, and/or publication of this article.
Funding
The author(s) received the following financial support for the research, authorship, and/or publication of this article: This work was funded by The National Natural Science Foundation of China (No. 81771804).
