






Abstract
Background
Accurate preoperative assessment of endometrial cancer (EC) is crucial in young women who may be eligible for fertility-preserving therapy, which is generally limited to patients with grade 1, endometrioid-type tumors without myometrial invasion (MI).
Purpose
To evaluate the utility of quantitative parameters derived from intravoxel incoherent motion (IVIM) and diffusion kurtosis imaging (DKI) for improving the diagnostic performance of magnetic resonance imaging (MRI).
Material and Methods
This retrospective study included 107 patients diagnosed with EC (mean age = 59 years; age range = 25–89 years) who underwent preoperative MRI, including multiple b-value (0–2000 s/mm2) diffusion-weighted imaging, between January 2022 and March 2024. Quantitative parameters were extracted from the mono-exponential (ADC), IVIM (Di, D*, f), and DKI (Dk, K) models and compared across clinical and pathological features.
Results
ADC, Di, and Dk values were significantly higher in patients without MI (P = 0.015, 0.035, and 0.005, respectively). Di and Dk were significantly higher (P = 0.003 and 0.016), and K was significantly lower (P = 0.013) in the G1 group. Patients eligible for fertility preservation had significantly higher ADC, Di, and Dk values (P = 0.002, 0.002, and 0.001) and significantly lower K values (P = 0.044). The overall diagnostic performance of these parameters was moderate (area under the curve < 0.70).
Conclusion
IVIM and DKI-derived metrics may enhance preoperative assessment of tumor grade and MI, supporting decisions regarding fertility-preserving treatment.
Keywords
Introduction
Endometrial cancer (EC) is the most common gynecologic malignancy and the sixth most common cancer among women (1). Its prognosis largely depends on histopathological characteristics, including tumor grade and local stage, which guide risk stratification and adjuvant therapy decisions (2–5). EC is broadly categorized into non-aggressive and aggressive histological subtypes. Non-aggressive types include endometrioid adenocarcinoma grade 1 (G1) and grade 2 (G2), which are associated with favorable outcomes. In contrast, aggressive subtypes—including grade 3 (G3), serous carcinoma (SC), clear cell carcinoma (CCC), undifferentiated carcinoma, and carcinosarcoma—are linked to a poorer prognosis (4,5).
Magnetic resonance imaging (MRI) is the gold standard for the preoperative assessment of EC due to its excellent soft-tissue contrast (6,7). Diffusion-weighted imaging (DWI), in particular, plays a central role, providing diagnostic capabilities comparable to contrast-enhanced MRI and enabling evaluation of tumor extension (8). The apparent diffusion coefficient (ADC) from DWI helps differentiate malignant from benign lesions and assess tumor grade (9). However, conventional MRI has limitations in accurately diagnosing tumor grade and myometrial invasion (MI) (10). Although hysterectomy remains the standard treatment for EC, fertility-preserving therapy may be considered for patients who desire future childbearing if the tumor is confined to the endometrium. Advanced DWI techniques, such as intravoxel incoherent motion (IVIM) and diffusion kurtosis imaging (DKI), derived from multi-b-value acquisitions, allow for model-based evaluation of tissue microstructure and perfusion. IVIM, introduced by Le Bihan, provides three key parameters: diffusion coefficient (Di), perfusion-related diffusion (D*), and perfusion fraction (f) (11). Di reflects pure molecular diffusion, D* represents perfusion-related diffusion from microcirculatory flow, and f quantifies the fraction of tissue volume affected by perfusion. DKI, introduced by Jensen et al., captures non-Gaussian diffusion behavior, allowing for the evaluation of tissue complexity and heterogeneity. The diffusion coefficient obtained from DKI (Dk) is considered to reflect true molecular diffusion more accurately by accounting for non-Gaussian water movement. The kurtosis parameter (K) serves as an indicator of microstructural complexity (12). Quantitative parameters derived from IVIM and DKI have shown utility in differentiating histological grades and clinical stages in various tumors (13–15). However, limited studies have assessed their use specifically in EC.
We hypothesize that IVIM and DKI-derived parameters reflect key histopathological features of EC, such as tumor grade and MI, and can help identify patients suitable for fertility-preserving therapy. The aim of the present study was to evaluate whether IVIM and DKI parameters can improve the preoperative diagnosis of EC, with particular emphasis on identifying patients eligible for fertility-preserving treatment.
Material and Methods
Study design
This retrospective study was approved by the Institutional Review Board of our hospital (approval number: R05-098). The requirement for written informed consent was waived.
Patients included in this study underwent MRI before surgery or biopsy and were pathologically diagnosed with endometrial epithelial cancer between January 2022 and March 2024. Patients were excluded if they lacked pathological confirmation of EC, did not undergo IVIM and DKI imaging, or were not scanned using the designated MRI machine. A flowchart outlining the patient selection process is presented in Fig. 1.

Flowchart of the patient selection process. DWI, diffusion-weighted imaging; MRI, magnetic resonance imaging.
Clinicopathological data—age, menopausal status, histological type, MI, lymphovascular space invasion (LVI), lymph node metastasis, and International Federation of Gynecology and Obstetrics (FIGO) stage—were retrieved from the hospital's electronic medical records system. The FIGO 2023 staging system was applied (4). Fertility-preserving therapy is considered only in G1 EC cases without MI.
Imaging protocol
MRI was performed using 3-T scanners (Ingenia and MR7700; Philips Medical Systems, Amsterdam, the Netherlands). The protocol included T1-weighted (T1W) imaging, T2-weighted (T2W) imaging, DWI with b-values of 0 and 1000 s/mm2, as well as ADC maps. Multi-b-value DWI (b = 0, 50, 100, 1000, 1500, and 2000 s/mm²) was performed. In addition, dynamic contrast-enhanced T1W imaging and contrast-enhanced T1W (CE-T1W) imaging were performed. All images were acquired in the axial plane, perpendicular to the long axis of the uterine body. For CE-T1W imaging, gadopentetate dimeglumine (Gadovist 1.0 M; Bayer AG, Leverkusen, Germany) was administered at a concentration of 5 mmol. The contrast agent was injected intravenously at a rate of 4 mL/s (2 mmol/s), diluted with saline, and four-phase images were obtained at intervals of 30 s, beginning 15 s after contrast injection. To reduce motion artifacts caused by bowel peristalsis, hyoscine butylbromide (20 mg, Buscopan; Sanofi, France) was administered intramuscularly to all patients immediately before the examination, unless contraindicated. Further imaging parameters are provided in Table 1.
Acquisition parameters of MRI.

T1W, T1-weighted; T2W, T2-weighted; CE-T1W, contrast-enhanced T1-weighted; DCE-T1W, dynamic contrast-enhanced T1-weighted imaging; DWI, diffusion-weighted imaging; EPI, echo planar imaging; GRE, gradient echo; SPIR, spectral presaturation with inversion recovery; TSE, turbo spin echo.
Image interpretation
Multi-b-value DWI data were analyzed using a PACS workstation (Portal V12.1.5; Philips Medical Systems, Amsterdam, the Netherlands). Three radiologists (TS, MY, and SS; with 20, 10, and 9 years of experience in gynecologic diagnostic imaging, respectively) independently performed the analysis. The radiologists were blinded to the patients’ surgical and pathological results. Regions of interest (ROIs) were manually drawn to encompass the tumor areas on ADC, Di, D*, f, Dk and K maps. ROIs were manually drawn once on one parametric map and were automatically copied and applied to all other maps (ADC, Di, D*, f, Dk, and K) to ensure consistency across parameters. Relatively small ROIs were placed with reference to all available images, including CE-T1W imaging, avoiding necrotic or hemorrhagic areas and to focus on the solid portion of the tumor, in accordance with previous recommendations for uterine sarcomas (16). ADC was calculated using the multi-b-value method, based on the equation: ln(S(b)/S0) = −;b⋅ ADC using b-values of 0, 50, 100, 1000, 1500, and 2000 s/mm2. IVIM was calculated using the bi-exponential model: S(b)/S0 = f⋅ e−;bD* + (1-f ⋅e−;bD) using the same six b-values on a pixel-by-pixel basis (11). K was calculated using the mono-exponential model: In (S(b)/S0) = −;b ⋅ Dk + b2⋅ Dk2⋅K/6 using b-values of 0, 50, 100, 1000, 1500, and 2000 s/mm2 on a pixel-by-pixel basis (12).
Statistical analysis
Using the average of the three radiologists’ measurements for each case, differences in the mean values and standard deviations of quantitative IVIM and DKI parameters were calculated. These differences were assessed and compared based on qualitative variables with two or more categories, including menopausal status, tumor grade, histological type, tumor aggressiveness, presence or absence of MI and LVI, positive or negative pelvic lymph node metastasis, FIGO stage, and eligibility for fertility-preserving therapy. The Mann–Whitney U-test was applied for pairwise comparisons, while the Kruskal–Wallis test was used for comparisons involving multiple categories. Independent risk factors were identified using binary logistic regression to construct a risk-prediction model, with model discrimination and calibration evaluated using the Hosmer–Lemeshow test. Receiver operating characteristic (ROC) curve analysis was performed, and the area under the ROC curve (AUC) was used to determine cutoff values for parameters that significantly distinguished each variable. The diagnostic value was classified based on the AUC as follows: poor = 0–0.70; moderate = 0.70–0.90; and high = 0.90–1.00. Confidence intervals were estimated at 95%.
Inter-observer agreement among the three radiologists was assessed using the intraclass correlation coefficient (ICC). The ICC values were interpreted as follows: poor <0.50; moderate = 0.50–0.75; good = 0.75–0.90; and excellent >0.90.
All statistical analyses were conducted using SPSS Statistics 28.0 (IBM Corp., Armonk, NY, USA), with statistical significance set at P < 0.05.
Results
A total of 107 women were included in the study (mean age = 59 years; age range = 25–89 years). Table 2 presents the patient characteristics, pathological classifications of EC, and FIGO 2023 stages. Among them, 104 patients underwent hysterectomy, allowing for pathological determination of tumor stage and histological type. Three patients with stage IV disease were diagnosed via biopsy alone. Preoperative MRI findings guided the decision-making for pelvic lymph node dissection. Patients without suspected MI underwent biopsy alone, while those with suspected MI underwent lymph node dissection.
Characteristics of patients and lesions.

Values are given as n or mean ± SD (range).
FIGO, International Federation of Gynecology and Obstetrics.
ADC, Di, f, D*, Dk, and K values for menopausal status, tumor grade, histological type, MI, LVI, lymph node metastasis, and FIGO stage are detailed in Table 3. The mean ROI size was 29.32 mm² (range = 2.75–137.09 mm²). Di and Dk were significantly higher (P = 0.003 and 0.016, respectively), and K was significantly lower (P = 0.013) in the G1 tumor group compared to the non-G1 tumor group. Similarly, Di and Dk were significantly higher in non-aggressive histological types than in aggressive histological types (P = 0.047 and 0.042, respectively). K was significantly lower in endometrioid group than in non-endometrioid group (P = 0.045). For staging, ADC, Di, and Dk were significantly higher in stage 1A1 tumors than in non-stage 1A1 tumors (P = 0.021, 0.047, and 0.001, respectively). In addition, ADC, Di, and Dk were significantly lower in the tumors with MI than in the tumors without MI (P = 0.015, 0.035, and 0.005, respectively). The group eligible for fertility preservation, defined as G1 tumors without MI, exhibited significantly higher ADC, Di, and Dk (P = 0.002, 0.002, and 0.001, respectively) and a lower K (P = 0.044) compared to other groups. Table 4 summarizes these findings. Binary logistic regression with the Hosmer–Lemeshow test indicated that Di had a greater influence than ADC in distinguishing G1 tumors without MI. In addition, tumor grade G1 was identified as a significant factor that reduced the risk of MI. Although none of AUC values exceeded 0.70, the highest AUC values for ADC and Di were observed in the eligibility assessment for fertility-preserving therapy among all evaluated parameters.
Results of IVIM and DKI parameters by histological type, grading, and FIGO staging.

The P value represents the statistical result of a comparison between the target group and the others.
ADC, apparent diffusion coefficient; Di, diffusion coefficient derived from IVIM analysis; D*, pseudo diffusion; Dk, diffusion coefficient derived from DKI analysis; DKI, diffusion kurtosis imaging; f, perfusion fraction; FIGO, International Federation of Gynecology and Obstetrics; IVIM, intravoxel incoherent motion; K, kurtosis.
Results of P value and AUC for comparison factors and their combinations.

Values in parentheses are 95% CIs.
*P < 0.05
ADC, apparent diffusion coefficient; AUC, area under the receiver operating characteristic curve; Di, diffusion coefficient derived from intravoxel incoherent motion analysis; D*, pseudo diffusion; Dk, diffusion coefficient derived from DKI analysis; DKI, diffusion kurtosis imaging; f, perfusion fraction; FIGO, International Federation of Gynecology and Obstetrics; IVIM, intravoxel incoherent motion; K, kurtosis; LVI, lympho-vascular space invasion; MI, myometrial invasion.
Fig. 2 shows a G1 case without MI, considered eligible for fertility preservation. Figs. 3–5 show ineligible cases: G1 case with shallow MI (Fig. 3), G2 case with stage IB (Fig. 4), and CCC case with MI (Fig. 5), respectively.

A 45-year-old woman with endometrioid carcinoma (G1), no myometrial invasion, FIGO (2023) stage 1A1. (a) T2W imaging; (b) DWI; (c) ADC maps; (d) fat-saturated CE-T1W imaging; (e) Di map; (f) f map; (g) D* map; (h) K map. (a) On T2W imaging, a tumor with heterogeneous low-signal intensity is observed in the uterine cavity (arrow). (b, c) No obvious diffusion restriction is seen in the tumor (arrows). (d) On CE-T1W imaging, the tumor exhibits weaker enhancement than the myometrium (arrow). (e–h) Three radiologists independently placed the ROIs on the tumor (arrows). The mean values of ADC, Di, f, D*, Dk, and K for endometrial cancer, calculated using multi-b-value DWI, were 0.91 × 10−³ mm²/s, 1.35 × 10−³ mm²/s, 0.11, 6.71 × 10−³ mm²/s, 2.09 × 10−³ mm²/s, and 0.60, respectively. ADC, apparent diffusion coefficient; CE, contrast-enhanced; DWI, diffusion-weighted imaging; T1W, T1-weighted; T2W, T2-weighted.

A 25-year-old woman with endometrioid carcinoma (G1), minimal myometrial invasion, FIGO (2023) stage 1A2. (a) T2W imaging; (b) DWI; (c) ADC maps; (d) fat-saturated CE-T1W imaging; (e) Di map; (f) f map; (g) D* map; (h) K map. (a) On T2W imaging, a low-intensity tumor is observed in the uterine cavity (arrow). (b) The tumor exhibits high signal intensity on DWI (arrow), though the signal decrease in (c) the ADC map is unclear (arrow). (d) On CE-T1W imaging, the tumor on the left side shows weaker enhancement than the myometrium (arrow). (e–h) Three radiologists independently placed the ROIs on the tumor (arrows). The mean values of ADC, Di, f, D*, Dk, and K for endometrial cancer, calculated using multi-b-value DWI, were 0.85 × 10−³ mm²/s, 1.02 × 10−³ mm²/s, 0.31, 30.82 × 10−³ mm²/s, 1.90 × 10−³ mm²/s, and 0.73, respectively. ADC, apparent diffusion coefficient; CE, contrast-enhanced; DWI, diffusion-weighted imaging; T1W, T1-weighted; T2W, T2-weighted.

A 74-year-old woman with FIGO (2023) stage IB endometrioid carcinoma (G2), with myometrial infiltration measuring 12.5/13 mm. (a) T2W imaging; (b) DWI; (c) ADC maps; (d) fat-saturated CE-T1W imaging; (e) Di map; (f) f map; (g) D* map; (h) K map. A mass replacing the uterine body is observed. (a) On T2W imaging, it exhibits low signal intensity compared to the normal endometrium (arrow). (b) On DWI, the lesion appears as a high-signal area (arrow), with a decrease in signal intensity on (c) the ADC map (arrow). (d) Post-contrast T1W imaging demonstrates weak enhancement (arrow). (e–h) ROI was placed on the tumor, and IVIM and DKI maps were obtained. The mean values of ADC, Di, f, D*, Dk, and K for endometrial cancer, calculated using multi-b-value DWI, were 0.51 × 10−³ mm²/s, 0.49 × 10−³ mm²/s, 0.16, 6.51 × 10−³ mm²/s, 0.72 × 10−³ mm²/s, and 0.99, respectively. ADC, apparent diffusion coefficient; CE, contrast-enhanced; DWI, diffusion-weighted imaging; T1W, T1-weighted; T2W, T2-weighted.

A 64-year-old woman with FIGO (2023) stage IIC clear cell carcinoma, with myometrial infiltration measuring 4/13 mm. (a) T2W imaging; (b) DWI; (c) ADC maps; (d) fat-saturated CE-T1W imaging; (e) Di map; (f) f map; (g) D* map; (h) K map. A mass-like lesion is observed in the uterine cavity. (a) On T2W imaging, the lesion exhibits low signal intensity compared to the normal endometrium (arrow). (b) On DWI, it appears as a high-signal area (arrow), with a slight decrease in signal intensity on (c) the ADC map (arrow). (d) Post-contrast T1W imaging shows weak enhancement (arrow). (e–h) ROI was placed on the tumor, and IVIM and DKI maps were obtained. The mean values of ADC, Di, f, D*, Dk, and K for endometrial cancer, calculated using multi-b-value DWI, were 0.52 × 10−³ mm²/s, 0.47 × 10−³ mm²/s, 0.43, 8.71 × 10−³ mm²/s, 1.26 × 10−³ mm²/s, and 1.11, respectively. ADC, apparent diffusion coefficient; CE, contrast-enhanced; DWI, diffusion-weighted imaging; T1W, T1-weighted; T2W, T2-weighted.
Table 5 presents the interobserver agreement among the three radiologists. The ICC for ADC was 0.93 and for Dk was 0.94, both of which were among the highest values across all parameters, indicating excellent agreement.
Inter-observer consistency.
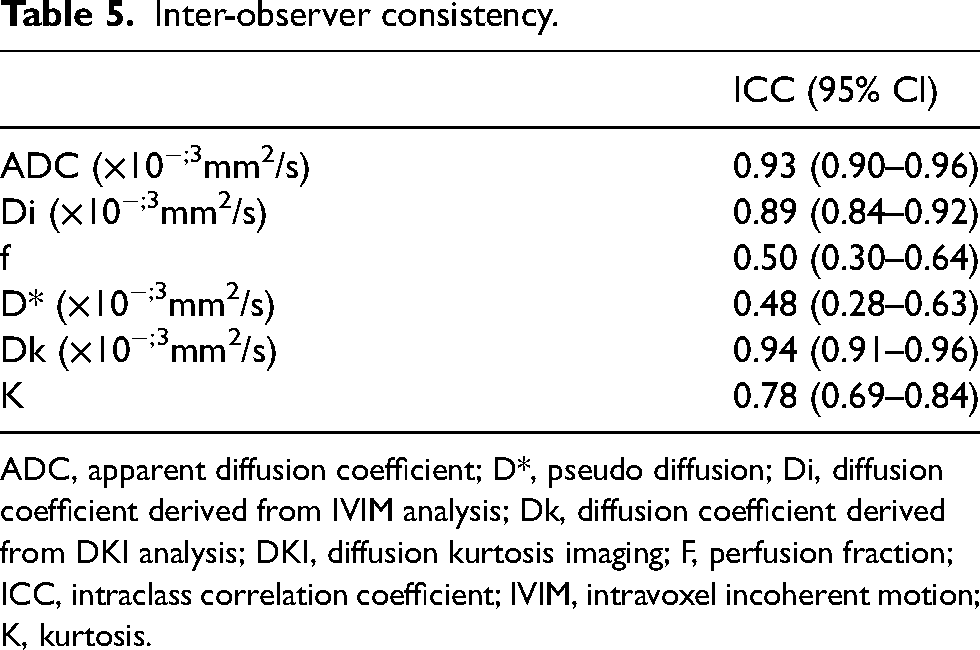
ADC, apparent diffusion coefficient; D*, pseudo diffusion; Di, diffusion coefficient derived from IVIM analysis; Dk, diffusion coefficient derived from DKI analysis; DKI, diffusion kurtosis imaging; F, perfusion fraction; ICC, intraclass correlation coefficient; IVIM, intravoxel incoherent motion; K, kurtosis.
Discussion
The G1 tumor group exhibited significantly higher Di and Dk values, and lower K values than the non-G1 tumor group. Similarly, tumors without MI demonstrated higher ADC, Di, and Dk values than those with MI. In terms of fertility preservation, the eligible group showed significantly higher ADC, Di, and Dk values and lower K values than the non-eligible group.
Research on IVIM in EC remains limited. Satta et al. evaluated 44 EC patients and found that ADC was significantly higher in endometrioid histology, low-grade tumors, and stage IA disease (3). D* was significantly higher in endometrioid histology, stage IA. f was significantly higher in patients without LVI, whereas Di did not show significant differences. Zhang et al. investigated 53 patients and reported that ADC and Di were significantly higher in the low-risk group, and the combination of ADC and f had the highest diagnostic performance (17). Maiuro et al. evaluated the potential utility of DKI in differentiating EC from non-tumorous lesions, reporting significantly higher K and lower Dk in EC (18). In this study, with 107 cases, we confirmed higher ADC and Di in stage IA1 without MI, consistent with previous studies (3,17).
IVIM and DKI parameters have been shown to enhance diagnostic accuracy in various cancers, particularly in tumor grading and staging. Higher histological malignancy grades were associated with lower ADC, Di, Dk, and higher K (13,19,20). ADC, derived from DWI, includes both diffusion and perfusion-related components. In particular, very low b-values are predominantly influenced by microcirculatory perfusion. In contrast, at high b-values, the contribution of diffusion becomes more dominant, while the impact of perfusion decreases (11). Malignant tissues, including EC and uterine leiomyosarcoma, generally exhibit lower ADC compared to normal tissue (16,21). ADC maps have also demonstrated high sensitivity for assessing MI (10,11,14), reinforcing their utility in determining MI status. Di from IVIM reflects pure diffusion by separating the perfusion-related signal components. In contrast, Dk obtained from DKI is considered to reflect true molecular diffusion by accounting for non-Gaussian water movement. In our study, Di and Dk showed comparable trends, and the higher Di and Dk values observed in G1 tumors may reflect a lower cellular density. In contrast, D* represents perfusion-related diffusion due to microcirculatory blood flow, while f quantifies the fraction of signal attenuation attributed to this microcirculation (11). In this study, no significant differences in D* and f were observed between groups. Among the IVIM parameters, D* and f have shown low reproducibility (14,22). Previous studies have reported significantly lower f values in cancerous tissue compared to the normal tissue (23–25). This may be attributed to necrosis and hypoxia leading to the destruction of microvascular structures. The accuracy of f is influenced by the inclusion of low b-values, with previous reports suggesting that incorporating these values improves the precision of perfusion information (11). Discrepancies in f-value findings may also be influenced by ROI placement, particularly whether it is located centrally or peripherally within the tumor. In addition, D* has been reported to have low reproducibility (26), which may contribute to variability in study outcomes. K reflects tissue heterogeneity and tends to increase with malignancy, hemorrhage, or necrosis, with higher values reported in high-grade tumors (20,27,28). Maiuro et al. reported that both the K and diffusion clusterization are sensitive to differences in microstructural organization between EC and healthy tissue, suggesting their potential value for the diagnosis and prognosis of EC (18). In other tumors, K values have been shown to be useful in predicting treatment response, suggesting potential utility in therapy monitoring (29–32). In our study, no significant difference in K values between non-aggressive and aggressive histological subtypes was observed. One possible explanation is that the majority of cases in this study were G1 tumors, with a relatively small number of aggressive histological type cases. No significant differences were observed in LVI status or pelvic lymph node metastasis, likely due to the small number of positive cases. Further investigations including larger sample sizes are needed to validate these findings.
Our findings support the potential clinical utility of IVIM and DKI-derived parameters as non-invasive imaging biomarkers for preoperative risk stratification and treatment planning in EC. In particular, they may help identify patients eligible for fertility-preserving treatment without the need for invasive procedures. Future prospective, multicenter studies with standardized imaging protocols and larger sample sizes, especially including more aggressive histological subtypes, are needed to confirm these results and evaluate their applicability across different MRI systems and clinical settings. Furthermore, longitudinal studies assessing treatment response and outcomes based on these imaging parameters could pave the way for their integration into routine clinical decision-making.
The present study has some limitations. First, in some advanced-stage cases, only biopsy was performed, and surgical specimens were unavailable. Second, while most cases were EC, the number of CCC and SC cases was relatively small, limiting statistical comparisons. Third, there were relatively few cases of lymph node metastasis and LVI, with 11 cases (10%) and 19 cases (18%), respectively, which may have introduced a distribution bias. Fourth, all evaluations were performed using a single 3-T MRI scanner, which may limit generalizability to other MRI systems. Fifth, the interval between MRI and surgery was relatively long (median = 31 days), which could have influenced imaging findings. Sixth, the six b-values used for IVIM analysis were 0, 50, 100, 1000, 1500, and 2000 s/mm2. We acknowledge that this relatively limited sampling at low b-values may affect the precision of perfusion-related parameters (D* and f). Therefore, these parameters should be interpreted with caution. Finally, ROI analysis was performed visually, and in cases with small lesions, the ROI settings may have impacted the results. However, the proposed measurement method remains straightforward and practical, making it applicable in clinical settings.
In conclusion, ADC, Di, and Dk were significantly higher in stage 1A1 EC. In addition, K was significantly lower in both G1 tumors and stage 1A1 EC. These findings suggest that IVIM and DKI parameters are useful for assessing tumor grade and MI, ultimately aiding in determining eligibility for fertility-preserving therapies.
Footnotes
Declaration of conflicting interests
The authors declared no potential conflicts of interest with respect to the research, authorship, and/or publication of this article.
Funding
The authors received no financial support for the research, authorship, and/or publication of this article.
