
Abstract
The biomechanical study helps us to understand the mechanics of the human cervical spine. A three dimensional Finite Element (FE) model for C3 to C6 level was developed using computed tomography (CT) scan data to study the mechanical behaviour of the cervical spine. A moment of 1 Nm was applied at the top of C3 vertebral end plate and all degrees of freedom of bottom end plate of C6 were constrained. The physiological motion of the cervical spine was validated using published experimental and FE analysis results. The von Mises stress distribution across the intervertebral disc was calculated along with range of motion. It was observed that the predicted results of functional spine units using FE analysis replicate the real behaviour of the cervical spine.
Keywords
Introduction
The cervical spine is a complex structure in the anatomy of the human body. The intervertebral disc (IVD) consists of two main components: annulus fibrosus (AF) and nucleus pulposus (NP). The AF forms the outer part, it withstands large and complex loads. The AF is the major load-bearing component of the IVD.1,2 The main function of NP is to dissipate the compressive load and acts like a shock absorber. 3 A healthy disc is responsible for the flexibility and mobility of every individual spinal segment. 4 The higher level of risk factor of the neck pain is the person becoming disabled.5–7 The mechanical principles and the mechanics involved in the structure help the physicians to understand and plan the treatment strategies.8–10 In vitro model, in vivo model and mathematical models such as finite element (FE) models are used to interpret the underlying mechanism of the cervical spine. 11 To study the underlying biomechanics, in vitro model has two existing techniques namely, animal cadaver testing and human cadaver testing.12–14 The major drawbacks commonly observed in the study of human cervical spine are demographics based, anatomical based, structural based and physical properties variability. The in vivo study helps us to understand the kinematics and the muscle forces generated in the cervical spine.15,16 The range of cervical disc degeneration analysed during dynamic neck motion as in Yu et al. 17 could be used for understanding the cervical spine disc degeneration mechanics. An anatomically accurate FE model of the human cervical spine offers a better understanding in biomechanics and it needs to be validated with the experimental studies.18–21 Also, the FE models helps to find the intervertebral disc mechanics, injury mechanism and contributes in the diagnosis of cervical spine problems and treatment methodologies.22–25
The objective of this study is to predict the intervertebral stress values across C3–C4, C4–C5 and C5–C6 level for the flexion, extension, lateral bending right, axial rotation right using FEA.
Materials and methods
To create a three dimensional (3D) FE model26,27 of cervical spine computed tomography (CT) scan of 35-year healthy male subject was used (Figure 1) The geometric data (66 slices, 0.5 mm slice thickness) of C3–C6 level was obtained from the CT data. The CT scan images were processed in an image processing software (Mimics 10.0; Materialise Technologies, Leuven, Belgium). By using segmentation, the surface model of the vertebral levels from C3 to C6 level were obtained. The model was meshed using the commercial FE package ANSYS 18.2 (ANSYS, Inc, USA) as shown in Figure 1.
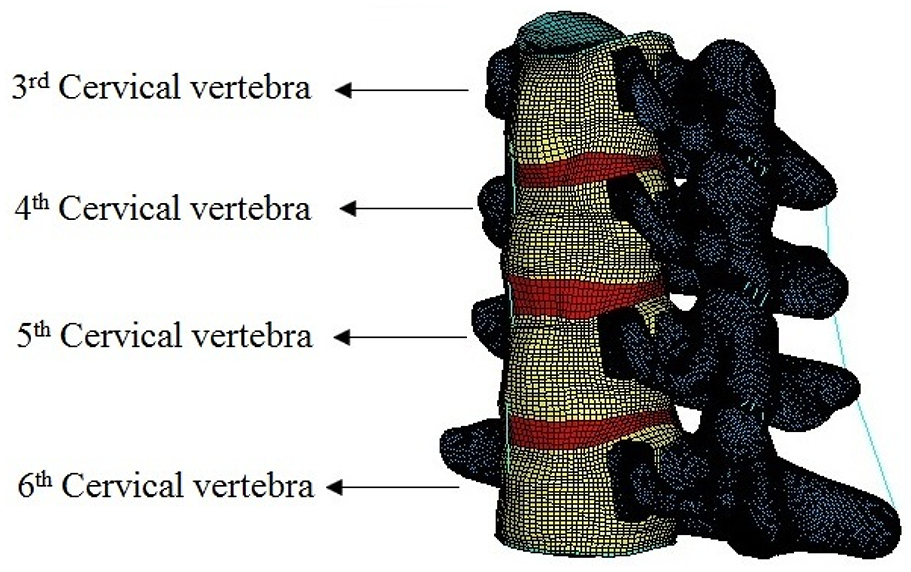
Intact FE model C3–C6.
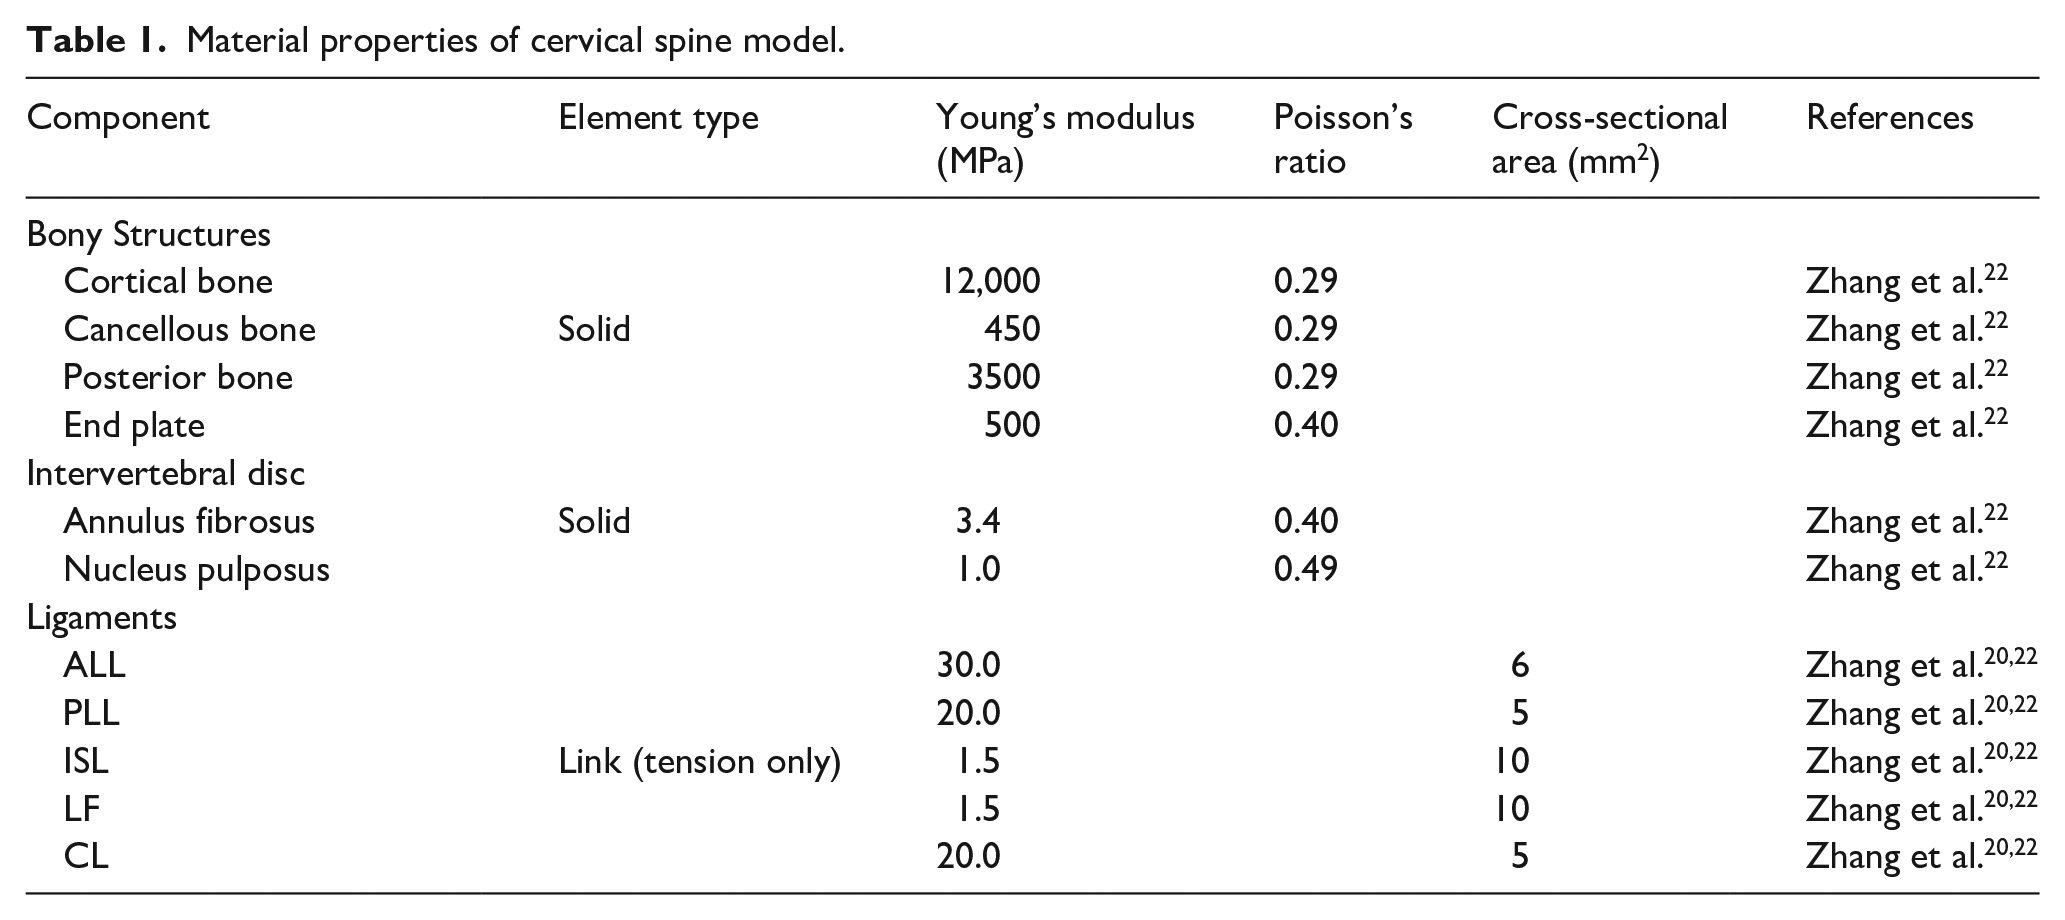
During modelling of the vertebrae, the thickness of the cortical shell was kept as 0.5 mm. 28 The anterior sides of the vertebrae were meshed using eight noded brick elements and the posterior sides of the vertebra were meshed as tetrahedral elements due to the anatomical irregularity. The element type and the material properties were assigned as listed in Table 1.
Material properties of cervical spine model.
The anterior side and the posterior size disc heights were maintained in the FE model. 29 The intervertebral discs were modelled as two separate components that is, annulus fibrosis and nucleus pulposus. The volume occupied by the annulus was around 60% and the nucleus was around 40%. 30 Endplates were modelled at the inferior and the superior sides of the vertebral bodies as 0.6 mm. 31
The major ligaments in the cervical spine that is, ALL, anterior longitudinal ligament; PLL, posterior longitudinal ligament; ISL, interspinous ligament; LF, ligamentum flavum; CL, capsular ligament were modelled using two noded link elements. 32 In this study, in order to replicate the real phenomenon of the ligament tension only link elements were considered. The material property and the cross sectional area of the ligaments were assigned as listed in Table 1.
The intervertebral disc was considered as the main load bearing area of the functional spine unit so the anterior side was meshed using hexahedral elements. The average mesh element size for FE model is 0.5 mm. Total elements of the model were 819,060 and convergence test done as per literature. 33
In the FE analysis, four loading conditions that is, flexion, extension, right lateral bending and right axial rotation were considered as shown in Figure 2. For each loading condition, 1 Nm moment was applied. 34 To create the moment, force was applied accordingly at the top surface of the C3 vertebra by creating a pilot node. All degree of freedom of bottom surface of the C6 level were completely constrained.
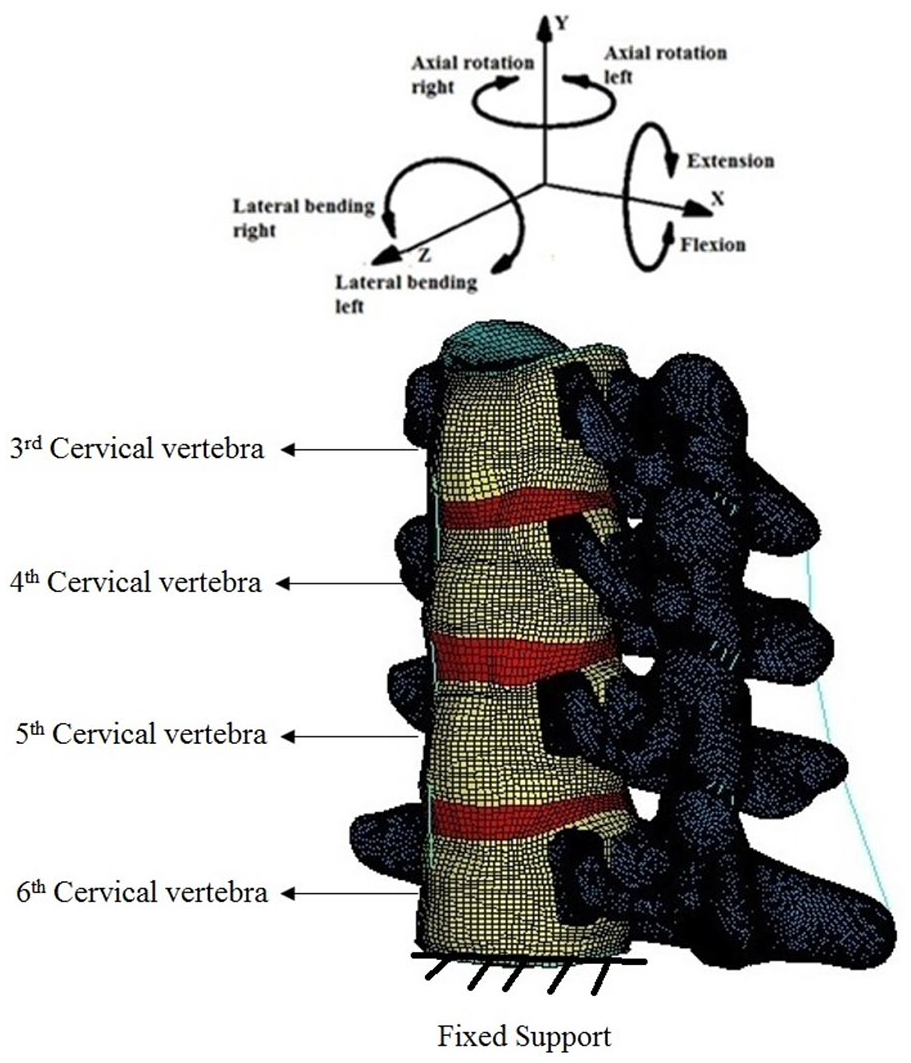
Boundary condition.
Result
Validation
The C3–C6 FE model was analysed under static loading condition and the predicted ROM were compared with the results from the experimental studies21,23,36–39 and finite element analysis.21,35,40 The physiological motions were validated with the experimental studies, based on this validation the von Mises stress distribution across the intervertebral discs were calculated.
Range of motion and the maximum von Mises stress
In the flexion condition, analysis was conducted for 1 Nm and the intersegmental motion across C3–C6 were calculated. During flexion, the ROM observed in C3–C4, C4–C5 and C5–C6 levels were 5.84°, 4.2° and 5.19° respectively. In extension, ROM found in C3–C4, C4–C5 and C5–C6 levels were 4.13°, 2.5° and 4.3° respectively. In lateral bending, the ROM observed in C3–C4, C4–C5 and C5–C6 levels were 3.1°, 3.4° and 2.8° respectively. In axial rotation, the ROM observed in C3–C4, C4–C5 and C5–C6 levels were 2.6°, 3.03° and 2.9° respectively.
The maximum von Mises stress was calculated for the C3–C4, C4–C5 and C5–C6 level discs. The von Mises stress distribution in the disc are shown in Figure 3. During flexion, the maximum von Mises stress across the C3–C4 disc was calculated as 0.57 MPa, in C4–C5 disc it was 0.51 MPa and in C5–C6 disc it was 0.51 MPa. During extension, the maximum stress observed in C3–C4, C4–C5 and C5–C6 discs were 0.57 MPa, 0.45 MPa and 0.51 MPa respectively. In comparison with the published results 34 the flexion exhibits more intervertebral disc stress in comparison with the extension. In lower flexion, the load carrying proportion of the disc is high. In case of higher flexion, the ligaments will play a major role. 19 While in extension, the facets play a major role, 19 thus the disc stress was less in extension compared to flexion. In case of lateral bending, the maximum stress found in the discs were 0.97 MPa in C3–C4, 0.47 MPa in C4–C5, and 0.65 MPa in C5–C6. Under axial rotation, observed maximum stresses were 2.04 MPa, 1.9 MPa and 1.6 MPa in C3–C4, C4–C5 and C5–C6 discs respectively. In lateral bending and axial rotation, the disc is the major load bearing area so the intervertebral disc stresses will be more in axial rotation than lateral bending.
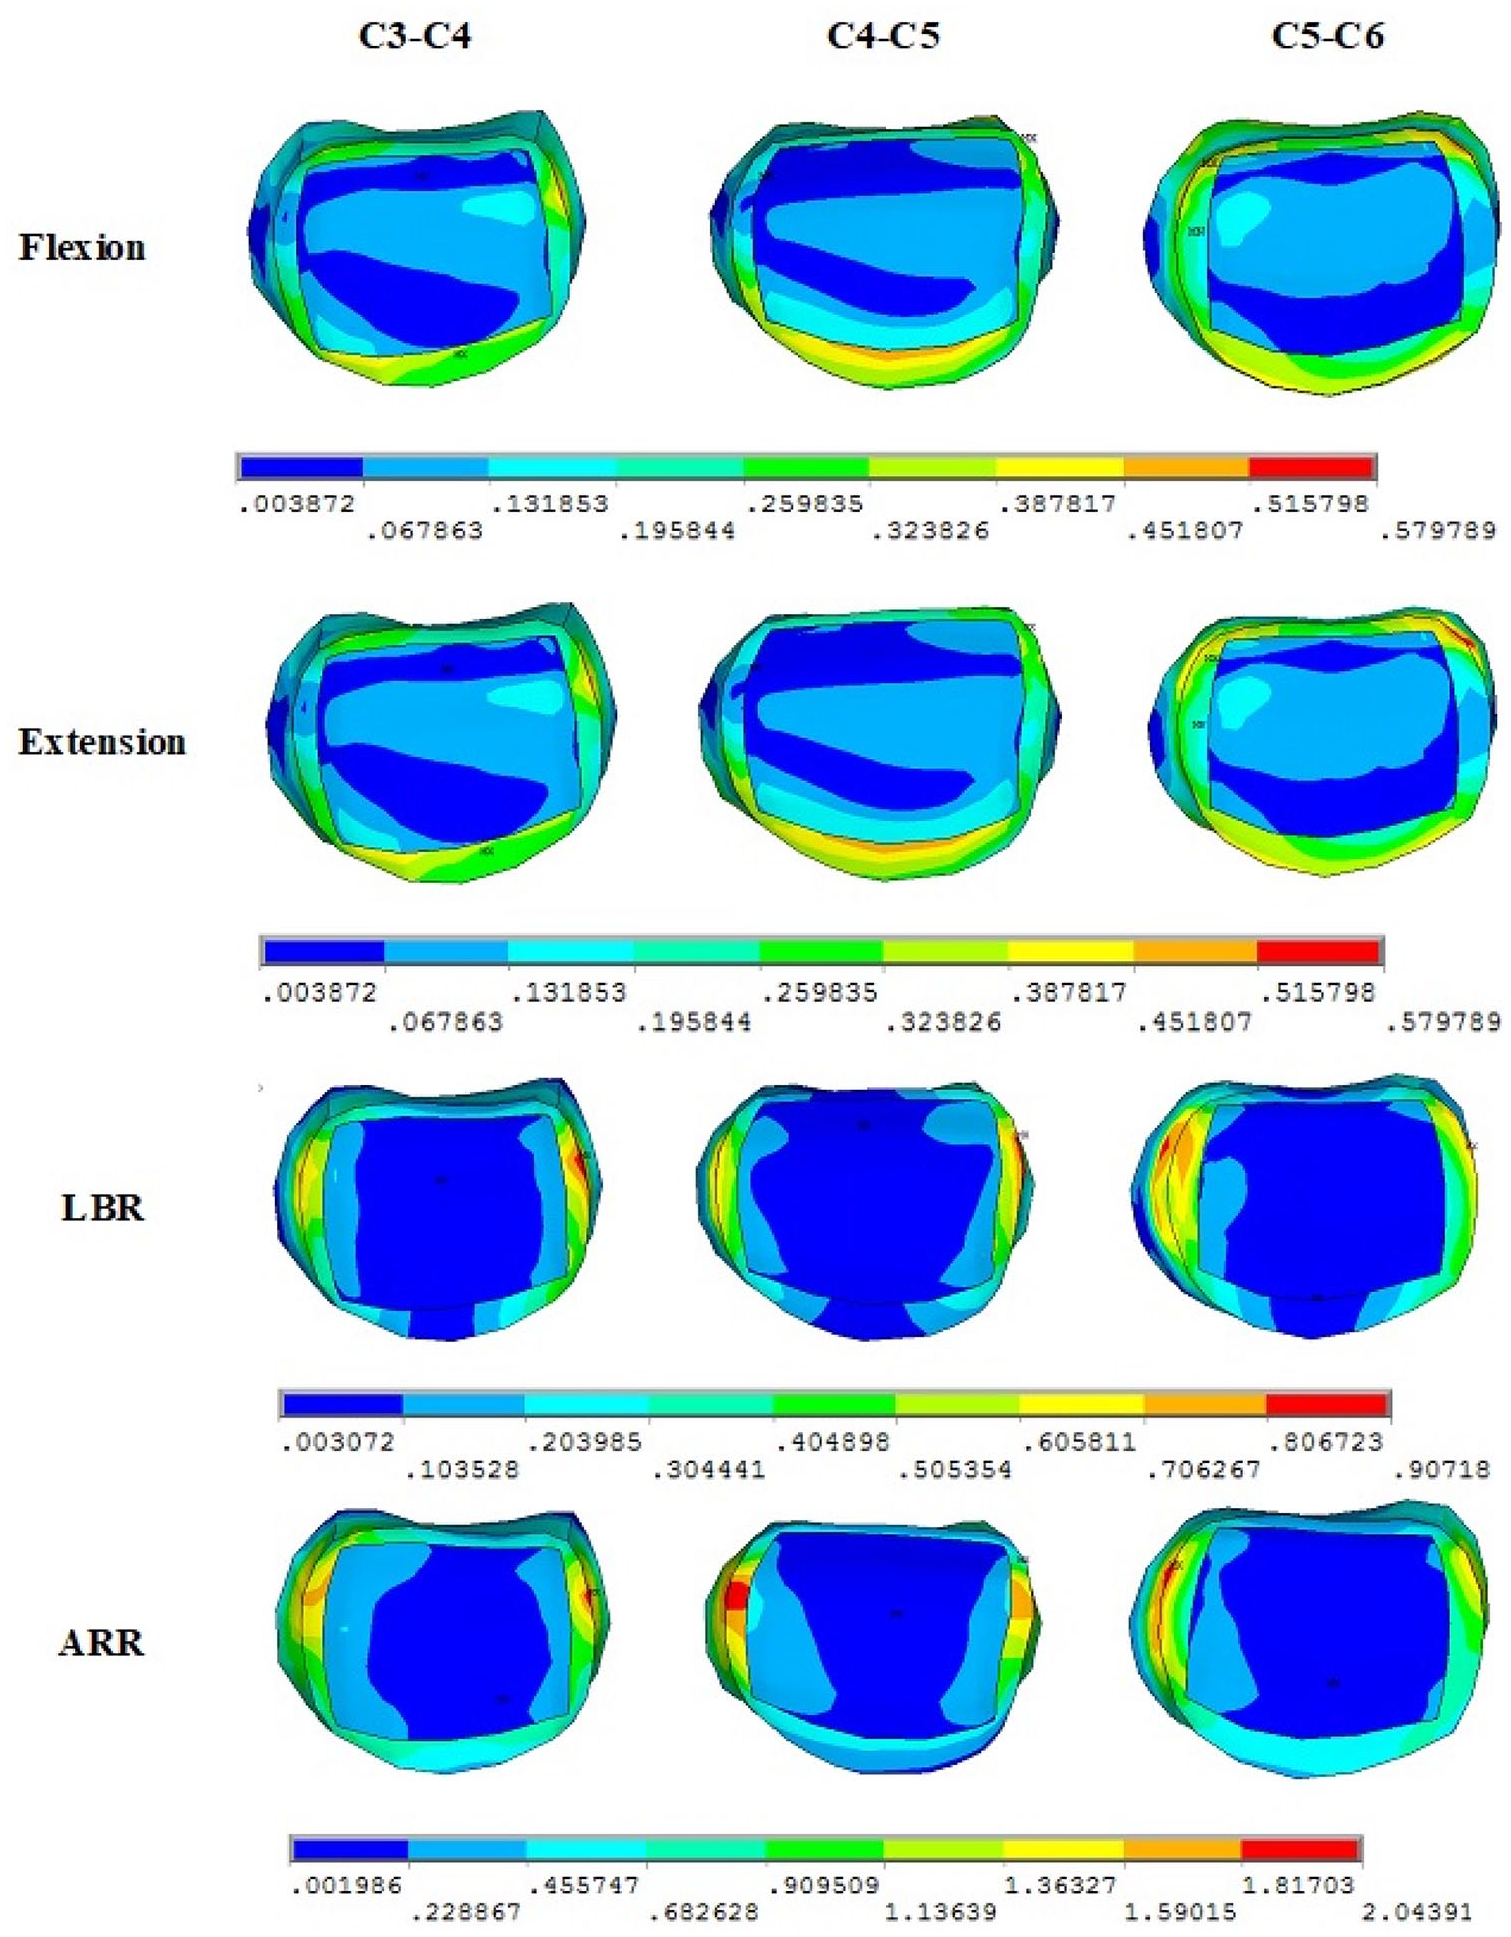
Summary of intervertebral disc stresses for C3–C6 for various physiological motion.
Discussion
Range of motion
The three dimensional FE model was created to study the physiological motion of the cervical spine from C3 to C6 level. The main advantage of this FE study is we compared our FE model with both in vitro and in silico study. In our study we used percentage to signify the range of motion when compared with the in silico studies the higher value indicates it is flexible and the lower value indicates it is stiffer. In addition to it, we verified our FE study range of motion with minimum value and maximum value of the in vitro studies.23,36–39
In flexion as shown in the Figure 4(a) while we are comparing with the Cai et al. 35 our FE model behaves 12% higher and flexible in the C3–C4 level. In the C4–C5 level we found it is 5% less and a stiffer behaviour is seen. In the C5–C6 level we found it is 15% higher than Cai et al. 35 and a flexible behaviour is seen. In comparison with in vitro study Wheeldon et al. 37 in the C4–C5 level of our FE model exhibits stiffer values. In the flexion in vitro studies the motion of the C3–C4 level it is varying from 1.4° to 10.07 ° in C4–C5 level it varies from 2.29° to 8.54° and in C5–C6 level it is around 2.46° to 9.89°. In comparison with the published in vitro studies23,36,37 our FE model behaves within the limits in all the segments.
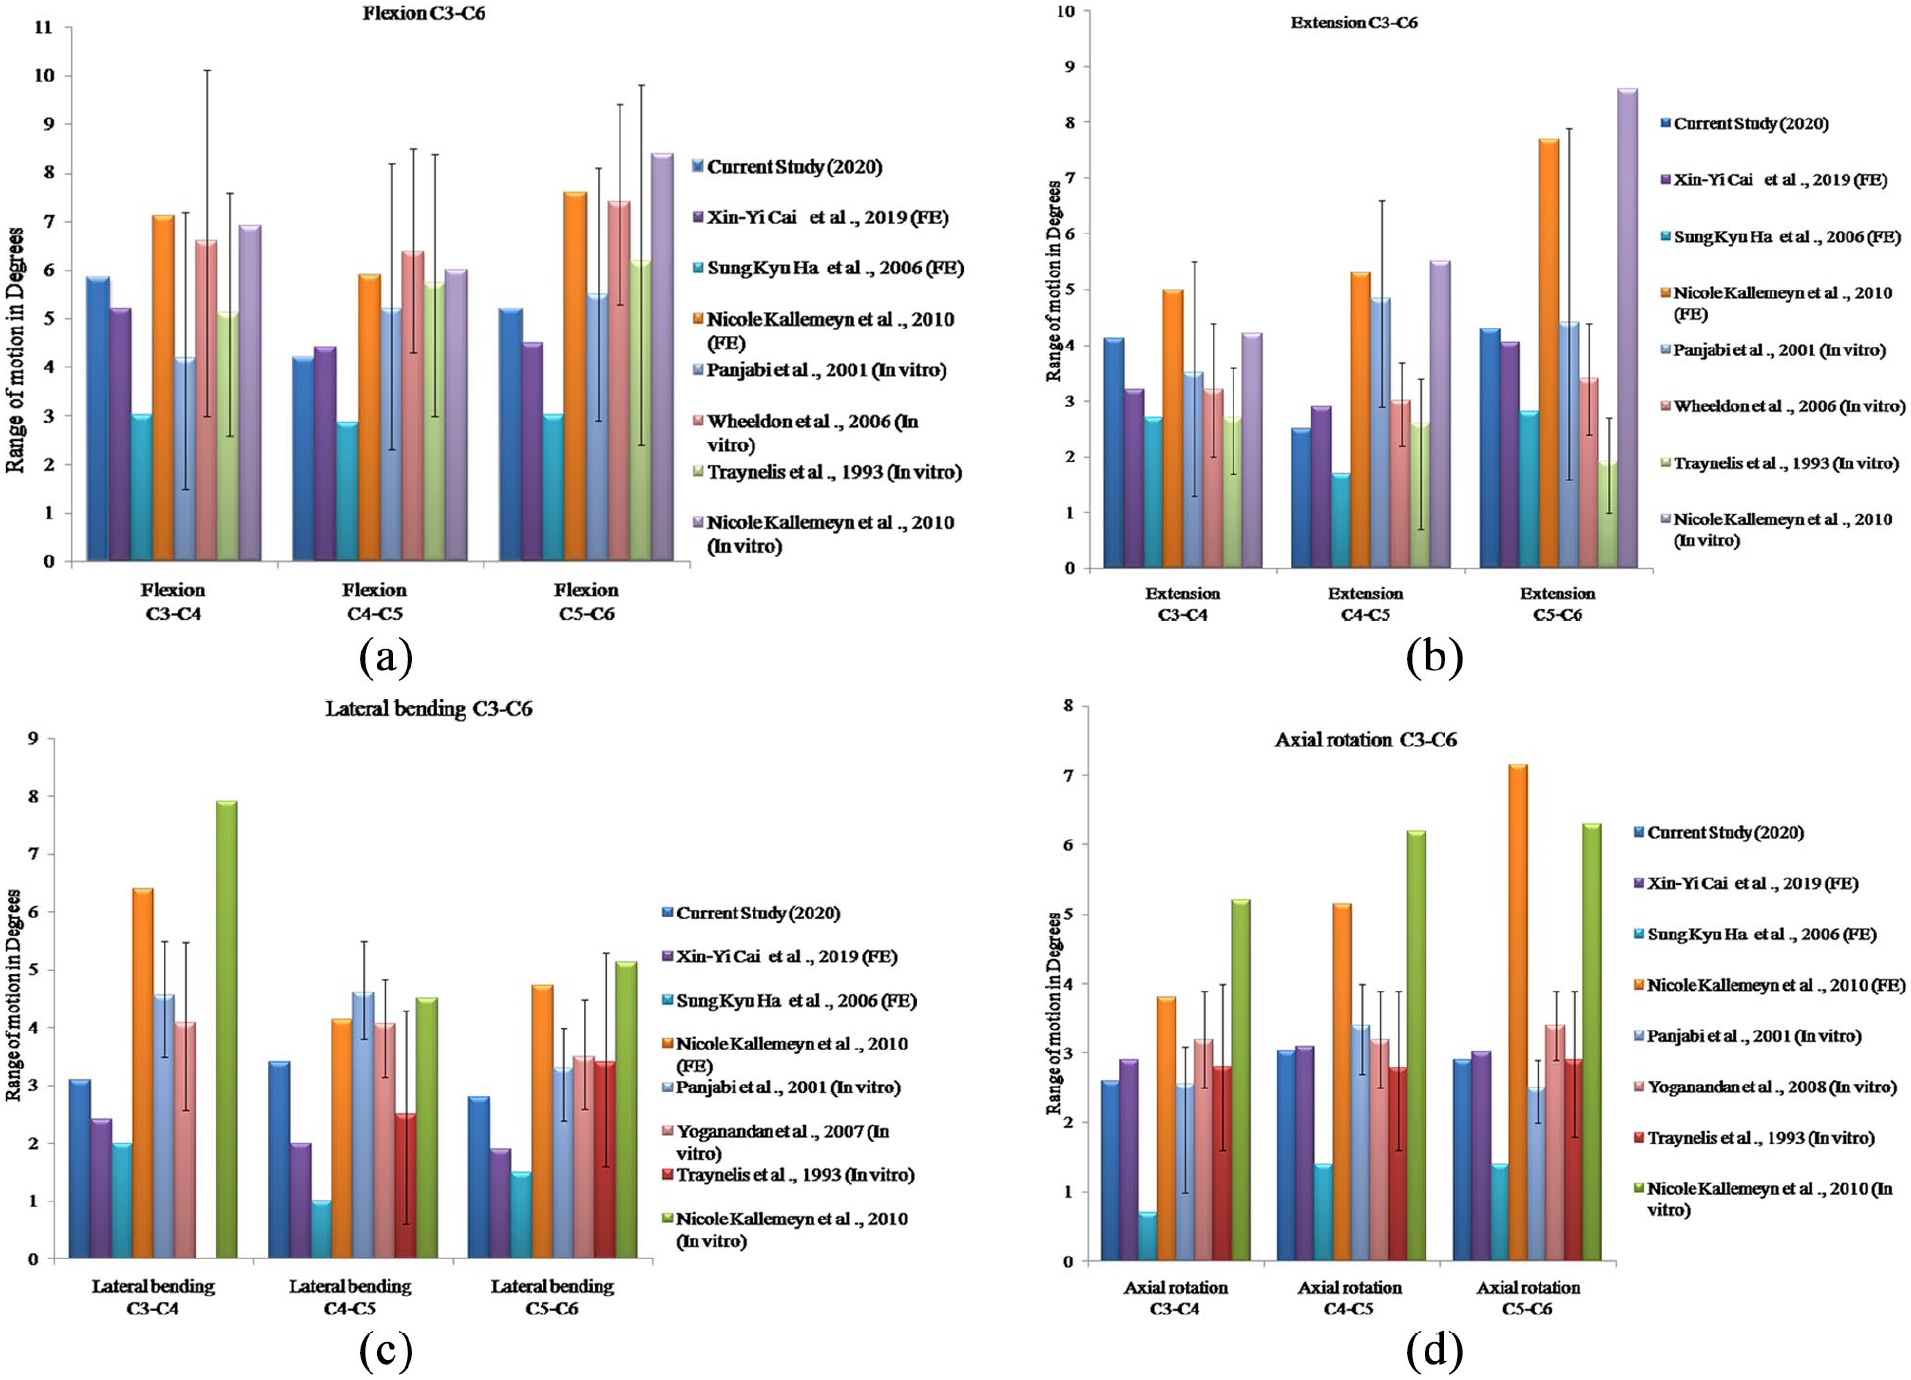
ROM predicted by intact FE model compared with experimental and FE studies (a) Flexion (b) Extension (c) Lateral bending (d) Axial rotation.
In the extension as shown in the Figure 4(b) the C3–C4 level in comparison with the Cai et al. 35 we found it is 29% higher and the FE model is flexible. With the C4–C5 level we found it is 14% less and stiffer and in the C5–C6 level it’s seen that its 6% higher than the published in silico studies. 35 In comparison with the in vitro studies it is observed that a good agreement is seen in the C3–C4 with23,37 but it is flexible in comparison with Traynelis et al. 36 In the C4–C5 level it is stiffer in comparison with Panjabi et al. 23 and is within the limits with the published in vitro study.36,37 In the C5–C6 level the values are within the limits as in Panjabi et al. 23 and Wheeldon et al. 37 and a flexibility is seen in comparison with Traynelis et al. 36 In the extension in vitro studies the motion of the C3–C4 level is varying from 1.32° to 5.5° in the C4–C5 level it varies from 0.75° to 6.71°and from C5–C6 level it is around 1.07° to 7.21° while comparing with in vitro studies23,36,37 all the segments were within the limits.
In the lateral bending as shown in the Figure 4(c) in comparison with the in silico study Cai et al. 35 we found in the C3–C4 it is 28% in C4–C5 it is 70% and in C5–C6 it is 47% higher. In this case our FE model exhibits flexibility. With in vitro study we found in the C3–C4 level it is stiffer 23 while with Yoganandan et al. 38 it is within the limits. In the C4–C5 level it is stiffer compared with Panjabi et al. 23 whereas made a good agreement with Traynelis et al. 36 and Yoganandan et al. 38 In the C5–C6 level a good agreement is seen with all the in vitro studies.23,36,38 In the lateral bending in vitro studies23,36,38 in the C3–C4 level we found the value of bending is around 2.75° to 6.35° in the C4–C5 level it is around 0.6° to5.5° in the C5–C6 level we found it is around 1.6° to 5.28° our FE model value were within the limits.
In the axial rotation as shown in the Figure 4(d) in comparison with the Cai et al. 35 we found in all the levels our FE model exhibits a stiffer behaviour. In the C3–C4 level it is 12% lesser and in C4–C5 it 2% less and in the C5–C6 it is 4% less values were seen. In the axial rotation in all the segment we found a good agreement with the published in vitro studies.23,36,39 In the axial rotation in C3–C4 level the value of the rotation is around 1.5° to 4.0° in the C4–C5 level it is around 1.60° to 3.92° and in the C5–C6 level it is around 1.85° to 3.96°. We found the FE model rotation value were within the limits. With Ha et al. 40 we found our FE model is flexible in all the physiological motion. This may be due the bone quality, material property assigned and they applied a preload with moment whereas we applied only pure moments. This may be the reason that our model is flexible. Our FE model in comparison with Kallemeyn et al. 21 both in vitro and in silico study our FE model exhibits stiffer behaviour in all the physiological motion. This behaviour may be due to the reason they calibrated their FE model with the experimental results.
Stress distribution in the intervertebral disc
In flexion loading as shown in Figure 5(a), von Mises stress was studied for all the intervertebral disc from C3 to C6 levels, which exhibited a lower range when compared with the simulation results from the literature. 34 The C3–C4 level disc exhibited a lower stress compared to the simulation values. The von Mises stress in the disc summary for flexion is given in Figure 3.
In extension loading as shown in Figure 5(b), stress observed on all the segments from C3 to C6 levels were similar to the finite element results of Zafarparandeh et al. 34 In the C3–C4 level, the stress across the disc exhibited good agreement with the simulation values, in C4–C5 and C5–C6 levels similar trend was seen.
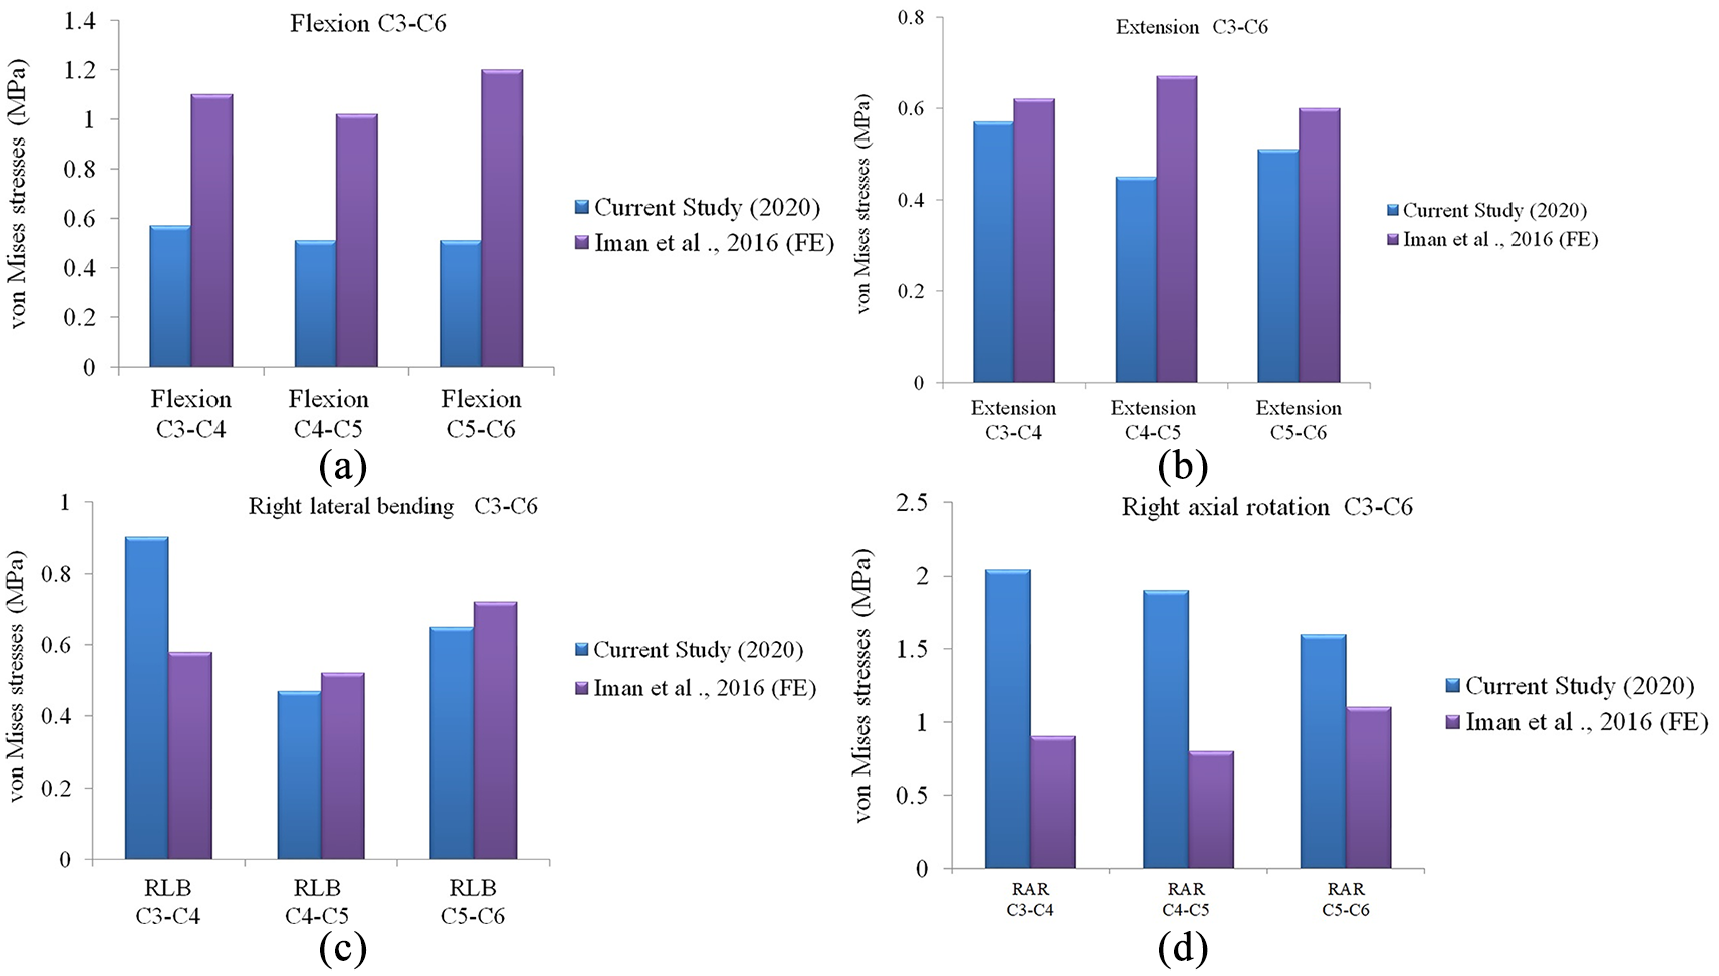
Comparison of intervertebral disc stresses for flexion of C3–C6 a) Flexion (b) Extension (c) Right Lateral bending (d) Right Axial rotation.
Disc stress in right lateral bending is shown in Figure 5(c). In the C3–C4 level, the stress across the disc exhibited a higher stress value compared to the published simulation value. 34 In the C4–C5 and C5–C6 level discs, the FE analysis exhibited a good agreement and a similar trend was seen with the simulation results.
As shown in Figure 5(d) for right axial rotation, disc stress calculated in C3–C4 level was 2.04 MPa, was higher than the simulation results. 34 The maximum disc stress values across C4–C5 level was calculated as 1.9 MPa, was quite higher than the simulation values. In the C5–C6 level, the disc stress exhibited good agreement with the simulation. 34 The differences in results with the previously published articles have caused mainly due to the different combination of mechanical properties used in the articles.
Conclusion
In flexion and extension loading from FE studies, it was observed that the C3–C4 level and C5–C6 level exhibit more range of motion in comparison with C4–C5 level. In the lateral bending, all the level from C3 to C6 contribute the same physiological motion by FE studies. In the axial rotation, the range of motion from C3 to C6 levels were observed and it was found that the C4–C5 level is little higher in comparison with the C3–C4 level. In summary, this study presents a validated subject-specific FE Model which ma help clinician in decision making, surgery planning and better treatment for patients.
Footnotes
Declaration of conflicting interests
The author(s) declared no potential conflicts of interest with respect to the research, authorship, and/or publication of this article.
Funding
The author(s) received no financial support for the research, authorship, and/or publication of this article.