
Abstract
Thromboembolic complications still arise on blood contacting surfaces. Surface charge and topography influence the subsequent deposition of proteins and platelets, potentially leading to thrombi. Research showed a correlation of surface charge and nanoscale roughness, and a negative surface charge as well as a smooth surface finish are associated with lower thrombogenicity. The aim of this study was to compare the platelet adhesion on titanium with different nanoscale roughnesses and to examine if those roughness variations caused a change in surface charge. Titanium samples were polished and roughened to four different nanoscale roughness levels. Platelet adhesion (covered surface area (CSA), N = 8) was tested in flow chambers with human whole blood using fluorescence imaging. ζ-potential was measured over a broad range of pH-values and interpolated to obtain the ζ-potential for pHBlood (7.4). Platelet adhesion tests were evaluated in terms of p-values and the Wilcoxon test effect size and the trend of the ζ-potential at pHBlood and the CSA was compared. Ra-values ranged between 35 (polished) and 156 nm. Regarding platelet adhesion, the polished sample showed the lowest mean CSA with a medium or strong effect size compared to the roughened samples. The interpolated ζ-potentials for pHBlood follow a similar trend as the CSA, with the lowest ζ-potential measured for the polished surface. These findings suggest that the decreasing ζ-potential due to lower nanoscale roughness might be an additional explanation for the improved hemocompatibility besides the smoother topography.
Keywords
Introduction
Titanium alloys are commonly used as blood contacting materials of medical implants, for example in ventricular assist devices (VADs), due to excellent biocompatibility. 1 Nevertheless, the extent of thrombi formation, which occurs through the subsequent deposition of plasma proteins followed by platelets, remains difficult to predict. 2 Surface characteristics, including charge and topography, are known to influence the formation of thrombi.
The topography is dependent on the manufacturing and surface finishing processes and can be quantified by measuring the surface roughness. A higher surface roughness leads to a higher specific surface area and therefore may increase the extent of adhesion and it exhibits structures that protrude into the blood flow and therefore may mechanically trap proteins and platelets. 3 Various investigations focused on the geometric influence of the surface roughness on thrombogenicity.3 –5 The results show a tendency toward lower platelet adhesion for smoother surfaces.
Also the influence of surface charge at the interface between blood and biomaterial on the thrombogenicity is already described in literature to some extent.6,7 This interface can be described by the electrochemical double layer (EDL) theory, which suggests a continuous electric potential curve from the solid material to the bulk liquid. On this potential curve, the so-called ζ-potential marks the boundary between mobile charges of the fluid and immobilized charges bound to the solid material. Depending on the pH value of the liquid, the ζ-potential can vary from negative to positive values, resulting in material specific ζ-potential vs. pH curves. Protein adsorption and orientation is strongly influenced by the material’s surface charge and therefore an important indicator for the material’s biocompatibility. In general, negative surface charges of biomaterials are associated with a good hemocompatibility. 8
Borghi et al. 9 discovered that nanoscale changes in roughness can influence the charge of TiO2 surfaces. They explained this by a roughness-induced self-overlap of the EDL. This change in surface charge was not following a monotonous trend for rising roughness.
Ferraris et al. compared different chemically treated titanium surfaces with respect to the change in ζ-potential. They found that mirror-finished surfaces exhibited more negative ζ-potentials in the relevant pH range compared to the chemically roughened surfaces. However, they did not quantify the roughness values and set them in relation to platelet adhesion. 6
Altogether, these studies separately investigated the relationship between roughness and either platelet adhesion or surface charge. Since the roughnesses of those studies are not in comparable ranges, it cannot be concluded that the roughened surfaces used for platelet adhesion experiments would also show a change in surface charge reported by Borghi et al. Therefore, we compared different nanoscale roughness levels in terms of platelet adhesion. Further, we investigated if this change of nanoscale roughness leads to a change in the ζ-potential, in order to consider this as an additional factor for platelet adhesion despite topology. For platelet adhesion quantification, we prepared titanium samples with different roughness values and used fluorescence imaging to quantify platelet adhesion of human whole blood in flow chambers. For surface charge characterization, we used the streaming potential method.
Methods
Preparation of titanium sample surfaces
An overview of the mechanical surface preparation process of the titanium samples (Ti6Al4V, grade 5) are shown in Figure 1. All samples were polished (LaboPol2 and LaboForce1, Struers GmbH, Willich, Germany) at 500 rpm according to an established protocol, creating mirror-finished surfaces. The samples were fixed to a custom-made sample holder and pressed to an abrasive paper or polishing cloth, depending on the polishing step. When using the abrasive paper (grit sizes P150, P1000 and P2500 from Schmitz-Metallographie GmbH, Herzogenrath, Germany), water was added, and when using the polishing cloth, an additional oxide polishing suspension containing Si particles with a size of 0.25 or 0.05 µm (Schmitz-Metallographie GmbH, Herzogenrath, Germany) was added. Between each step, the samples were cleaned in an ultrasonic bath with ultrapure water and cleaning solution (Sonoswiss Cleaner T4).
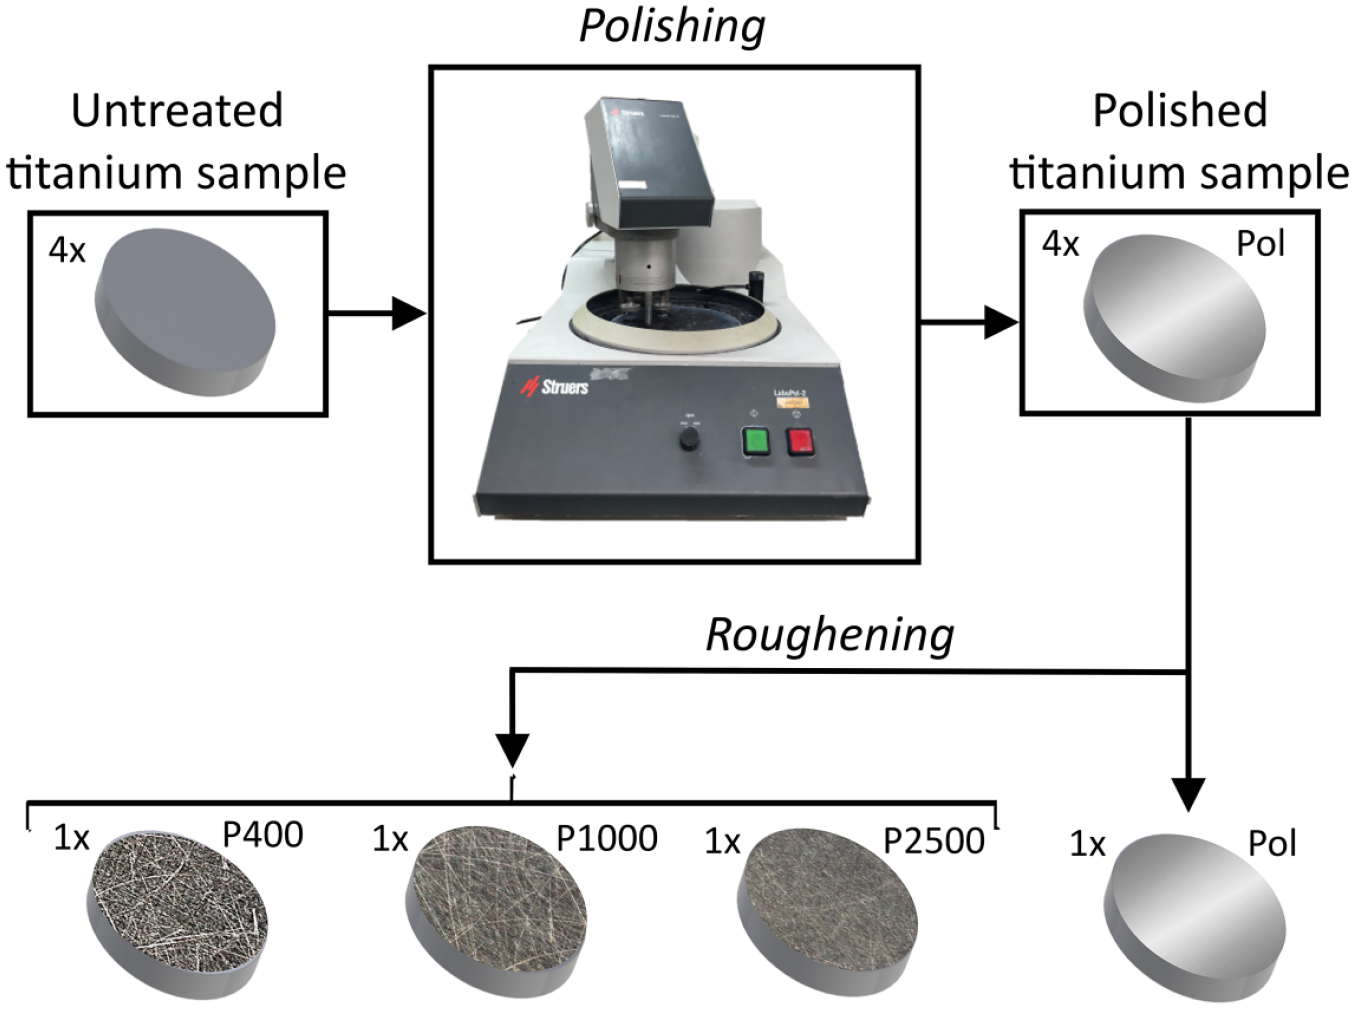
Overview of the mechanical surface preparation process of the titanium samples with the LaboPol2/LaboForce1 machine. Three out of four polished titanium samples are roughened with the respective abrasive paper (P400, P1000, and P2500) to obtain different nanoscale roughness levels. The process was conducted five times to produce all samples.
In order to compare four different levels of roughness, three out of four titanium samples with a mirror-finished surface were roughened with the respective abrasive paper. The process was repeated five times to produce all samples. For reuse, biological residues were removed from the surfaces in an ultrasonic bath with ultrapure water and neodisher MediClean forte (Chemische Fabrik Dr. Weigert GmbH & Co. KG, Hamburg, Germany) after each platelet adhesion test.
Surface roughness measurements
Roughness measurements were conducted with the MarSurf PS 10 (Mahr GmbH). For each sample, five measurements were taken. Arithmetic mean roughness values Ra were measured. Ra is the mathematical average of all deviations of the roughness profile from the center line along the reference section. The samples were analyzed after the blood experiments or after the ζ-potential measurements to avoid artefacts due to scratches caused by the tactile measurement.
Human whole blood collection and fluorescent staining of the platelets
A total of eight human whole blood samples (40 ml each) from healthy adult male and female volunteers were obtained by venipuncture. Blood samples were obtained into 3.2% sodium citrate blood collection tubes (S-Monovette, Citrat 9NC, 10 ml, Sarstedt, Nümbrecht, Germany) and used directly. A solution of 0.5 μg fluorescent dye (mepacrine/quinacrine dihydrochloride, Sigma-Aldrich Chemie GmbH, Taufkirchen, Germany) per 1 ml phosphate buffered saline solution (DPBS) (Dulbecco’s Phosphate Buffered Saline (1×), Life Technologies, Carlsbad, USA) was prepared. The blood samples were incubated with this mixture (ratio 10:1) 30 min before starting the experiments.
Experimental setup and flow chamber
The experimental setup is shown in Figure 2. It consists of a syringe pump (PHD ULTRA, Item 70-3007, Harvard Apparatus, Massachusetts, U.S.), tubing, flow chambers and syringe reservoirs (Figure 2(a)). Each sample was mounted into a flow chamber, which consists of a stainless-steel lid with cannula tubes as inlet and outlet, a stainless-steel plate with 200 µm thickness which includes the flow channel and a 3D-printed bottom part which contains the titanium sample (Figure 2(b) and (c)).
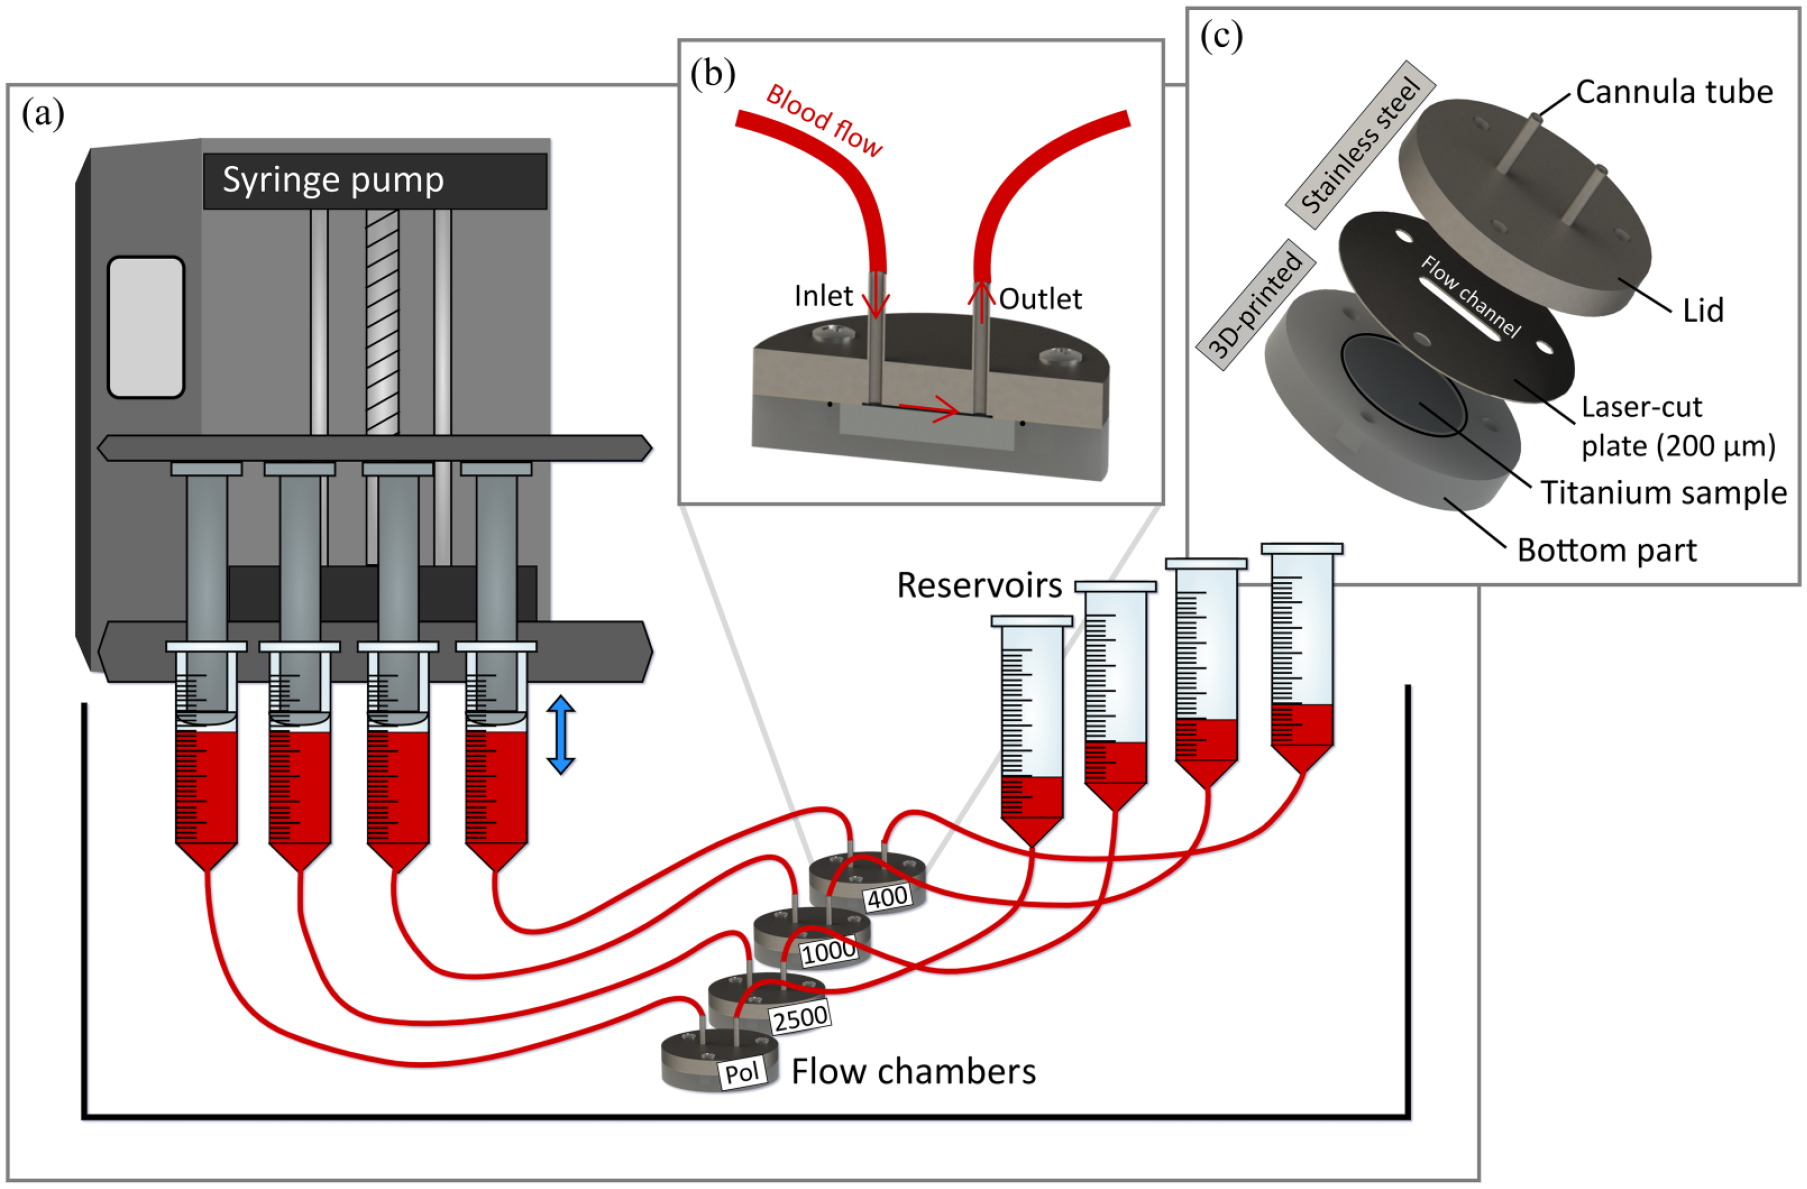
(a) Complete experimental setup including the syringe pump which infuses and withdraws the blood, four flow chambers including titanium samples, tubing, and blood reservoirs, (b) sectional view of the flow chamber including the blood flow, and (c) explosion view of the flow chamber including the lid, the stainless-steel plate with the flow channel and a thickness of 200 µm and the titanium sample.
Each experiment was conducted with the four titanium samples of the four different roughness levels and blood from the same donor. Before starting the experiments, the whole system was flushed with DPBS and emptied afterwards. After three cycles of infusing and withdrawing blood-mepacrine-mixture in the flow chamber at 65 ml/h for 20 min, it was displaced by flushing the system again with DPBS at a rate of 30 ml/h. The experiments were conducted at room temperature in the laminar flow regime (Re ≈ 3.22), further flow properties were in accordance to Esslinger et al. 10
The study was approved as a part of the vote of the ethics committee of the Charité—Universitätsmedizin Berlin (EA4/011/22).
Microscopic imaging
After each experiment, adhered platelets were visualized via inverted fluorescence microscopy (Axio Observer Z1, Carl Zeiss AG, Oberkochen, Germany) as previously described. 10 The signal of the adherent platelets, stained with mepacrine (fluorescent dye), was generated by using light with a wavelength corresponding to the excitation maximum of Mepacrine (436 nm) and a filter corresponding to the emission maximum (525 nm).
Evaluation of the fluorescence images and statistical analysis
Image analysis was implemented using the software MATLAB (The MathWorks, Inc., Natick, USA, version R2021a). Thereby, an identical image section of each sample that was overflowed with blood was selected and converted to a binary image to provide the information about the percentage of the covered surface area (CSA).
Statistical evaluation was performed using the software SPSS (IBM Deutschland GmbH, Ehningen, Germany). Due to the small sample size, the Wilcoxon test for paired data was applied. p-Values smaller than 0.05 were considered as significant. The Wilcoxon test effect size was calculated to reflect the extent of the difference between the groups. Effect sizes between 0.1 and 0.3 were considered weak, between 0.3 and 0.5 were considered medium, and >0.5 were considered as strong.
Zeta potential measurements
The ζ-potential measurements of the titanium surfaces were performed with the streaming potential instrument SurPASS 3 ECO (Anton Paar GmbH, Graz, Austria). Two samples with the same roughness levels were mounted into an adjustable gap cell for disks. An electrolyte solution was freshly prepared, containing 0.1488 g of potassium chloride (KCl) in 200 ml ultrapure water to generate a 1 mM KCl electrolyte solution.
Since the ζ-potential changes with the pH of the electrolyte, it is common practice to measure the ζ-potential over a broad pH spectrum for a full material characterization. To prevent possible irritations and artefacts from previously used acidic or alkaline solutions that may have caused surface reactions and therefore a change of the surface characteristics, different couples of samples were used for acidic and alkaline titrations. For this, the pH value was first adjusted by gradually moving to higher alkaline values up to approx. pH 9.5 by adding sodium hydroxide (NaOH) to the electrolyte. For acidic titration down to approx. pH 3, hydrochloric acid (HCl) was added to freshly prepared KCl electrolyte solution. For all measurements, the electrolyte solution was purged with nitrogen gas to avoid pH shifts due to dissolved CO2 gas. For each pH-value, five cycles of ζ-potential measurement were averaged. A polynomial fit of fifth order was done over the pH-spectrum to interpolate the ζ-potential at pHBlood (7.4).
Results
Surfaces roughness measurements
Surface roughness measurements of the samples for platelet adhesion experiments showed a roughness of Ra = 35 ± 5 nm (polished surface, Ra = 35) and Ra = 76 ± 12 nm (Ra = 76), Ra = 104 ± 5 nm (Ra = 104), and Ra = 150 ± nm (Ra = 150) for the roughened surface using P2500, P1000, and P400 abrasive paper, respectively. Roughness of the samples for ζ-potential measurements were Ra = 37 ± 13 nm (polished surface, Ra = 36) and Ra = 98 ± 19 nm (Ra = 98), Ra = 116 ± 23 nm (Ra = 116), and Ra = 156 ± 13 nm (Ra = 156) for the roughened surface using P2500, P1000, and P400 abrasive paper, respectively.
Microscopic imaging of the adherent platelets
The data distribution of the percentage of the CSA for each sample is shown in Figure 3 as boxplots for N = 8 experiments. Overall, the samples with the lowest surface roughness (Ra = 35) accumulate the fewest platelets. For higher roughness values, mean and median values for the CSA increase, also regarding the variation. However, no linear correlation between the Ra-values and the CSA was found.
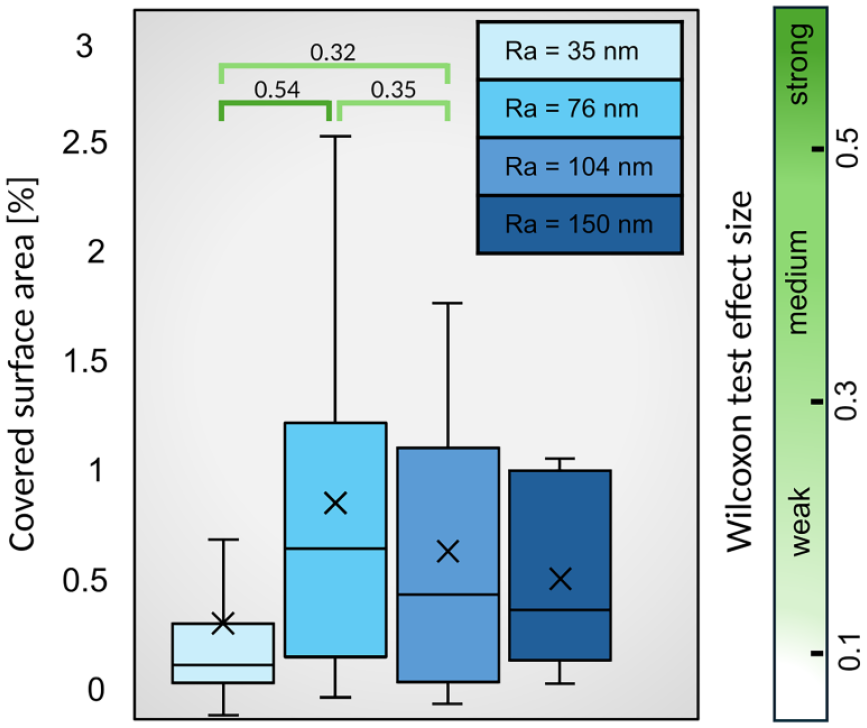
Boxplots (quartile calculation including median) of the percentage of the covered surface area for the titanium samples with different surface roughness values including the mean value (×) and the effect size for the pairwise comparison with the Wilcoxon test for N = 8 experiments.
No p-value of the pairwise comparison is <0.05. However, the effect size for the Wilcoxon test for the pairwise comparison of the samples Ra = 35 and Ra = 104 is 0.32, and for the samples Ra = 76 and 104 the effect size is 0.35, both indicating a medium effect. And for the pairwise comparison of the samples Ra = 35 and 76, the effect size amounts to 0.54, indicating a strong effect. All other effect sizes are smaller than 0.3 and therefore considered as weak to no effect.
Zeta potential measurements
All measured samples show a decrease in ζ-potential values for rising pH-values. The Ra = 37 samples show an almost linear slope, whereas all other samples are more curved. At the blood pH-value of 7.4, the polished samples Ra = 37 show the lowest ζ-potential of −53 mV. The roughened samples exhibit higher ζ-potential values ranging from −37 to −29 mV (Figure 4).
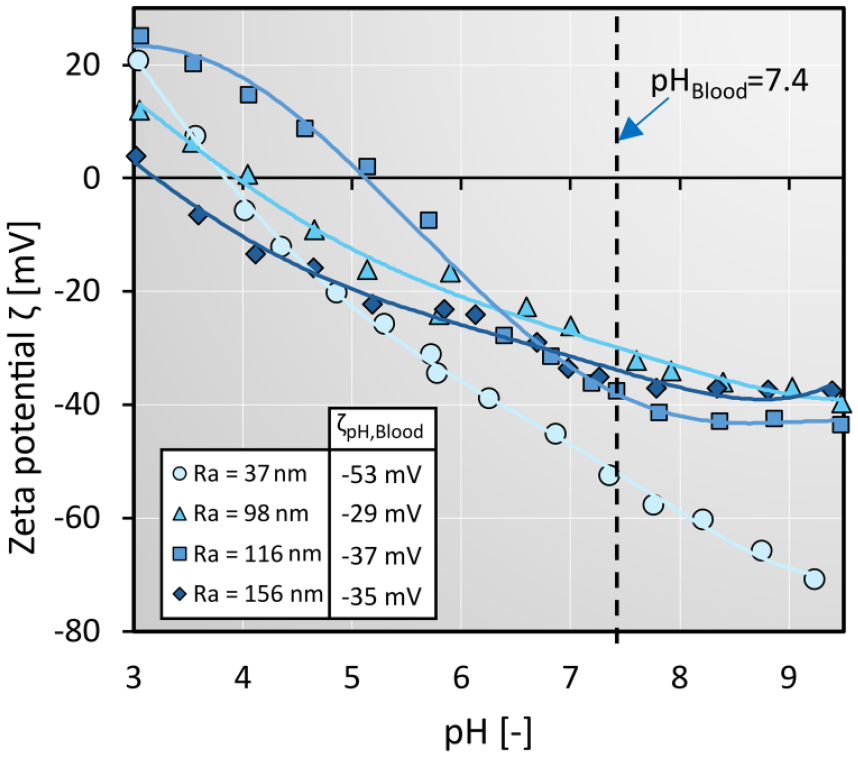
ζ-potential over pH for the titanium samples with different surface roughness levels including ζ-potential values at the pH of blood.
Discussion
In this study, we compared titanium samples with different surface roughness values (Ra) on a nanoscale range in terms of their CSA and ζ-potential.
The polished, mirror-finished samples appeared to have the least risk for platelet adhesion compared to the roughened samples with a strong to medium Wilcoxon test effect size. Those results are comparable to the findings of Linneweber et al. 5 and Schuster et al. 3 At the same time, the polished samples showed the most negative ζ-potential at physiological blood pH of 7.4, which is consistent with studies investigating mirror-finished samples 7 and samples with chemical surface treatment 6 in regard to ζ-potential.
Interestingly, the interpolated ζ-potentials for pH of 7.4 follow a similar trend as the mean CSA of platelets of our blood experiments, as depicted in Figure 5. This trend suggests that the change of ζ-potential due to nanoscale roughness variation is an important factor on the extent of platelet adhesion on titanium surfaces. Smooth surfaces are generally considered less thrombogenic, possibly due to less geometric features protruding inside or outside of the surface baseline and due to less specific surface area. 3 However, our findings suggest that the decreasing surface charge due to a lower nanoscale roughness might be an additional explanation for the improved hemocompatibility.
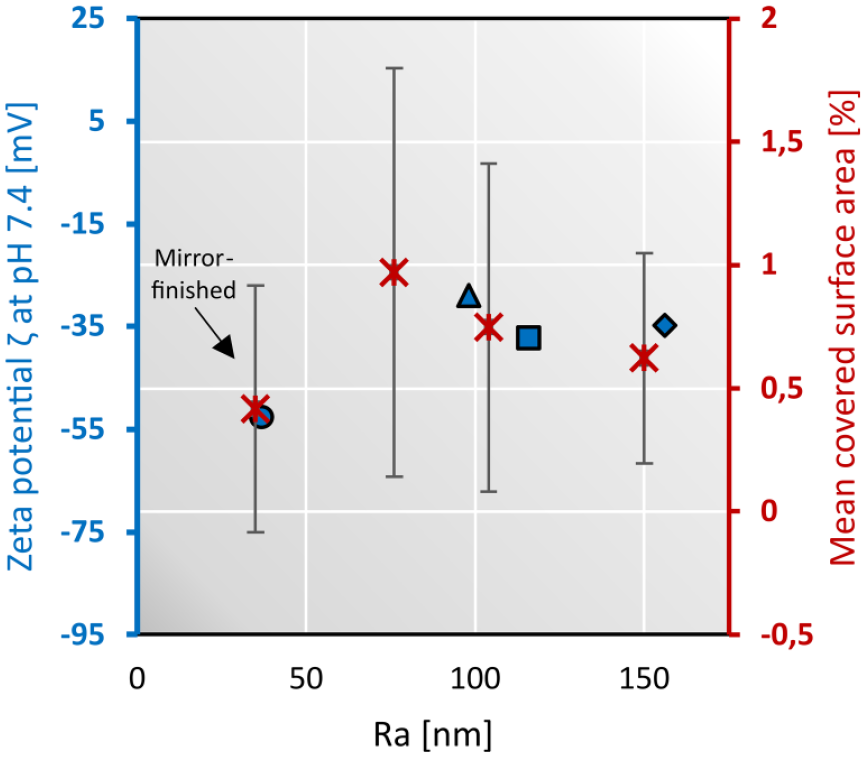
ζ-potential and mean covered surface area with standard deviation over roughness values Ra for all samples.
The blood experiments were conducted at room temperature, which might have decreased the CSA compared to experiments at 37°C due to defects in platelet adhesion, aggregation, and function. 11 However, the ζ-potential measurements were also conducted at room temperature to establish comparability. As usual, human whole blood experiments underly large variations caused by donor-dependent variability, which contributes to our relatively large error bars of Figure 5.
Note that the roughnesses of the samples for blood experiments do not exactly match the ones for the ζ-potential measurements as depicted in Figure 5. To avoid artifacts due to scratches by the tactile measurements, surface roughness values were measured only after the platelet adhesion and ζ-potential measurements, respectively, and the roughening process was not exactly reproduceable.
Fluorescence imaging is a strong tool to quantify the CSA, especially for larger areas. However, qualitative assessment on adherent proteins and platelet shape and aggregation is not possible. Since the interplay of different nanoscale structures and blood components play a crucial role in thrombus formation, 12 future work will include scanning electron microscopy to gain further insights into the relationship between surface charge, topography, and thrombus formation.
In conclusion, our findings give insights into the impact of nanoscale roughness on the surface charge and platelet adhesion on titanium within the same nanoscale range and underline the importance of considering the surface charge behavior of blood contacting titanium additionally to the topography itself. However, our study design, which does not treat the change of ζ-potential and topography independently, does not allow conclusions about the extent of the influence of the ζ-potential and the topography on the CSA, respectively. Our findings substantiate future studies that might directly correlate topography on a nanoscale, ζ-potential and CSA by systematically varying these parameters independently.
Footnotes
Declaration of conflicting interests
The author(s) declared no potential conflicts of interest with respect to the research, authorship, and/or publication of this article.
Funding
The author(s) disclosed receipt of the following financial support for the research, authorship, and/or publication of this article: For conducting the platelet adhesion experiements by the Investitionsbank Berlin (IBB).