
Abstract
The potential application prospects for concrete structure in island engineering and marine structures are increasing through the utilization of concrete composed of seawater, sea sand and coral aggregates (SSCC) combined with hybrid reinforcement. This innovative approach effectively addresses the diminishing availability of freshwater and river sand resources, as well as steel corrosion. This study explores the axial load carrying capacity and ductility of columns reinforced with combination of stainless steel bars and GFRP bars. The study conducted tests on 36 columns, varying in strengths (30 MPa, 40 MPa, 50 MPa), reinforcement types (GFRP bars (G group), stainless steel bars (S group), GFRP bars-stainless steel bars (GS group)), and reinforcement ratios (1.01%, 1.56%, 2.26%). The results exhibit positive correlation between the axial load carrying capacity of the column and both the strength grade and reinforcement ratio. In general, SSCC columns reinforced with stainless steel bars (S-SSCC) exhibit the highest axial load carrying capacity, followed by those reinforced with combination of GFRP bars and stainless steel bars (GS-SSCC), and SSCC columns reinforced with GFRP bars (G-SSCC) exhibit the lowest axial load carrying capacity. Furthermore, the axial load carrying capacity was determined utilizing ACI 440, CSA S806 and the finite element software ABAQUS. The results derived from the analytical model exhibited strong agreement with those obtained experimentally. Ductility analysis results suggest that columns with hybrid reinforcement can significantly improve ductility compared to those with only GFRP bars.
Introduction
Several advantages exist in utilizing seawater, sea sand and coral aggregates for concrete production in marine and island buildings. It not only saves freshwater resources, river sand, and coarse aggregates but also reduces transportation costs and allows for easy access to materials locally. Furthermore, seawater sea sand concrete has been found to have relatively high 7 days strength compared to ordinary concrete, with no significant difference in 28 days strength.1,2 Moreover, by adjusting the mixture proportions and incorporating specialized admixtures, the utilization of coral aggregates as coarse aggregate alternative can be optimized to fulfill the essential mechanical property requirements, which include both strength and durability characteristics. 3 Consequently, the adoption of concrete incorporating seawater, sea sand, and coral aggregates presents feasible and sustainable solution for marine construction projects. 4 It not only effectively utilizes marine resources including seawater and sea sand, but also accelerates the construction period and contributes significantly to the construction of marine structures and island engineering. 5
Numerous studies6,7 have indicated that coral aggregate concrete possesses remarkable early strength characteristics. Specifically, its strength after 7 days reaches 80% to 90% of the strength observed after 28 days. In the study by Sun et al. 8 it was determined that the amount of cement is the predominant factor influencing the strength of coral aggregate concrete. In comparison, the effects of the aggregate and water volume are relatively minor. Ning et al. 9 discovered that the replacement rate of coral aggregates has minimal effect on concrete strength, but the incorporation of seawater can improve early strength. Zhou et al. 10 study demonstrated that chloride salts can accelerate the hydration reaction, resulting in the rapid development of early strength in coral aggregate concrete. Wang et al. 11 proposed prediction model for the constitutive relationship of concrete under different replacement rates by investigating the mechanical properties of SSCC with varying replacement rates of coarse aggregates. Similarly, Zhou et al. 12 proposed constitutive models for coral aggregate concrete under uniaxial and conventional triaxial compression based on experimental results and literature review. These models exhibited good correlation with experimental results. Da et al. 13 developed a well-fitted constitutive model for coral aggregate concrete, particularly in the ascending curve, with reference to the model proposed by Guo et al. 14 for ordinary concrete.
FRP bars are increasingly favored in the field of engineering as reinforcing bars in SSCC, owing to their lightweight, high strength, and superior resistance to corrosion. As an alternative to steel bars, they are used to address the problem of chloride ion corrosion in marine structures and island engineering. Research15,16 has demonstrated that the reinforcement ratio influences the axial load carrying capacity of columns, and decreasing the spacing between transverse reinforcements can improve the ductility of columns. According to Mohamed et al. 17 the restraint effect of FRP spiral transverse reinforcements is superior to that of FRP circular transverse reinforcements, but it has limited effect on improving the ductility of the column. In their study, Wang et al. 18 discovered that the use of GFRP spiral transverse reinforcements and longitudinal bars can effectively limit crack development and improve the ductility of columns. By increasing the reinforcement ratio of the spiral transverse reinforcements, both the shear load carrying capacity and the ultimate lateral displacement of the column are significantly improved. Chen et al. 19 systematically explored the mechanical characteristics of CFRP reinforced coral aggregate concrete columns, utilizing both experimental studies and finite element modeling approaches. The results indicated that the concrete strength played a dominant role in determining the axial load carrying capacity, whereas the effect of the reinforcement ratio and the spacing of transverse reinforcements was comparatively less significant. In their finite element analysis, Li et al. 20 showed that higher reinforcement ratio of GFRP bars improves the column’s axial load carrying capacity. Additionally, it indicates that adding steel fibers aids in improving the ductility of the column.
The linear elastic stress–strain relationship model of FRP bars results in the brittle failure of FRP reinforced concrete structures. To improve ductility for FRP reinforced concrete structures, hybrid reinforcement approach using both FRP bars and steel bars is suggested. Yuan et al. 21 found that under reverse cyclic loading, hybrid reinforced ECC concrete columns had higher ultimate load carrying capacity and post-yield stiffness, as well as smaller residual displacement compared to FRP reinforced ECC concrete columns. Ni et al. 22 analyzed the failure modes of hybrid reinforced concrete columns and established theoretical calculation equations for load carrying capacity under different failure modes. Zhang et al. 23 derived calculation equation for the load carrying capacity of eccentrically compressed columns with hybrid reinforcement using finite element software, and their results corresponded closely with experimental results. Using finite element modeling, Wang et al. 24 obtained results indicating that the load carrying capacity of columns with hybrid reinforcement subjected to eccentric compressive loads is less than that of reinforced concrete columns. The load carrying capacity of hybrid reinforced columns rises with an increasing reinforcement ratio but decreases as the slenderness ratio, longitudinal reinforcement area ratio, and eccentricity grow.
Although hybrid reinforced concrete columns have been studied, there are relatively few studies that include SSCC reinforced with both stainless steel bars and FRP bars. This study suggests the use of SSCC columns reinforced with both stainless steel bars and GFRP bars to improve the ductility of marine structures and island engineering projects. This innovative approach not only addresses the critical issue of resource shortage, but also significantly improves the ductility of FRP reinforced concrete structures by efficiently utilizing the resources of seawater, sea sand and coral aggregate. This study investigates the mechanical properties of 36 columns under axial compression, varying in strengths (30 MPa, 40 MPa, 50 MPa), reinforcement types (GFRP bars (G group), stainless steel bars (S group), GFRP bars-stainless steel bars (GS group)) and reinforcement ratios (1.01%, 1.56%, 2.26%). Theoretical calculations, FE analysis using commercial software ABAQUS 25 and experimental results are compared to validate the results of this study.
Experimental programs
Raw materials
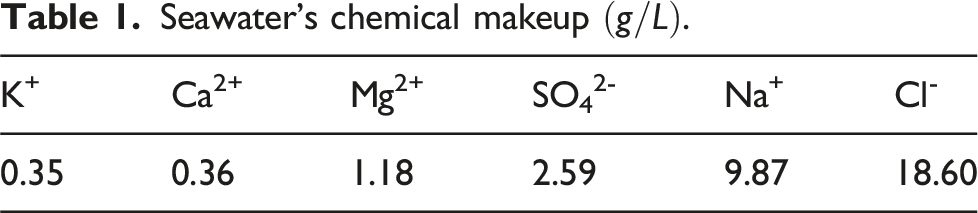
Seawater’s chemical makeup
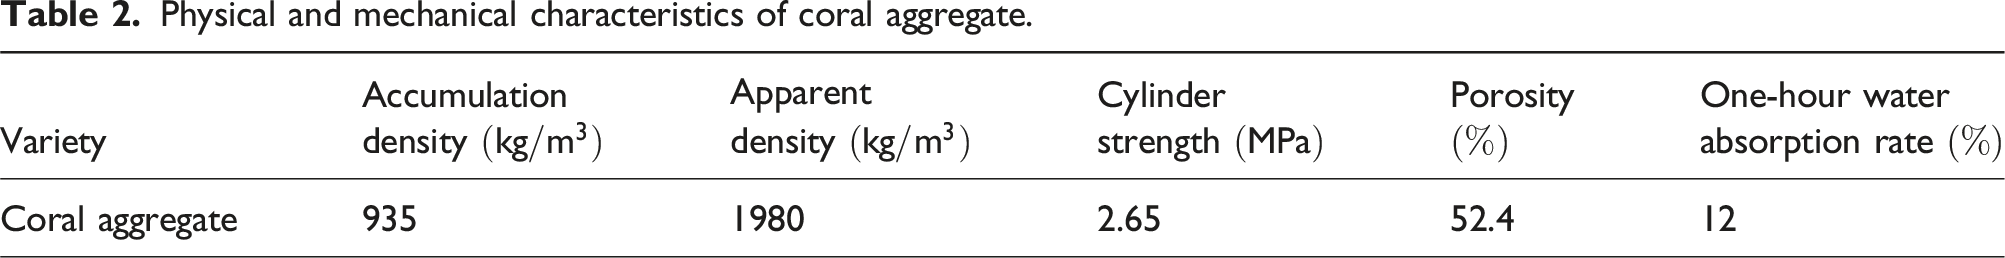
Physical and mechanical characteristics of coral aggregate.
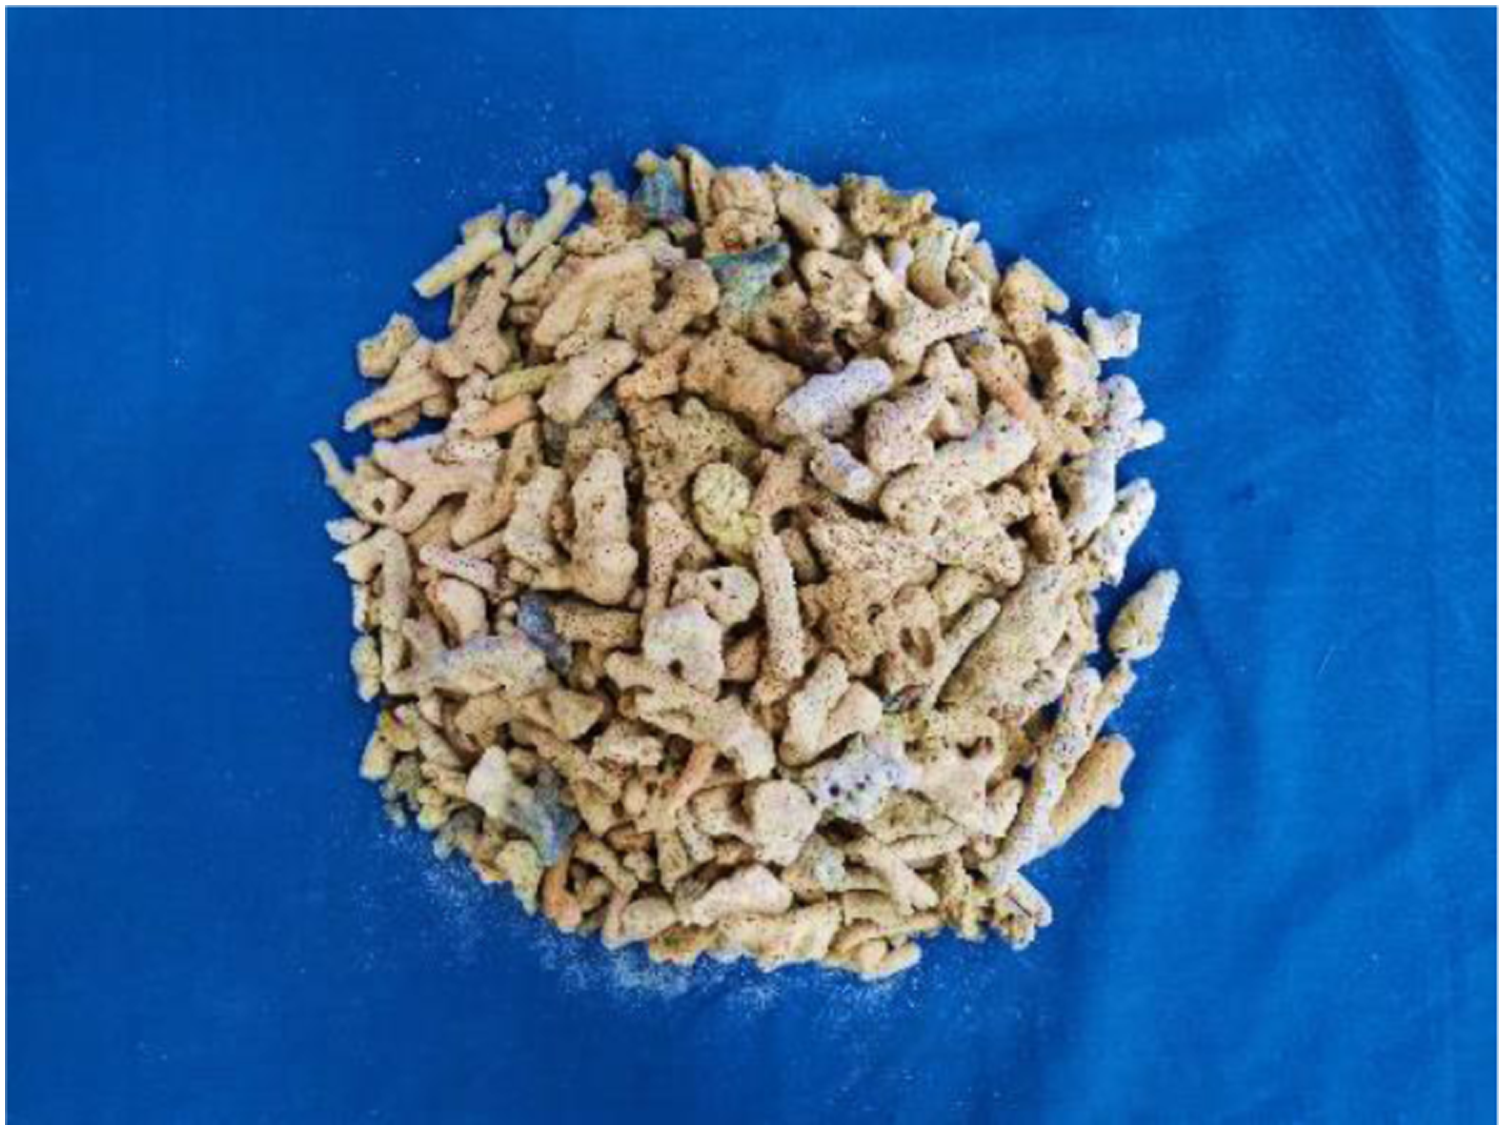
Coral aggregate.
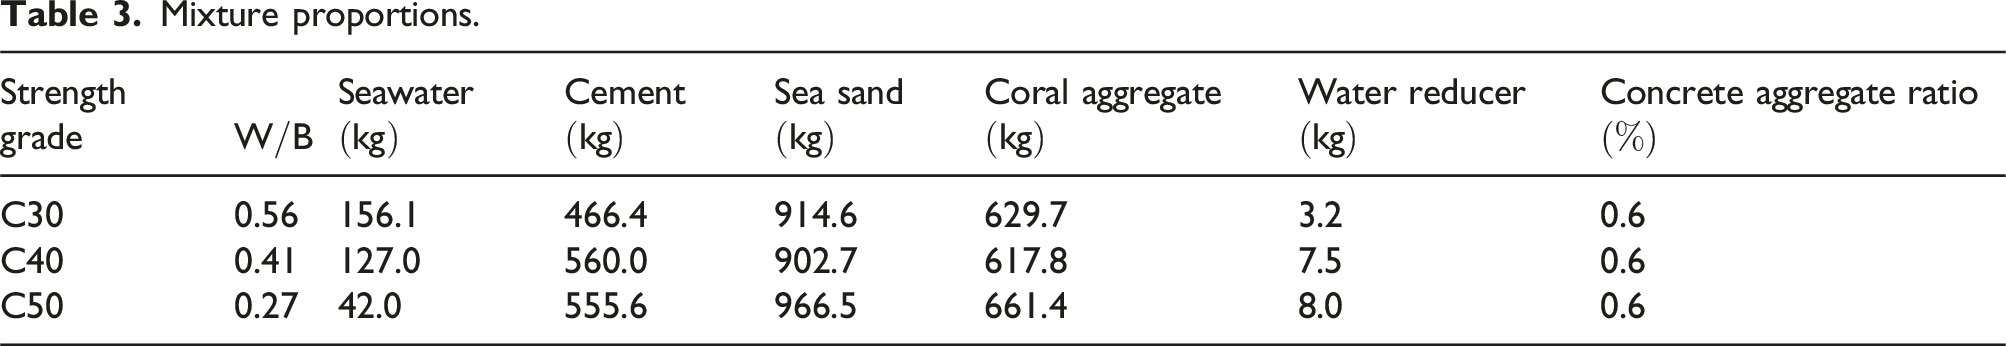
Mixture proportions.
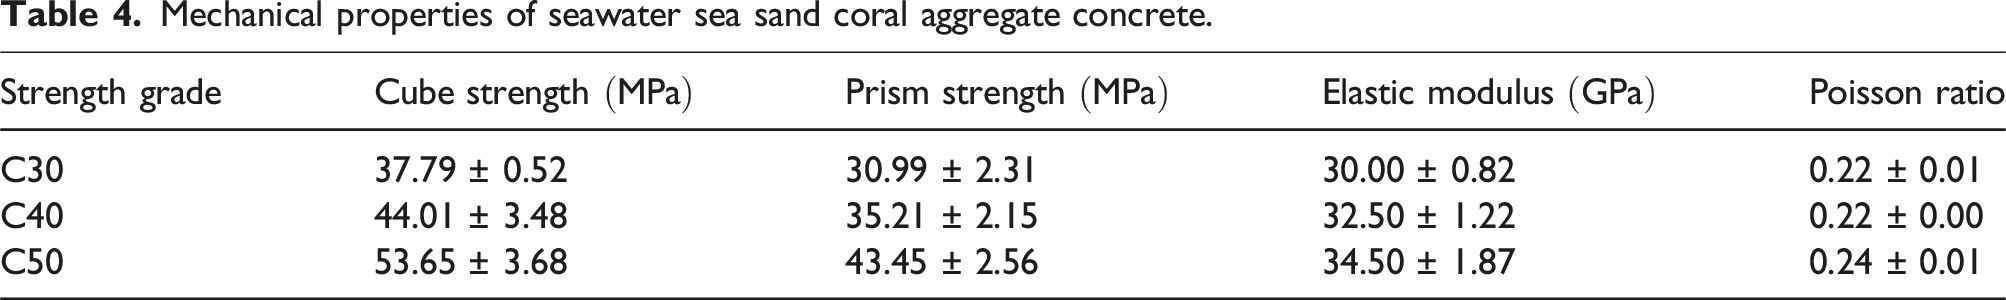
Mechanical properties of seawater sea sand coral aggregate concrete.
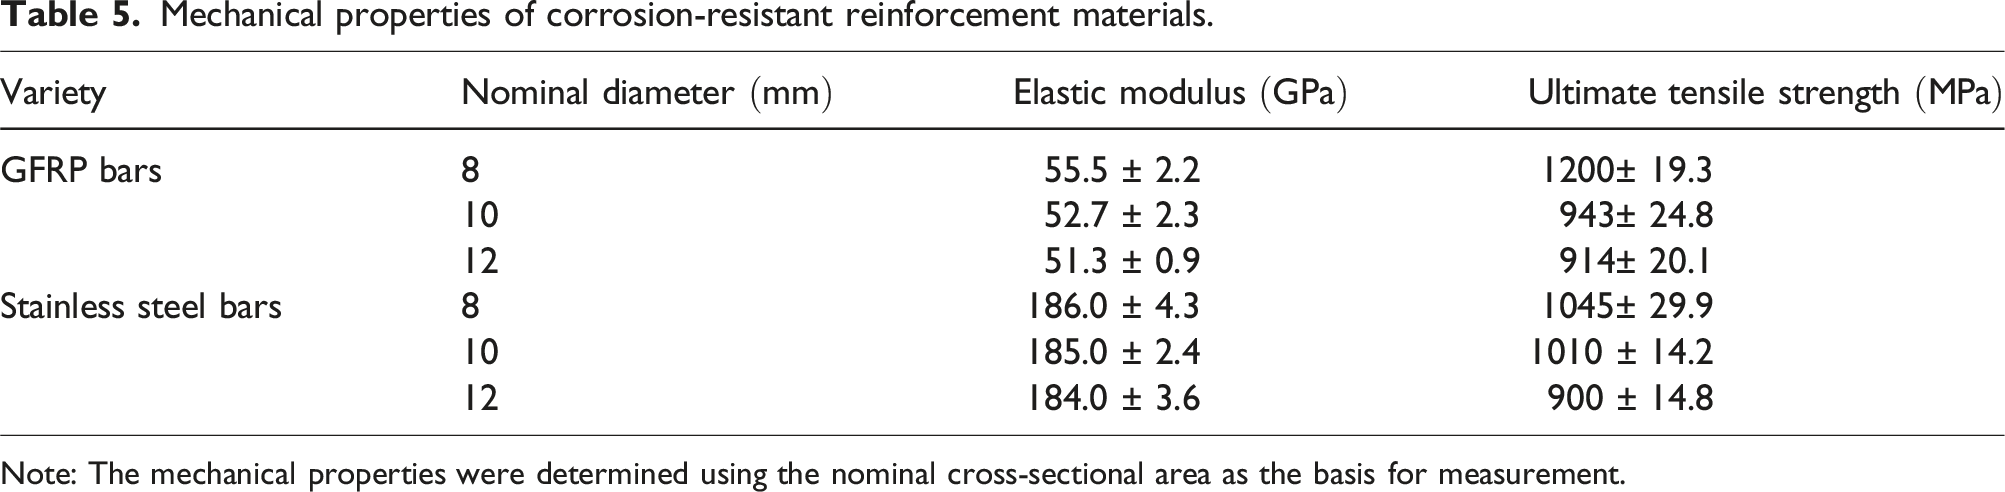
The experiment utilizes two types of corrosion-resistant reinforcement materials: stainless steel bars and GFRP bars. The bars, as shown in Figure 2(a), have nominal diameters of 8 mm, 10 mm, and 12 mm. Figure 2(b)–(d) provide illustrations of the cross-sections for the GFRP bars, each corresponding to their respective diameters. The test procedures followed the standards of ASTM D7205/D7205M-21 and GB/T 228.1-2021.31,32 A total of five specimens for each type of corrosion-resistant reinforcement materials were tested to obtain each set of data. Table 5 provides information on the mechanical properties of corrosion-resistant reinforcement materials. Photos of corrosion-resistant reinforcement materials (a) Corrosion-resistant reinforcement materials (b) GFRP bars featuring 8 mm nominal diameter (c) GFRP bars featuring 10 mm nominal diameter (d) GFRP bars featuring 12 mm nominal diameter. Mechanical properties of corrosion-resistant reinforcement materials. Note: The mechanical properties were determined using the nominal cross-sectional area as the basis for measurement.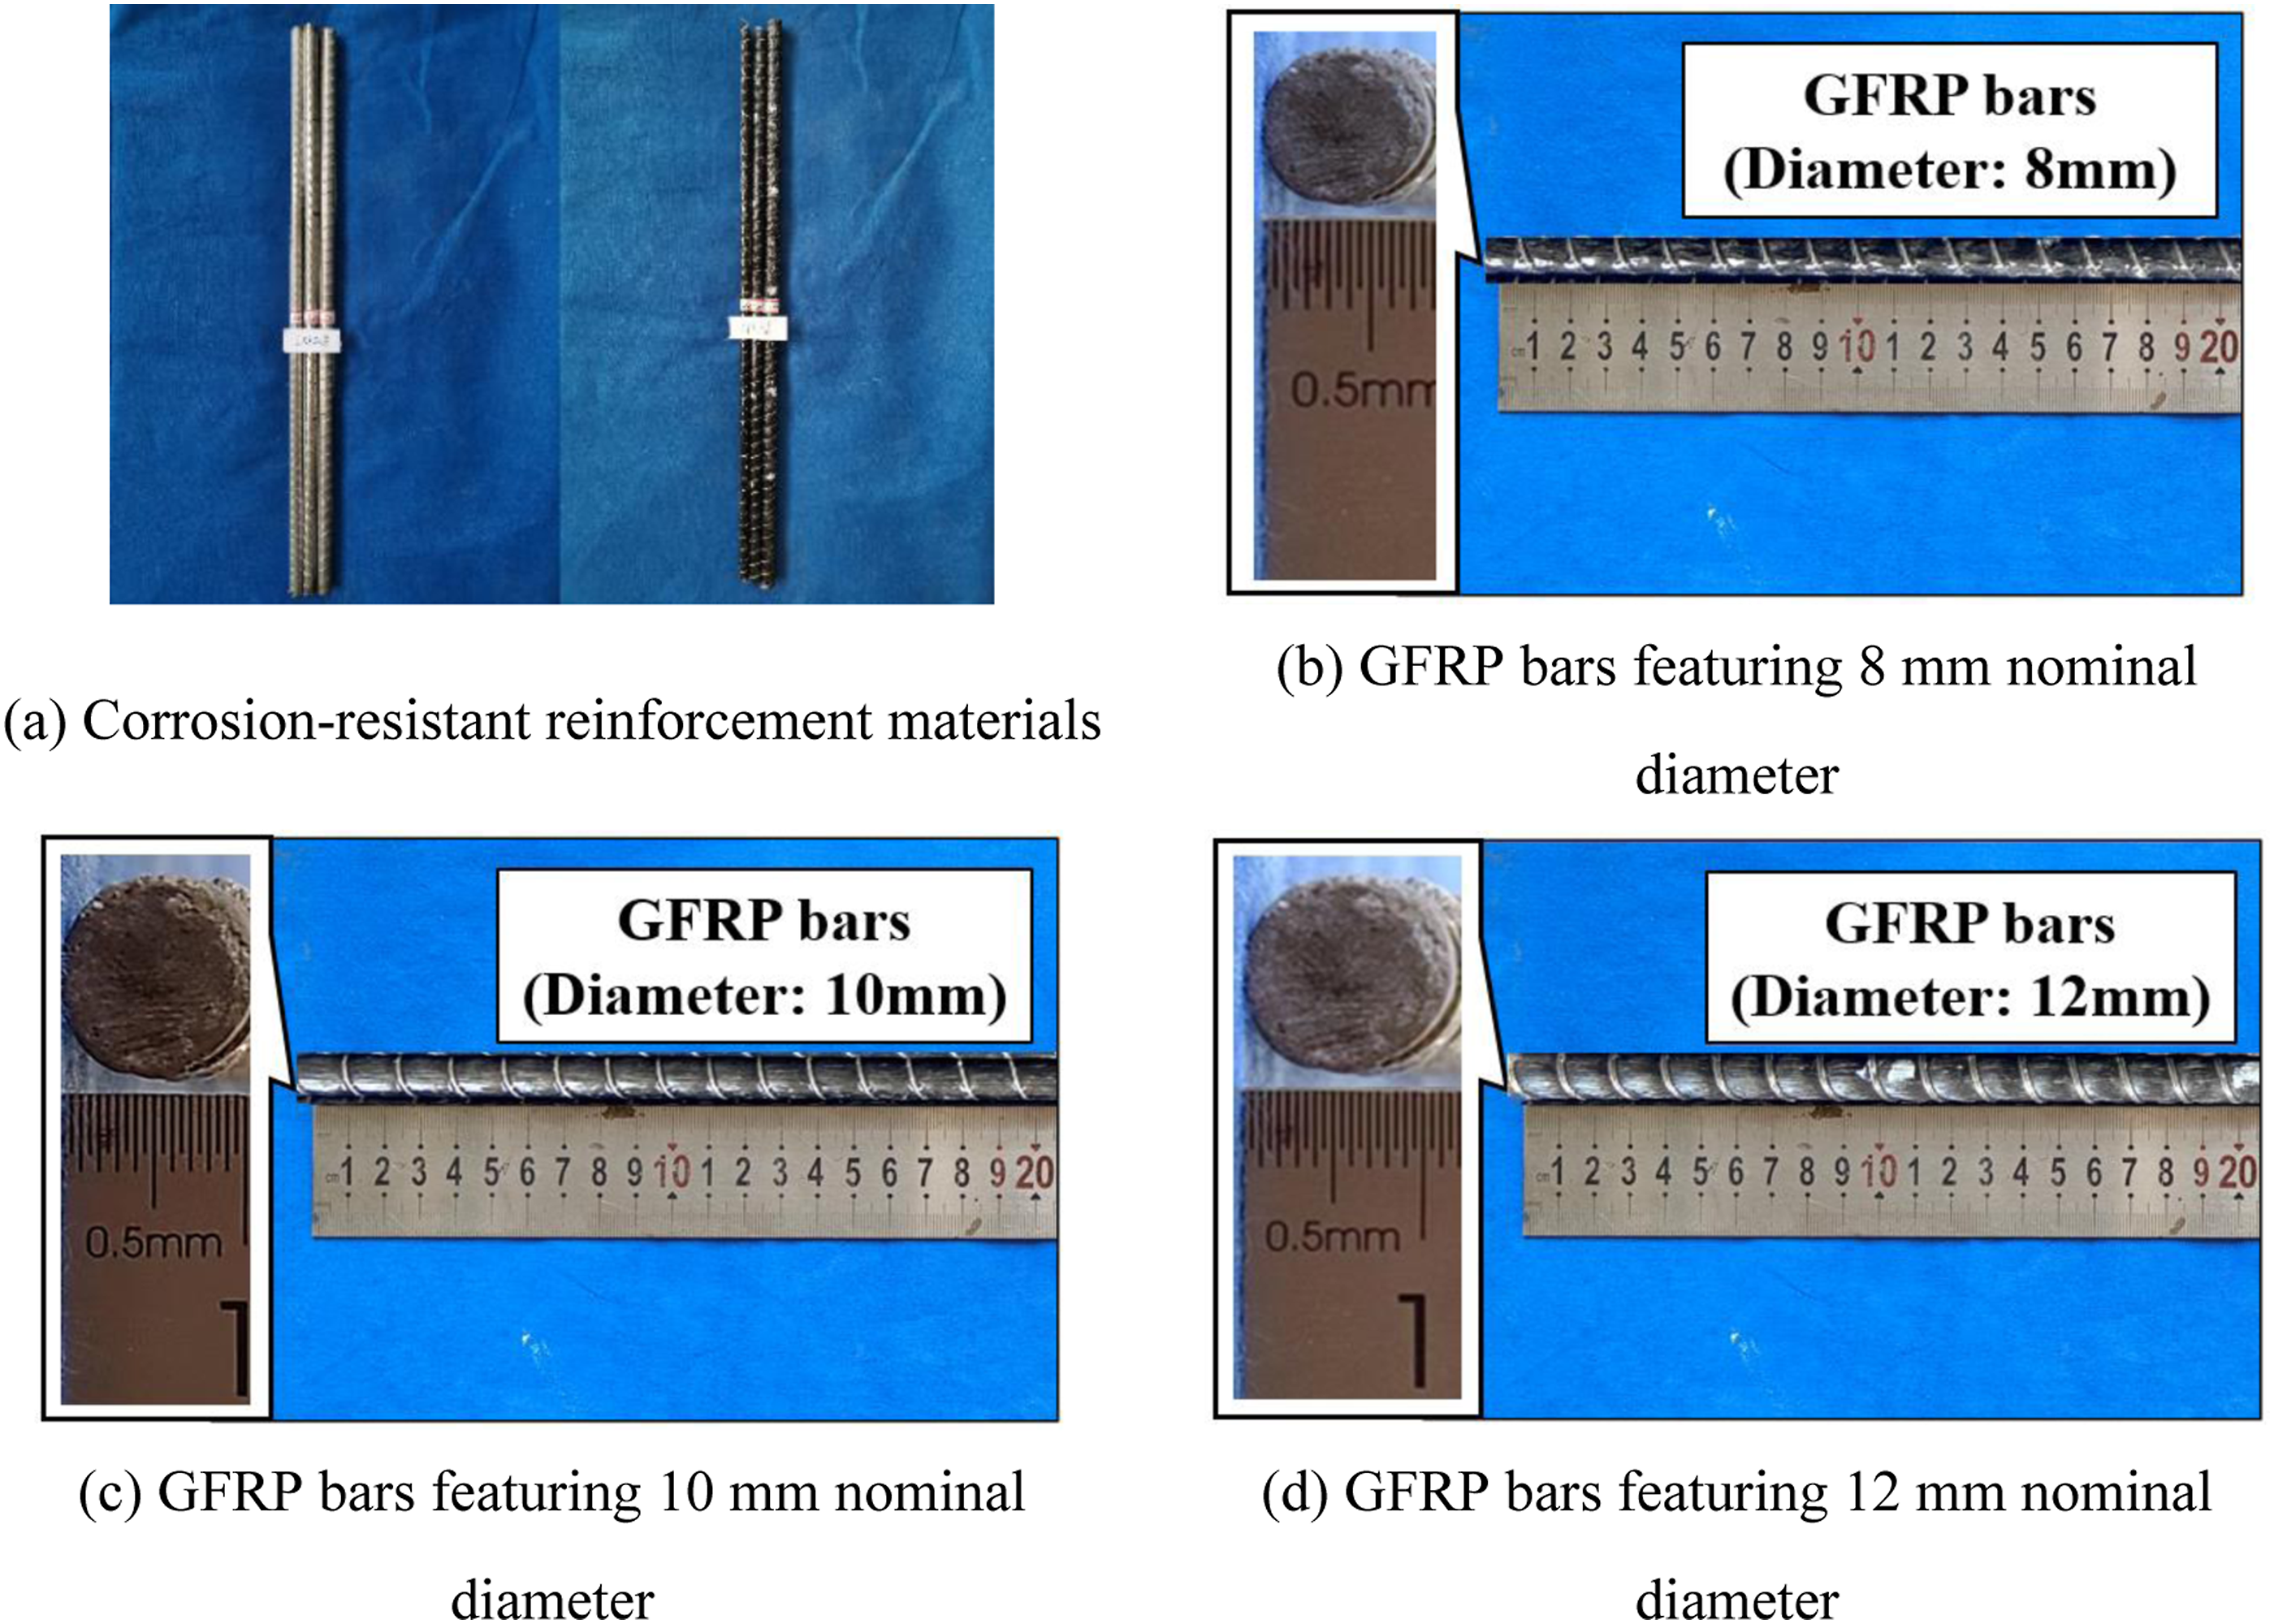
Specimen design
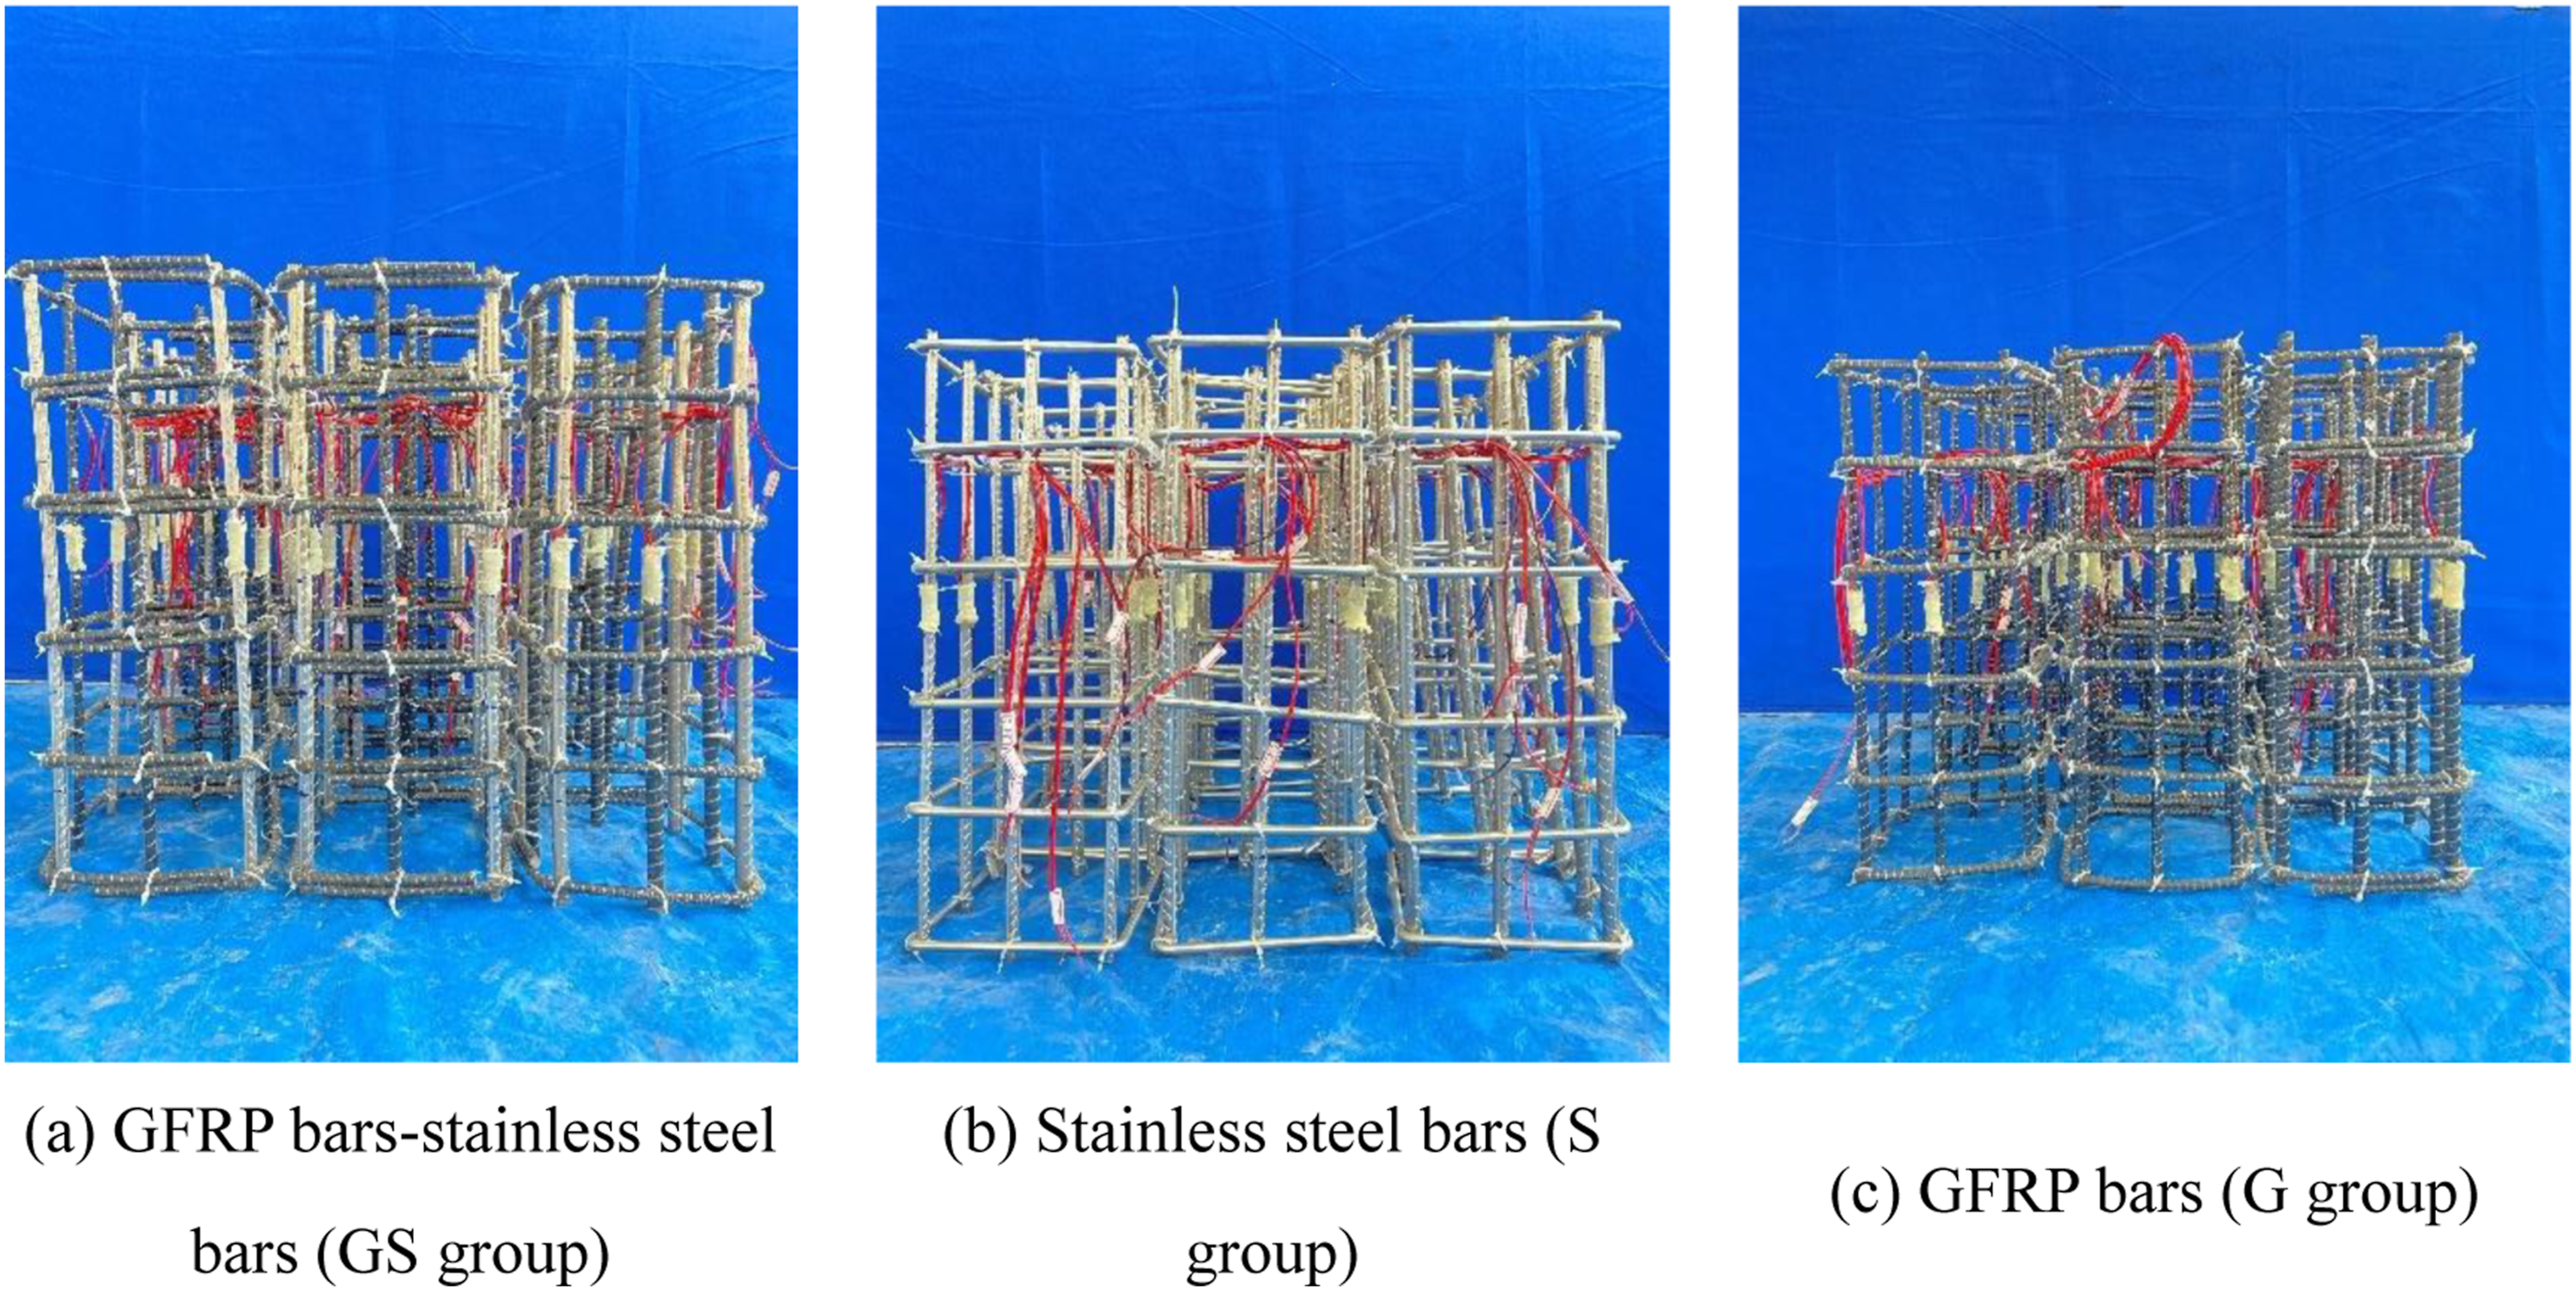
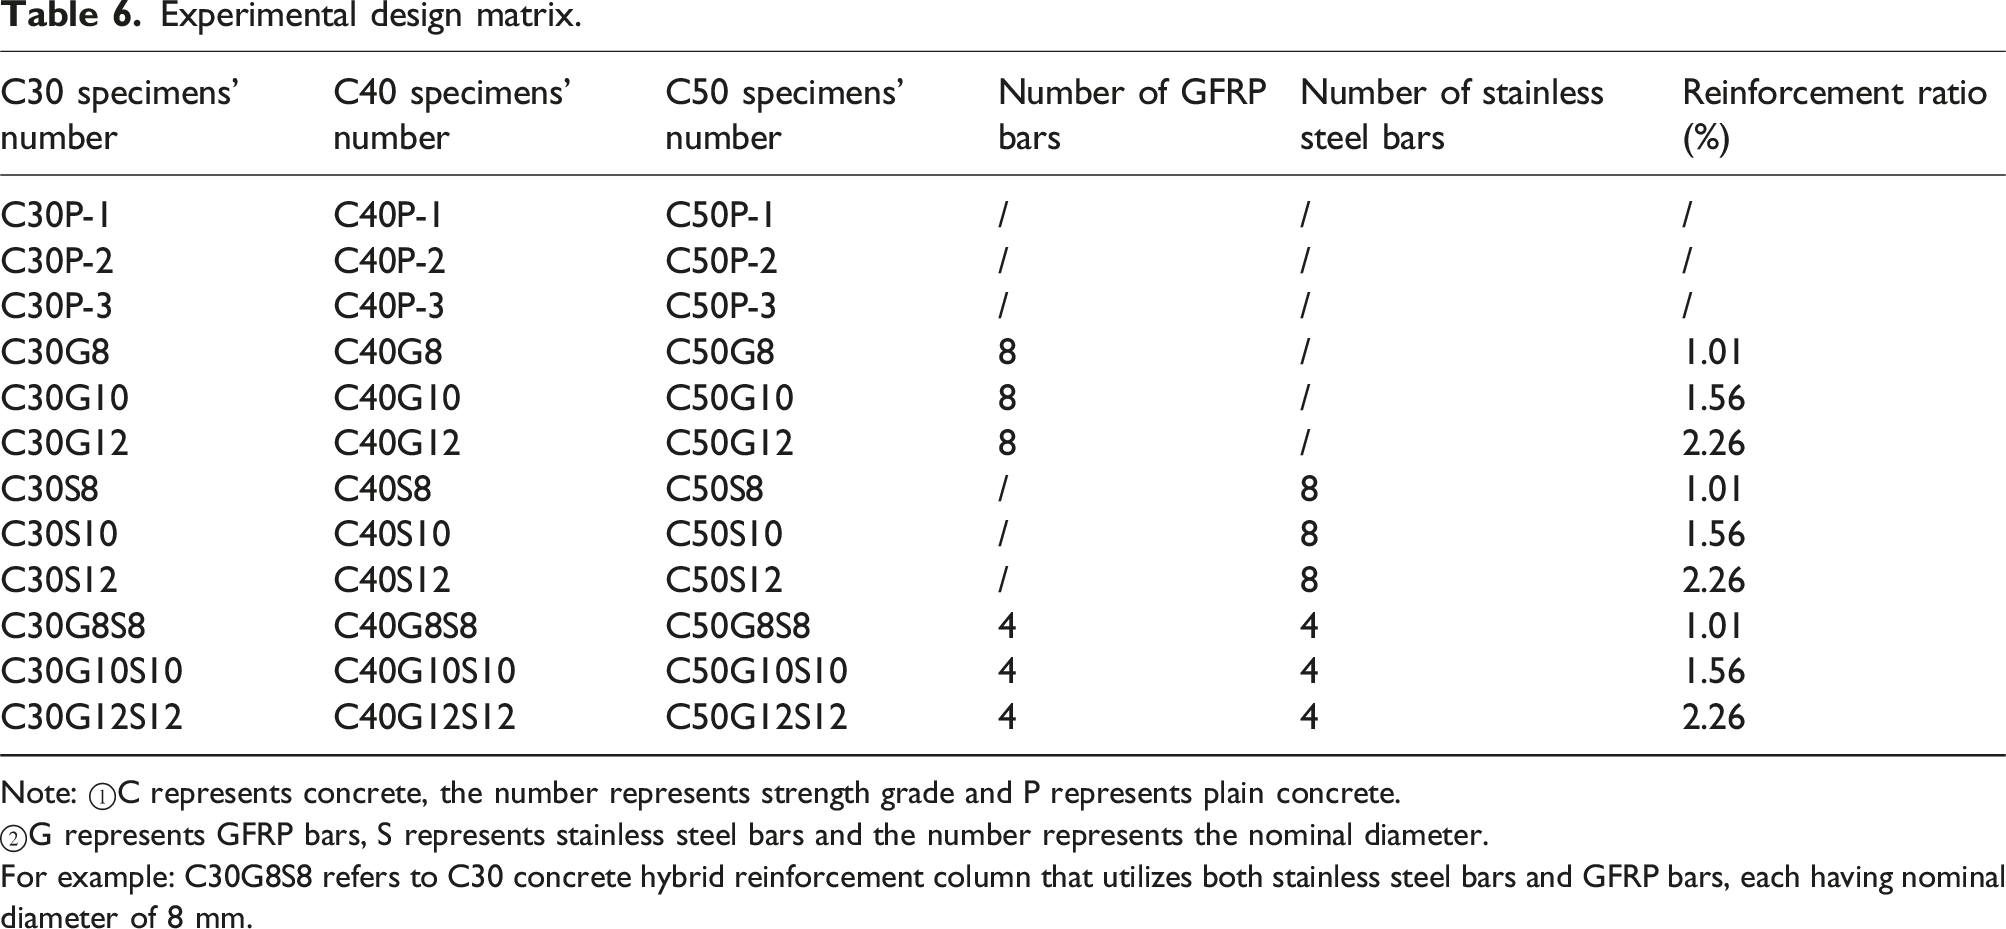
In this study, 36 reinforced concrete columns were constructed and designed for experimental analysis. The dimensions of the columns were 200 × 200 × 500 mm. The experiment involved varying strength grades (30 MPa, 40 MPa, 50 MPa), types of reinforcement and reinforcement ratios (1.01%, 1.56%, 2.26%). The concrete cover thickness is 15 mm. The longitudinal bars have a length of 470 mm. The spacing of the transverse reinforcements is set at approximately 94 mm. Each column is uniformly reinforced with 8 longitudinal bars. In hybrid reinforcement, stainless steel bars are positioned at the corners, while GFRP bars are positioned at the midpoint. Among them, G-SSCC columns and GS-SSCC columns utilize GFRP transverse reinforcements with a nominal diameter of 8 mm, while S-SSCC columns utilize stainless steel transverse reinforcements with nominal diameter of 8 mm. Figure 3 illustrates the details of the cross-section. Figure 4 illustrates the reinforcement cages corresponding to three different types of reinforcement. Table 6 provides the detailed experimental design matrix. Three repeated specimens were designed and tested for plain concrete columns. One specimen was designed and tested for each parameter combination of reinforced columns (totally 27 combinations). All the column specimens were cured by spraying seawater on all surfaces every day during the 28 days curing period in an outdoor environment. Details of cross-sectional (Dimension units of columns: mm). Reinforcement configuration (a) GFRP bars-stainless steel bars (GS group) (b) stainless steel bars (S group) (c) GFRP bars (G group). Experimental design matrix. Note: ①C represents concrete, the number represents strength grade and P represents plain concrete. ②G represents GFRP bars, S represents stainless steel bars and the number represents the nominal diameter. For example: C30G8S8 refers to C30 concrete hybrid reinforcement column that utilizes both stainless steel bars and GFRP bars, each having nominal diameter of 8 mm.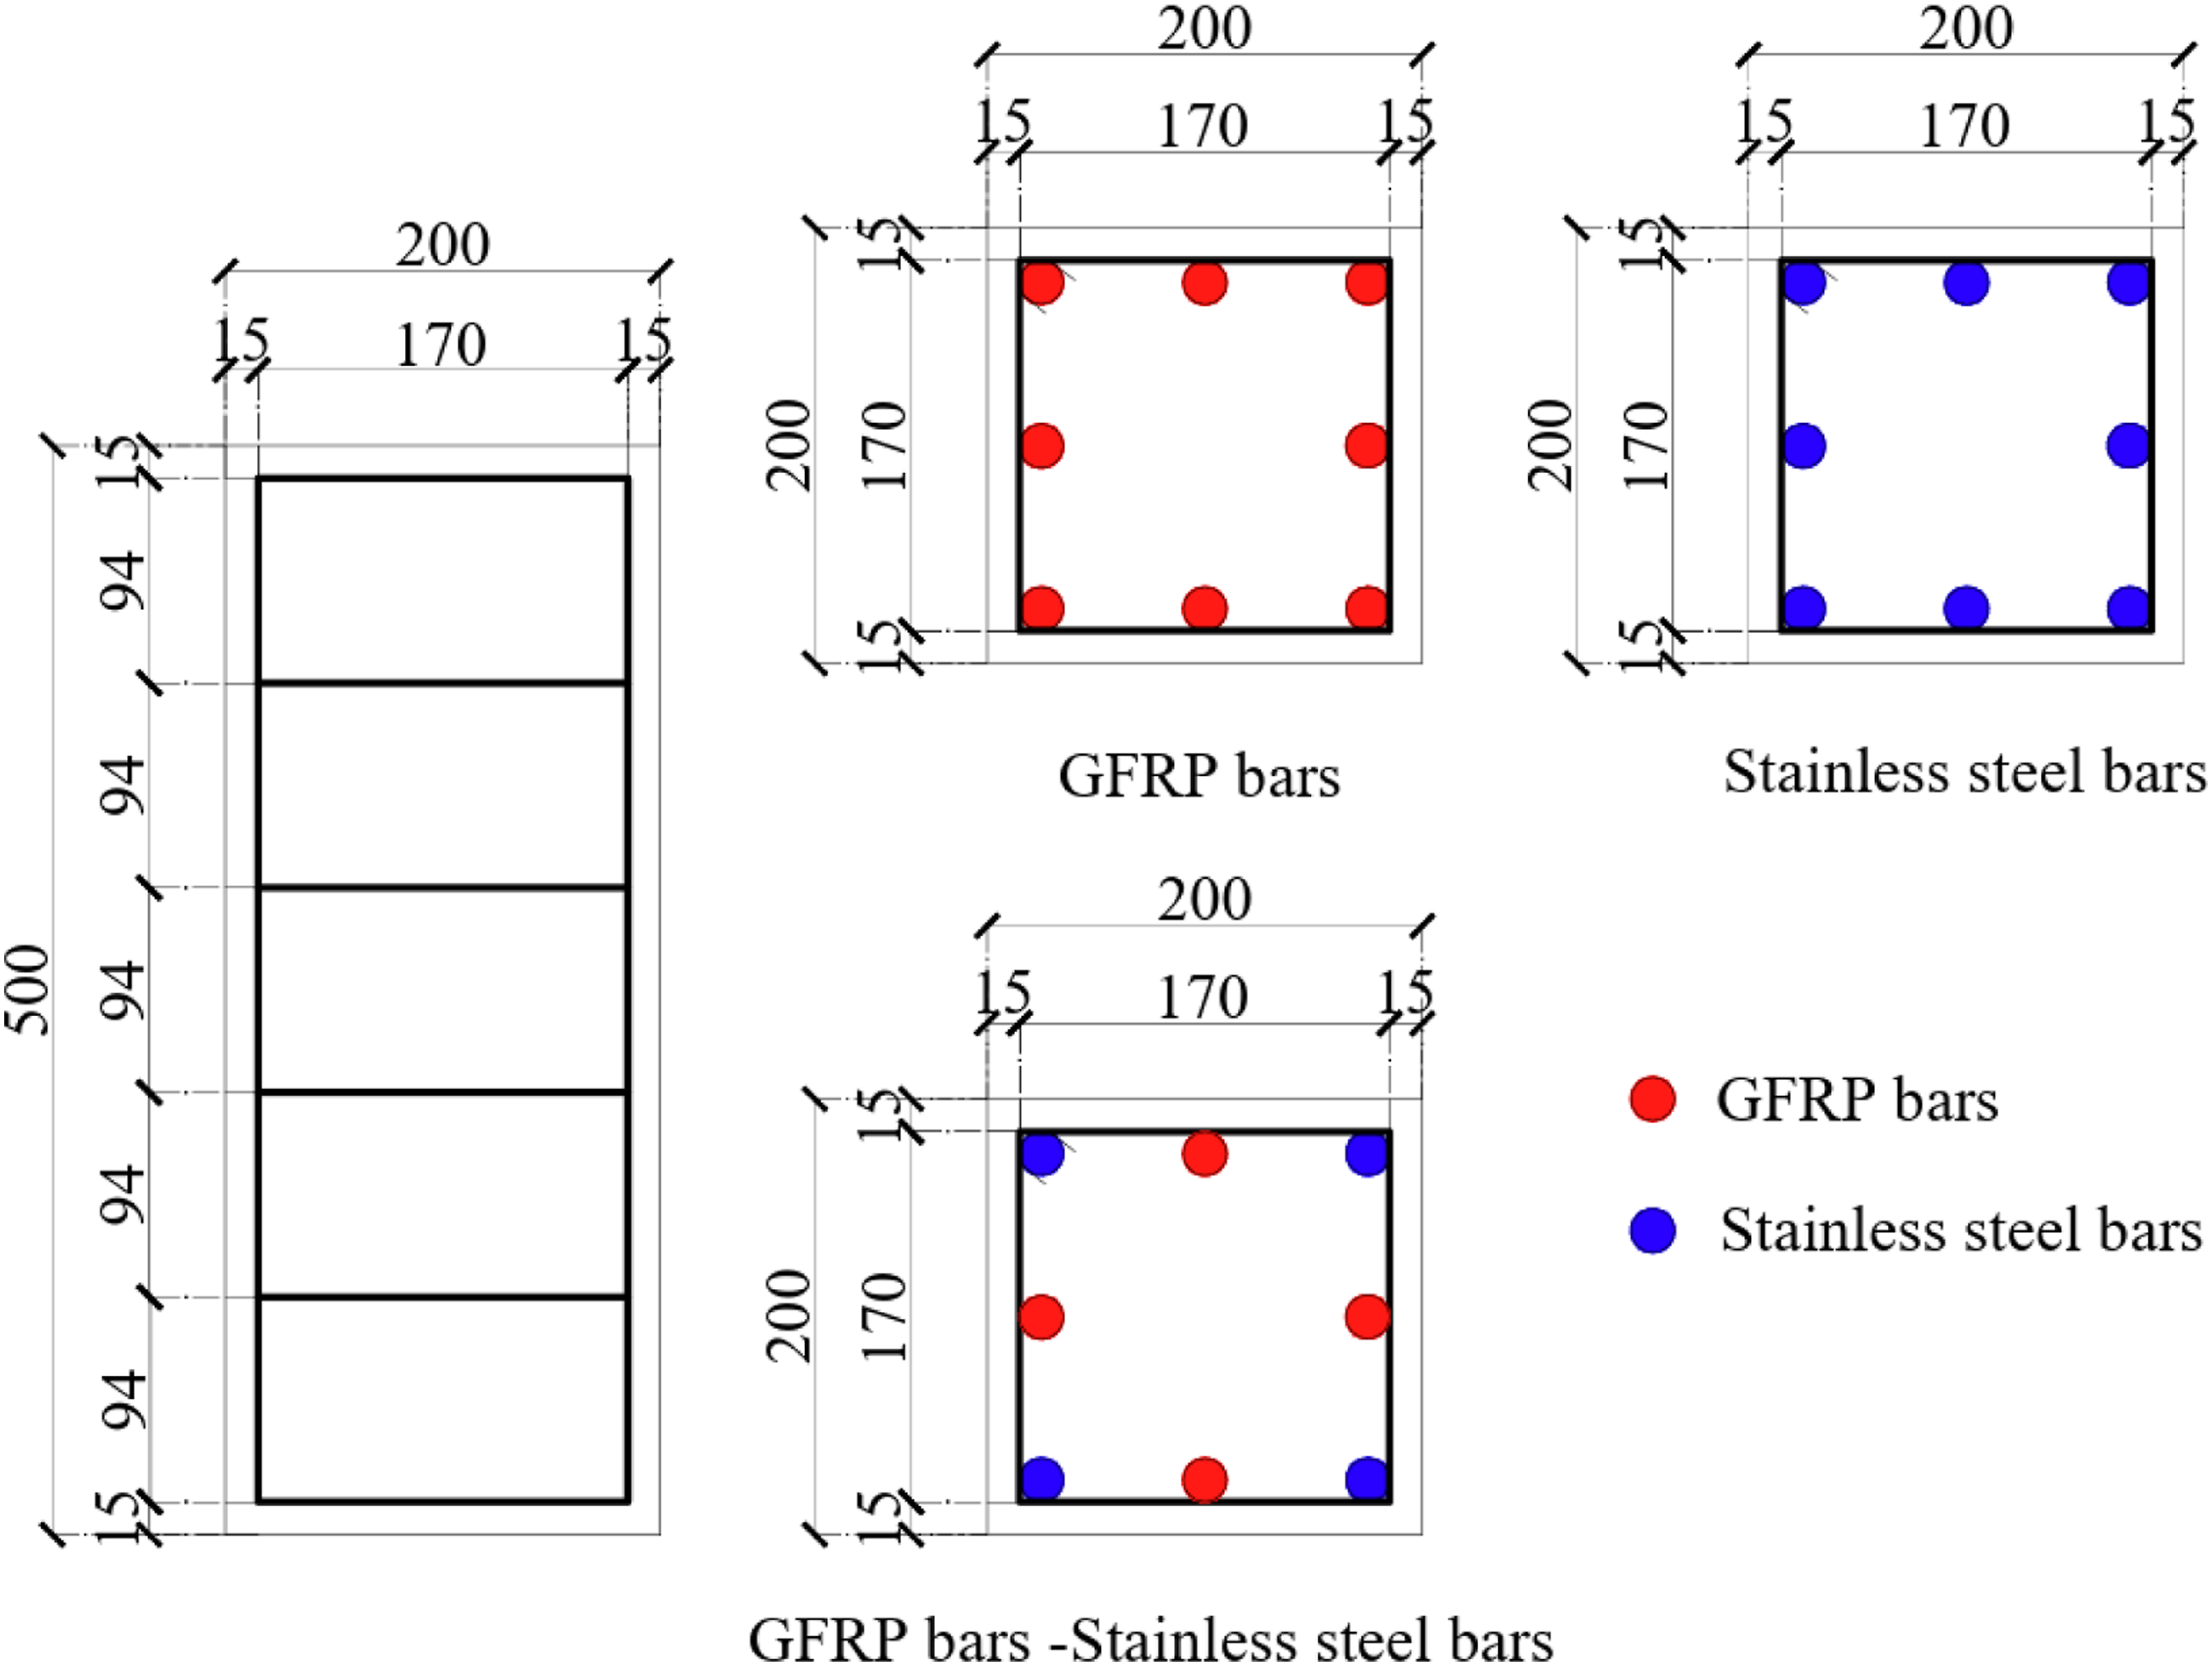
Loading scheme
Figure 5 illustrates the axial compression test conducted on a 5000 kN hydraulic testing machine. The displacement loading rate is set to 0.2 mm/min, and the measuring equipment is connected to the data acquisition system for collecting data. Before the experiment begins, the column is carefully positioned and balanced to prevent any eccentric loading. A preloading stage is applied at a load level that does not exceed 30% of the peak load in order to identify and resolve any issues before proceeding with the axial compression test. The experiment is concluded once the load has decreased to 30% of the peak value. 5000 kN hydraulic testing machine.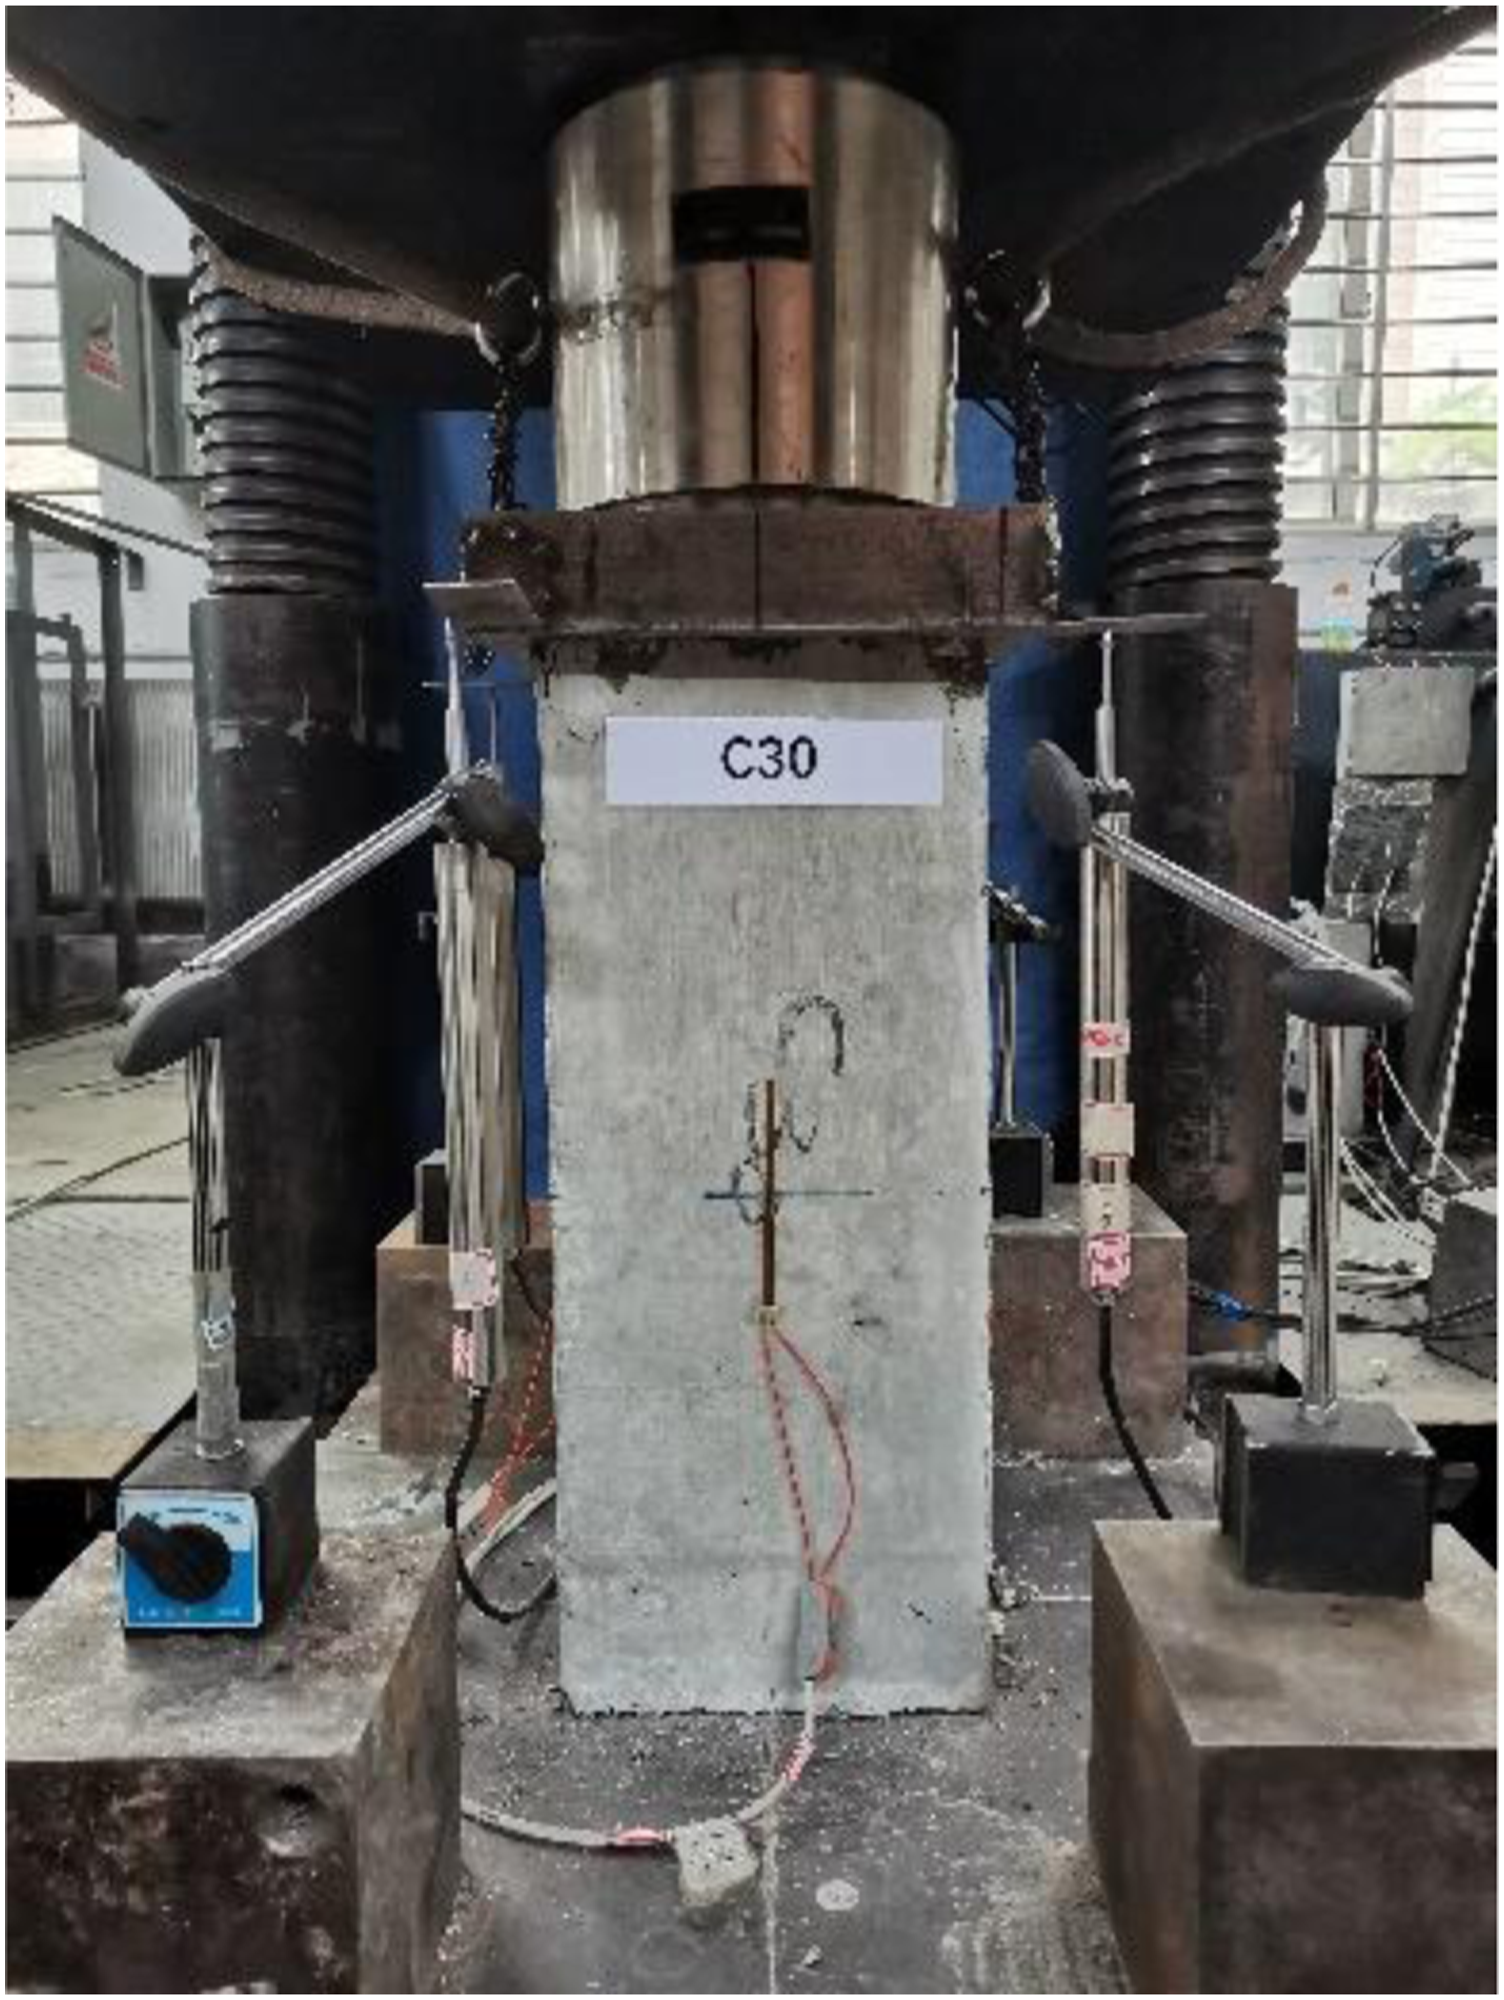
Theoretical calculation and FE simulation
Theoretical calculation
According to both ACI CODE-440.11-22 and CSA S806-12 (R2021),33,34 FRP bars are not advised to be considered as compression members in FRP reinforced concrete columns. Therefore, the theoretical calculation equations for the axial load carrying capacity are as follows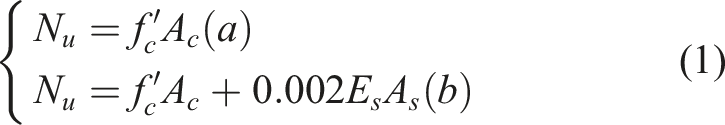
FE model
Constitutive relationship model of SSCC
In this experiment, the constitutive relationship of SSCC is established using a polynomial curve. To obtain more accurate results, a cubic polynomial is used to fit the ascending curve since the constitutive relationship of ordinary concrete is represented by a quadratic equation in the ascending curve. The fitting results are as follows
Constitutive control parameters of concrete with different strength grades.
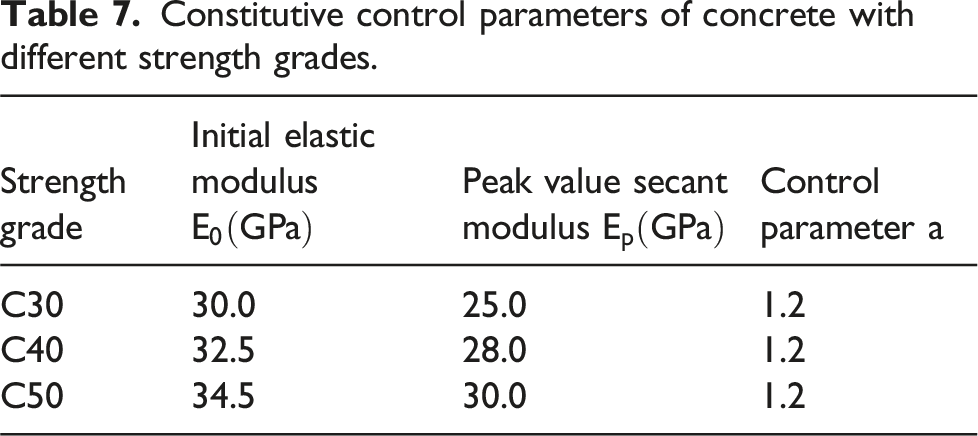
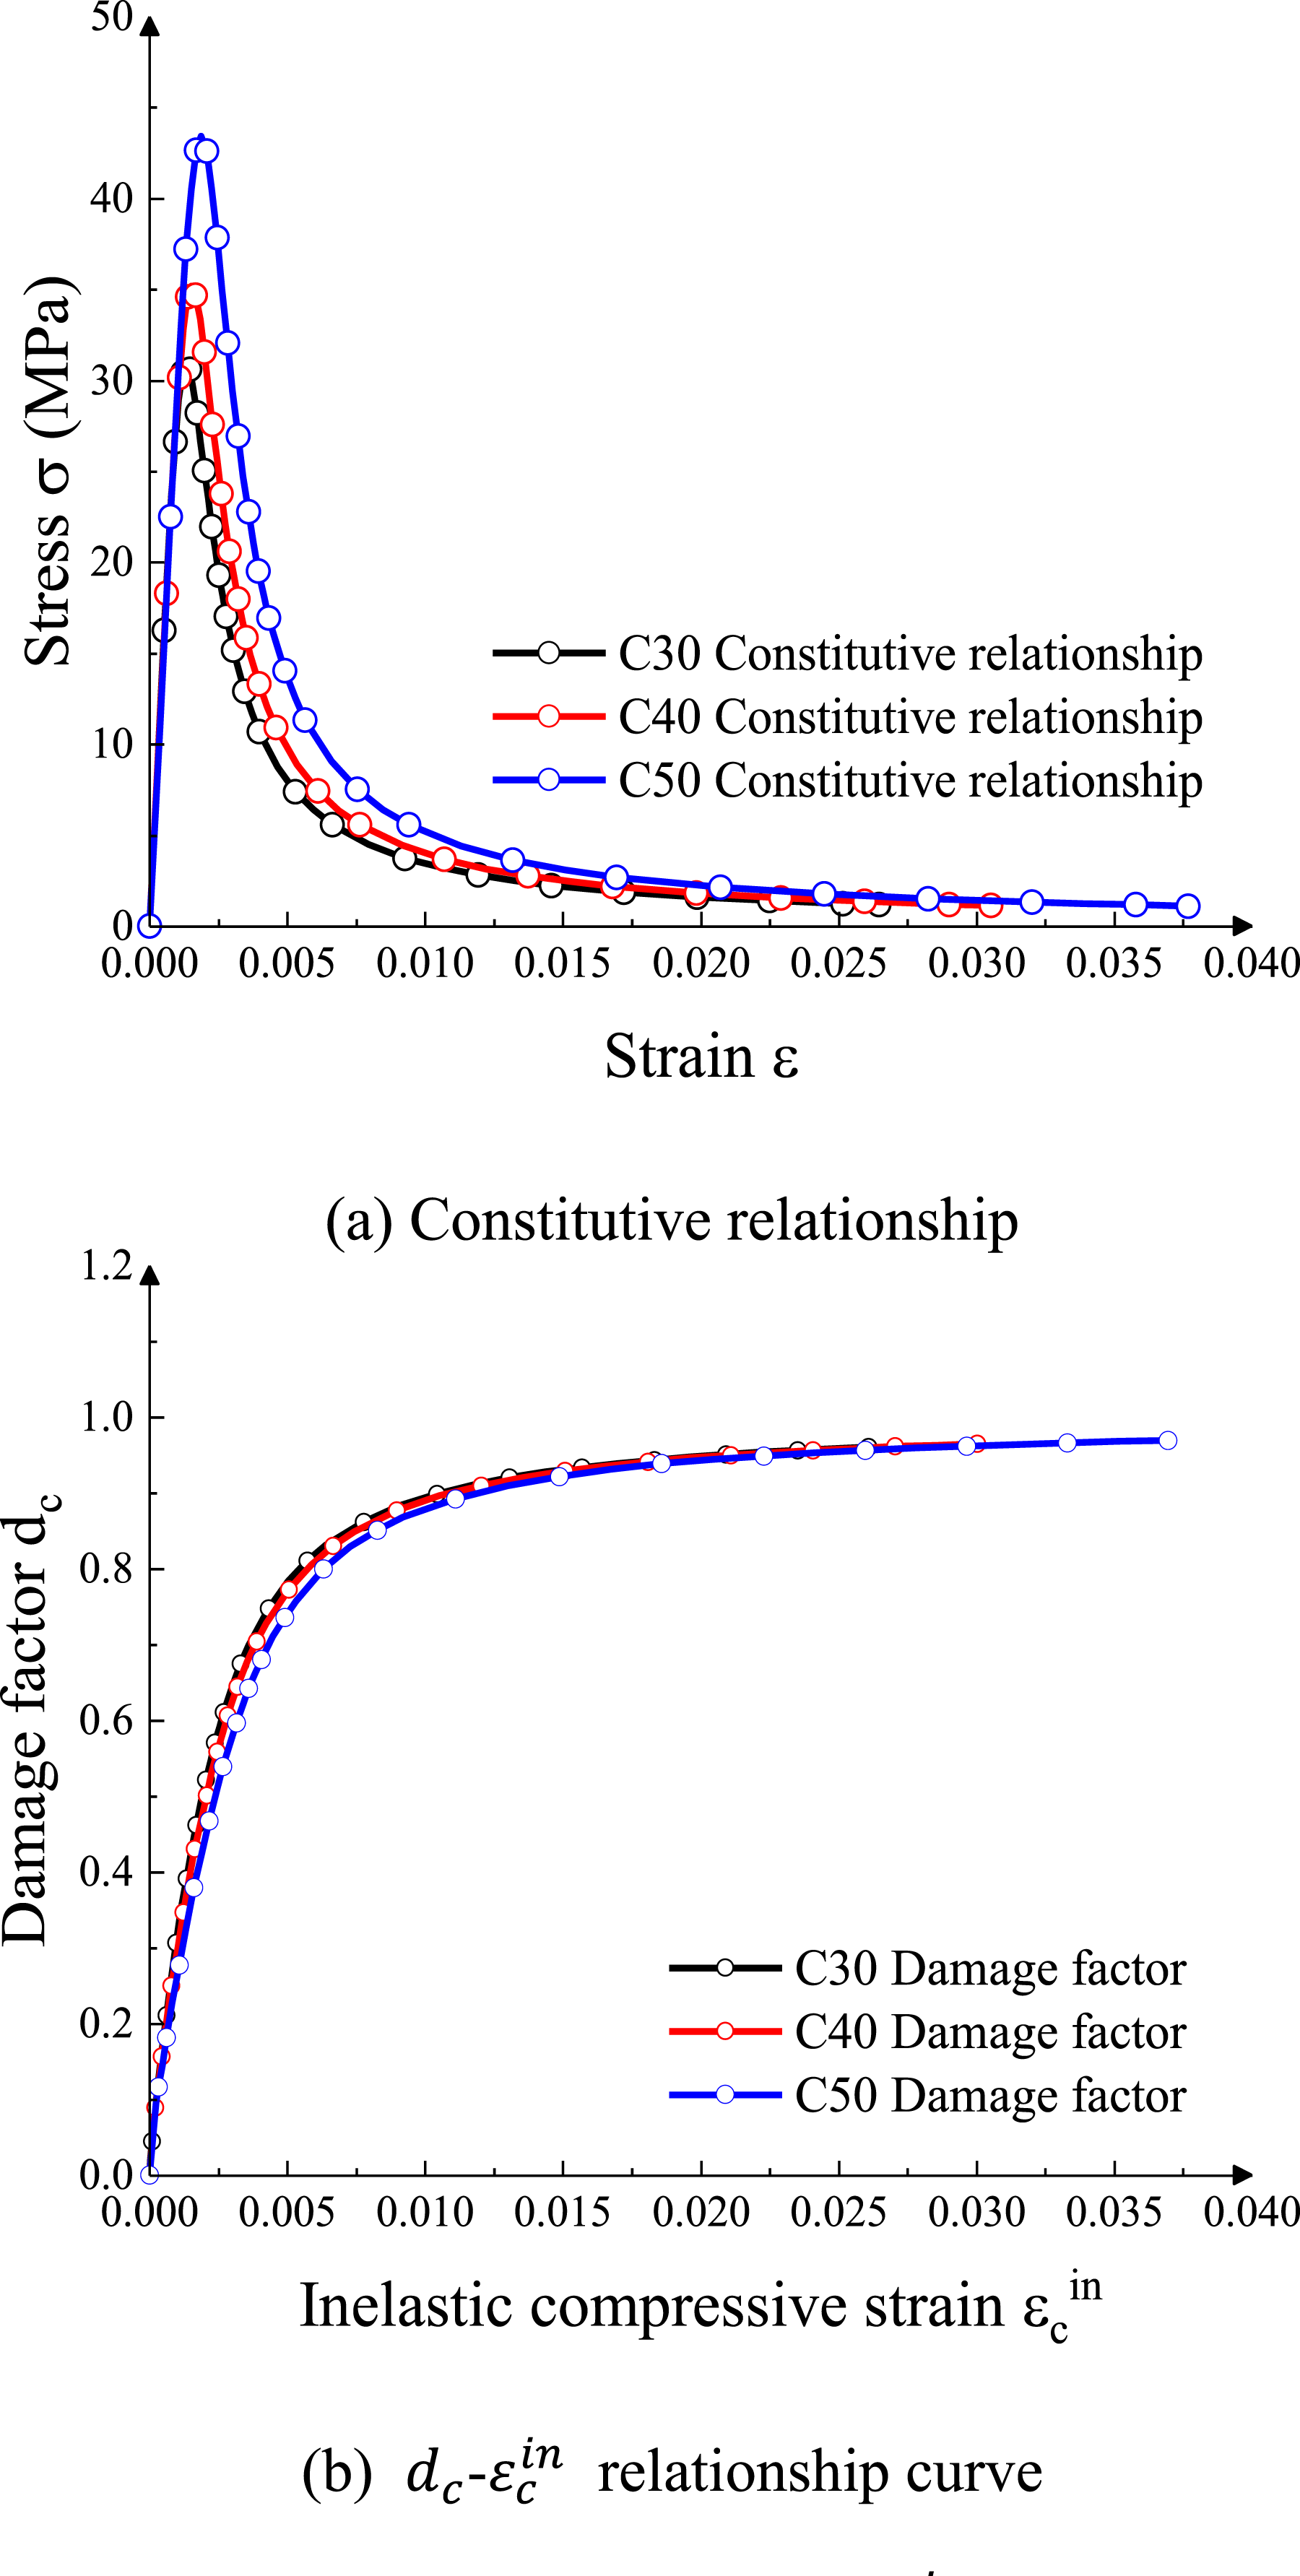
Constitutive relationship and
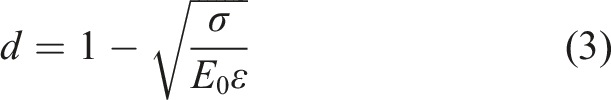
Damage factor adjustment and determination of CDP parameters
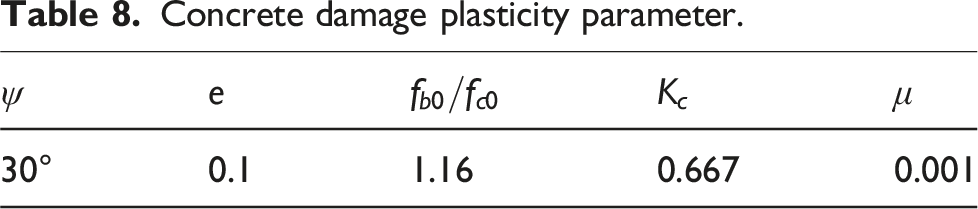
Concrete damage plasticity parameter.
In the equations,
Model configuration and mesh division
In the analysis step, the constraint conditions are added in the initial analysis step, and the vertical load is added in Step 1. In the interaction, coupling configuration is applied to the reference point, and embedded region is used between the bars and concrete to facilitate good bond between them. In the load, the constraint conditions and the vertical load are put into the corresponding analysis step. In the mesh division, the mesh size of concrete and bars is 25 mm. Among them, the unit type of concrete is selected as the solid element C3D8R, and the unit type of bars is selected as the truss element T3D2. The mesh division of the FE model is illustrated in Figure 7. In contrast to existing FE models, this study derives the constitutive relationship model of SSCC using experimental data. The constitutive relationship model proposed by Rasmussen
35
is used for stainless steel bars, resulting in FE analysis results that closely correspond with experimental results. Additionally, the use of ABAQUS software for visual modeling is advantageous for subsequent parametric research. Mesh division of finite element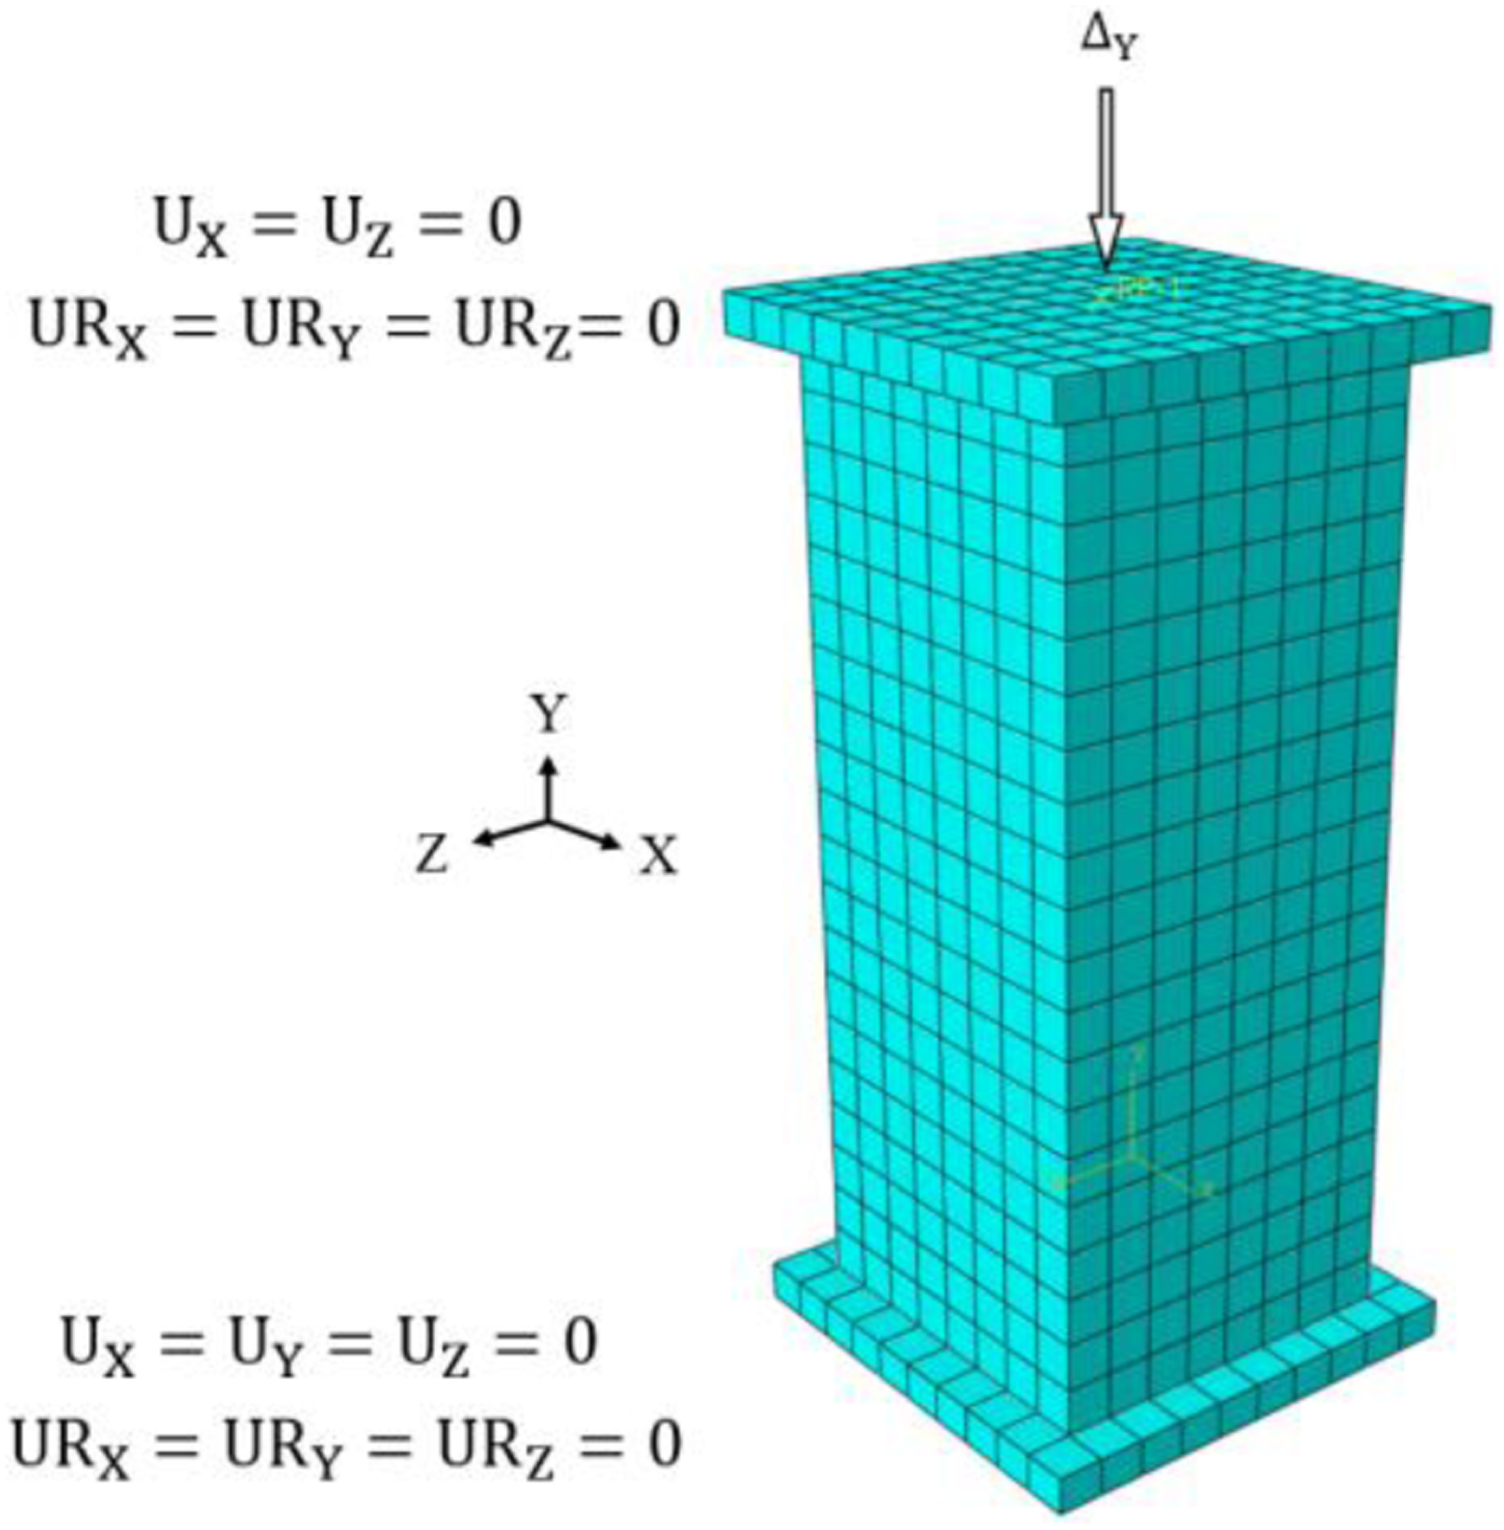
Results and analysis
Experimental phenomena and failure mechanisms
Given that the failure mode and mechanism are consistent across columns of varying strength grades, the failure mode of C30 grade concrete specimens is illustrated below as a representative example. Figure 8 illustrates the failure mode of the column. Failure modes (a) C30 P-SSCC column (b) C30 G-SSCC column (c) C30 S-SSCC column (d) C30 GS-SSCC column.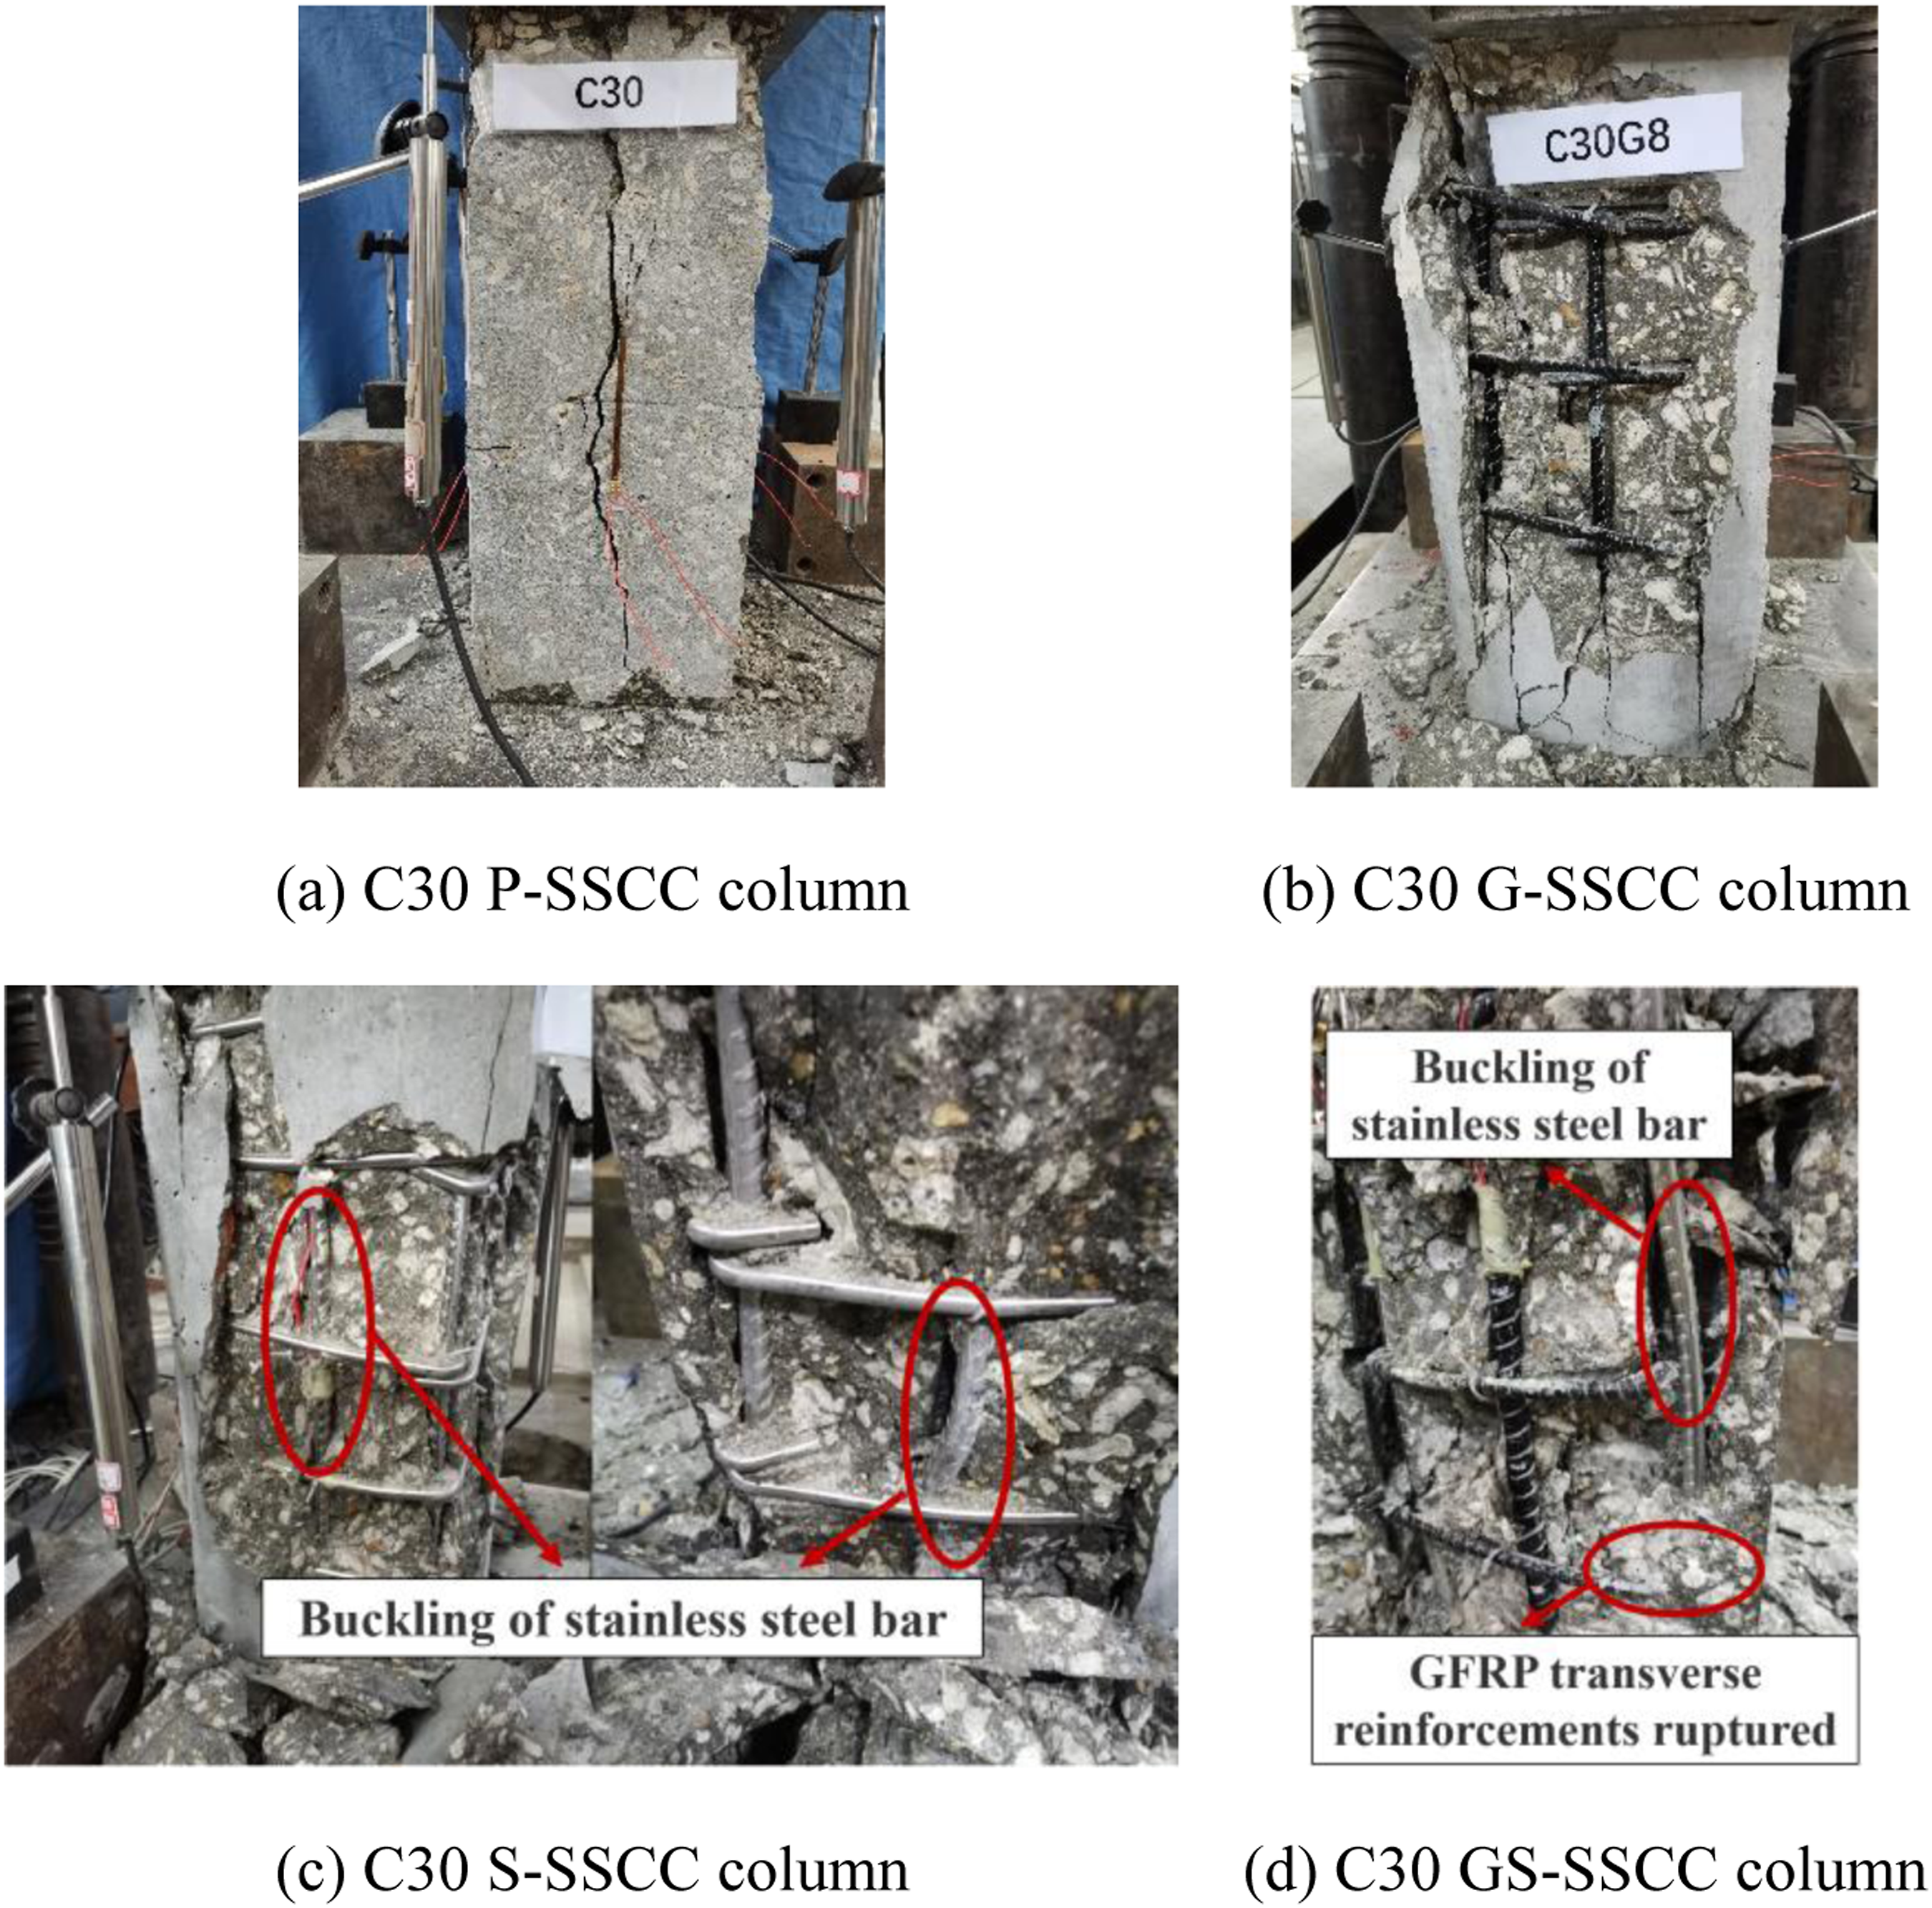
P-SSCC columns
Figure 8(a) shows the failure mode of P-SSCC columns. Initially, the column does not exhibit any noticeable changes during the application of load. However, as the load increases, the relationship between load and displacement begins to exhibit nonlinear growth. Cracks start to emerge at the corners, middle, and edges of the column when the loads reach 75%–90% of their peak values. Before reaching the peak point, there are no significant indications, but once the peak point is reached, a noticeable sound is heard along with the sound of concrete being crushed. Following the peak point, there is a sharp decline in the loads, which reduces to less than 30% of the peak load within 5 s after the loading process is stopped. The mode of failure for the P-SSCC column is characterized by shear failure, and the resulting pattern resembles an inverted triangular cone.
G-SSCC columns and S-SSCC columns
Figure 8(b) shows the failure mode of G-SSCC columns. The failure process consists of two phases: the elastic phase and the plastic phase. Initially, the column does not experience any significant changes during the loading process. As the load approaches 75% of the peak value, cracks begin to emerge at the corners and edges of the column. After this point, the column transitions from elastic phase to plastic phase, and fine cracks begin to form within the concrete. Upon reaching the peak load, the concrete cover begins to gradually separate and peel away. The restraint provided by the GFRP longitudinal bars diminishes, and a “bang” sound is heard within the column. This could possibly be attributed to the shearing of transverse reinforcements or the buckling of GFRP longitudinal bars at specific locations. Owing to the inadequate restraint of transverse reinforcements on longitudinal bars and the low stiffness of GFRP bars, the longitudinal bars exhibit noticeable buckling. This results in damage to the column’s protective layer, splashing of the protective layer, and further buckling of the longitudinal bars. Cracks in the core concrete develop due to the rapid increase of load and the loss of restraint from the concrete cover. The column fails when these cracks extend fully, reaching the ultimate axial load carrying capacity.
Figure 8(c) shows the failure mode of S-SSCC columns. Due to the excellent ductility of stainless steel bars, the failure process can be categorized into three phases: the elastic phases, the elastic-plastic phases, and the failure phase. Because the load is small initially, both concrete and stainless steel bars are in the elastic working phase. When the load increases to 75%–90% of the peak loads, cracks start to emerge at the edges, corners and middle of the column. The specimen starts to experience plastic deformation and subsequently transitions into the elastic-plastic phase. Close to the peak point, concrete deformation and the splashing of the concrete cover can be observed. Following this, the specimen continues to experience the load until it reaches 20%–30% of the peak load. The ultimate damage includes the yielding of longitudinal bars and transverse reinforcements, as well as the crushing of the core concrete.
GS-SSCC columns
Figure 8(d) shows the failure mode of GS-SSCC columns. The failure process for GS-SSCC columns resembles that of S-SSCC columns. Upon reaching the peak load, buckling of longitudinal bars and shear failure of transverse reinforcements occur because GFRP bars have a lower elastic modulus and are positioned at the face center where the concrete cover is thinner compared to the corner. Nevertheless, the presence of stainless steel bars allows for the gradual release of residual stress, thereby preventing brittle failure. Therefore, compared to P-SSCC columns, GS-SSCC columns not only have high axial load carrying capacity but also exhibits good ductility.
Comparative analysis of axial load carrying capacity
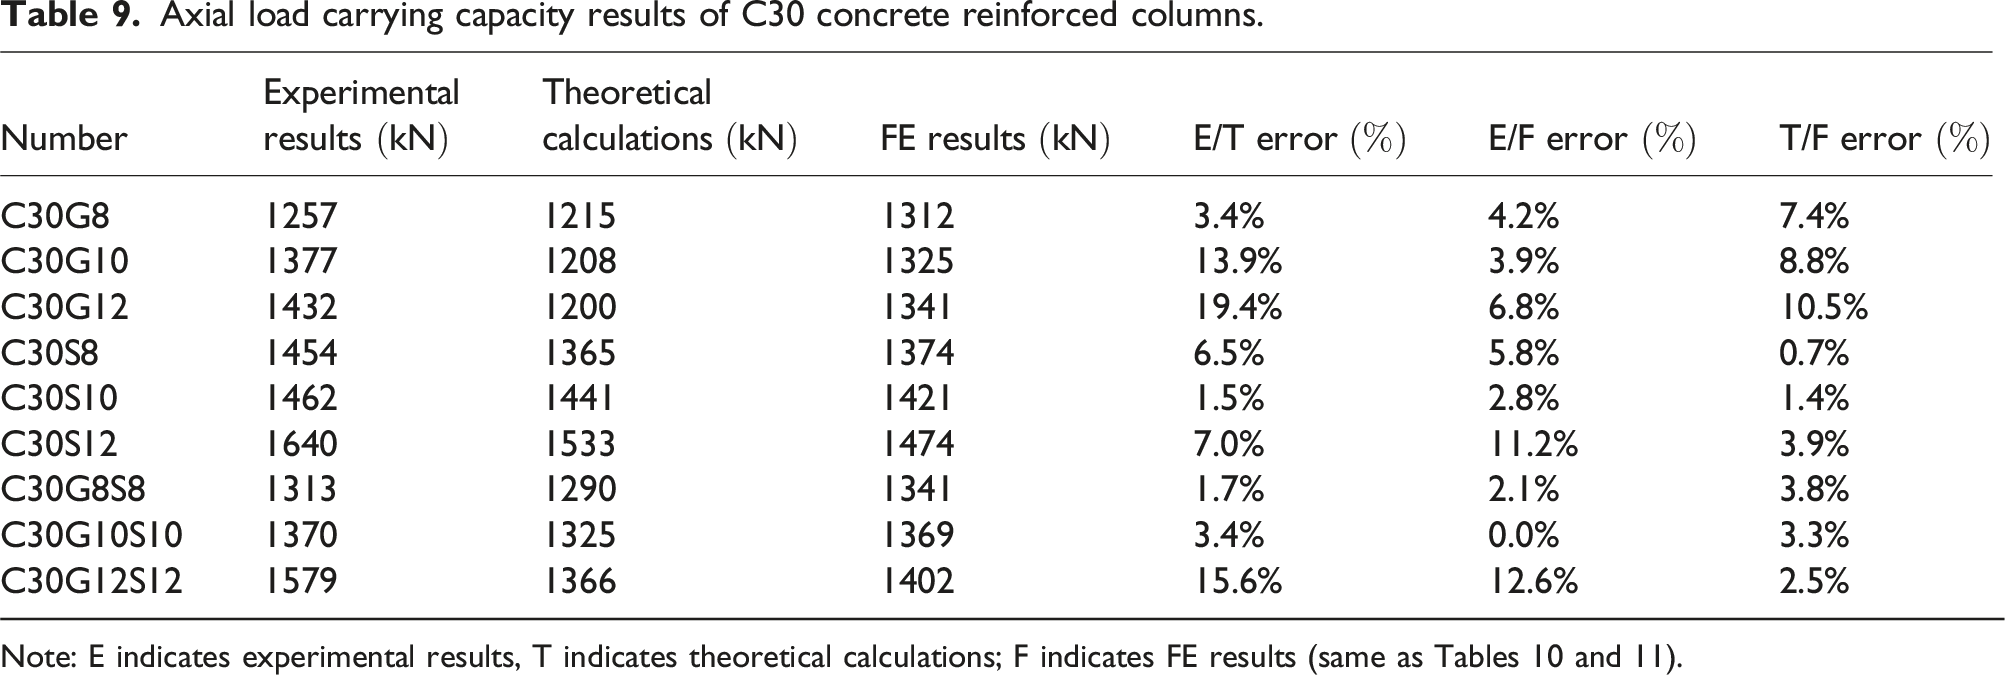
Axial load carrying capacity results of C30 concrete reinforced columns.
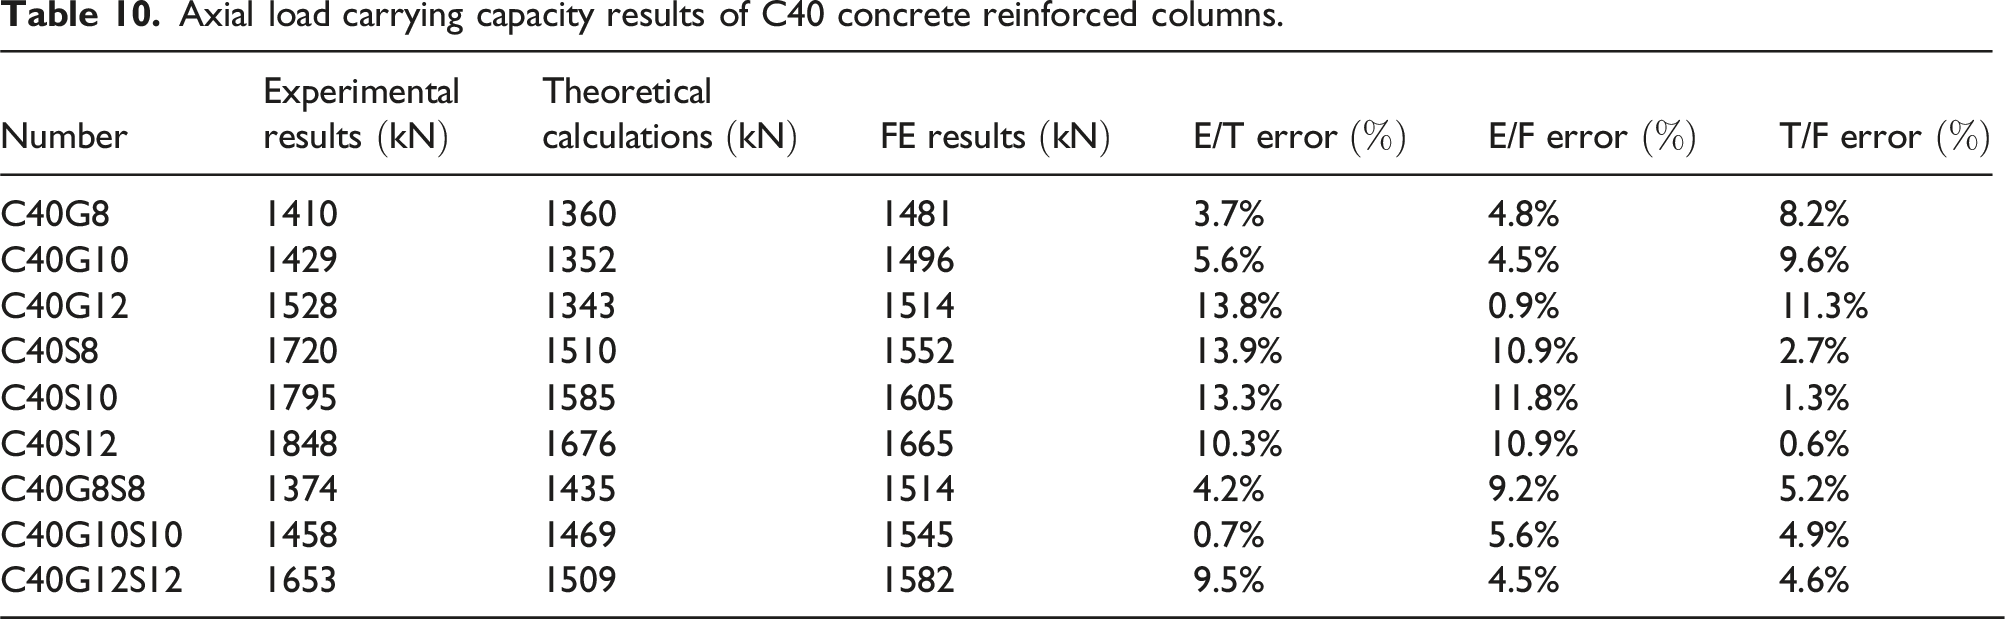
Axial load carrying capacity results of C40 concrete reinforced columns.
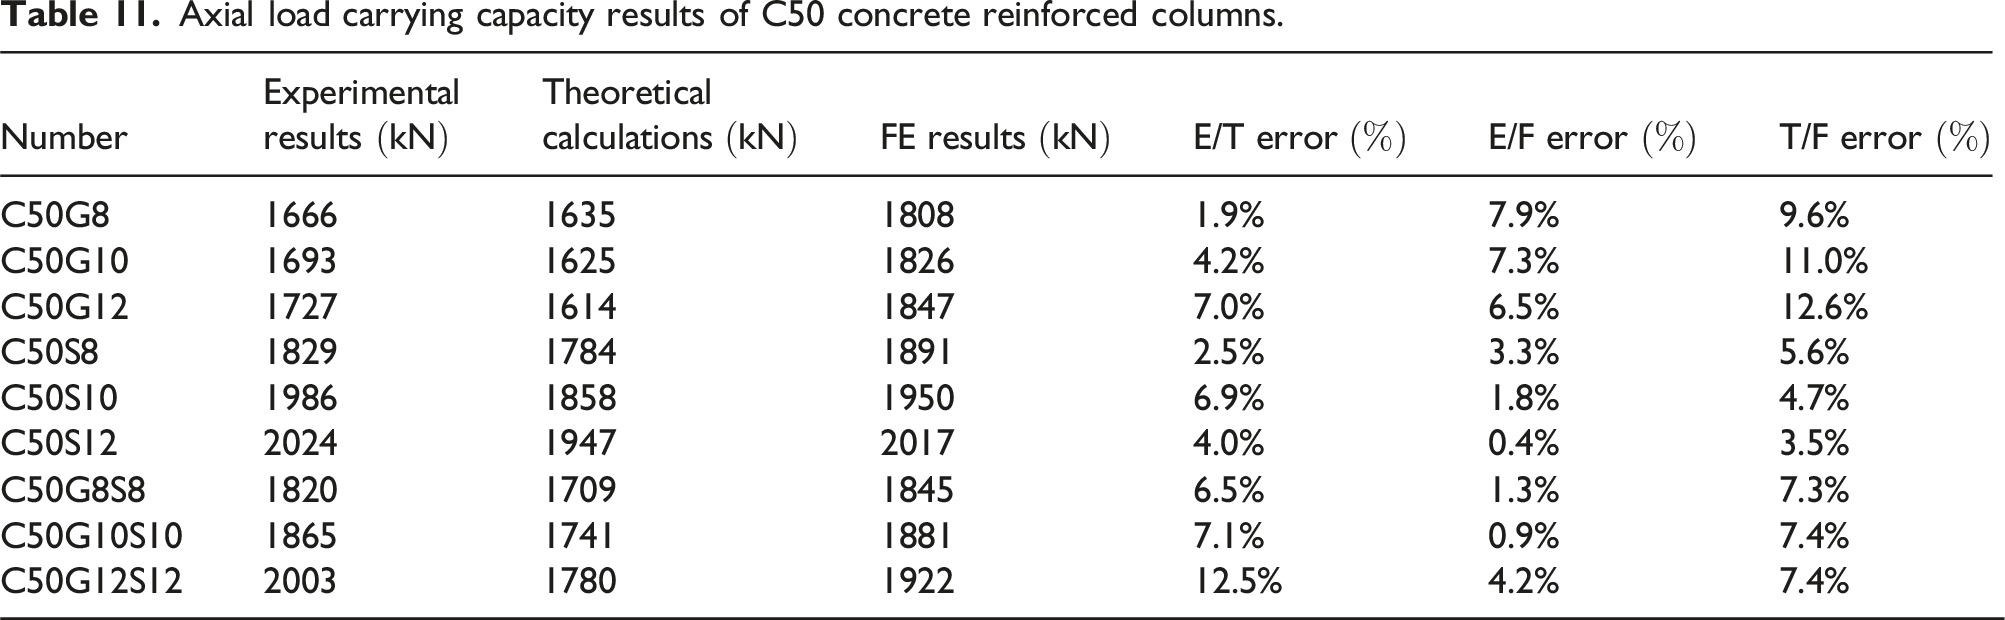
Axial load carrying capacity results of C50 concrete reinforced columns.
Result error of different strength grades (a) C30 concrete (b) C40 concrete (c) C50 concrete.
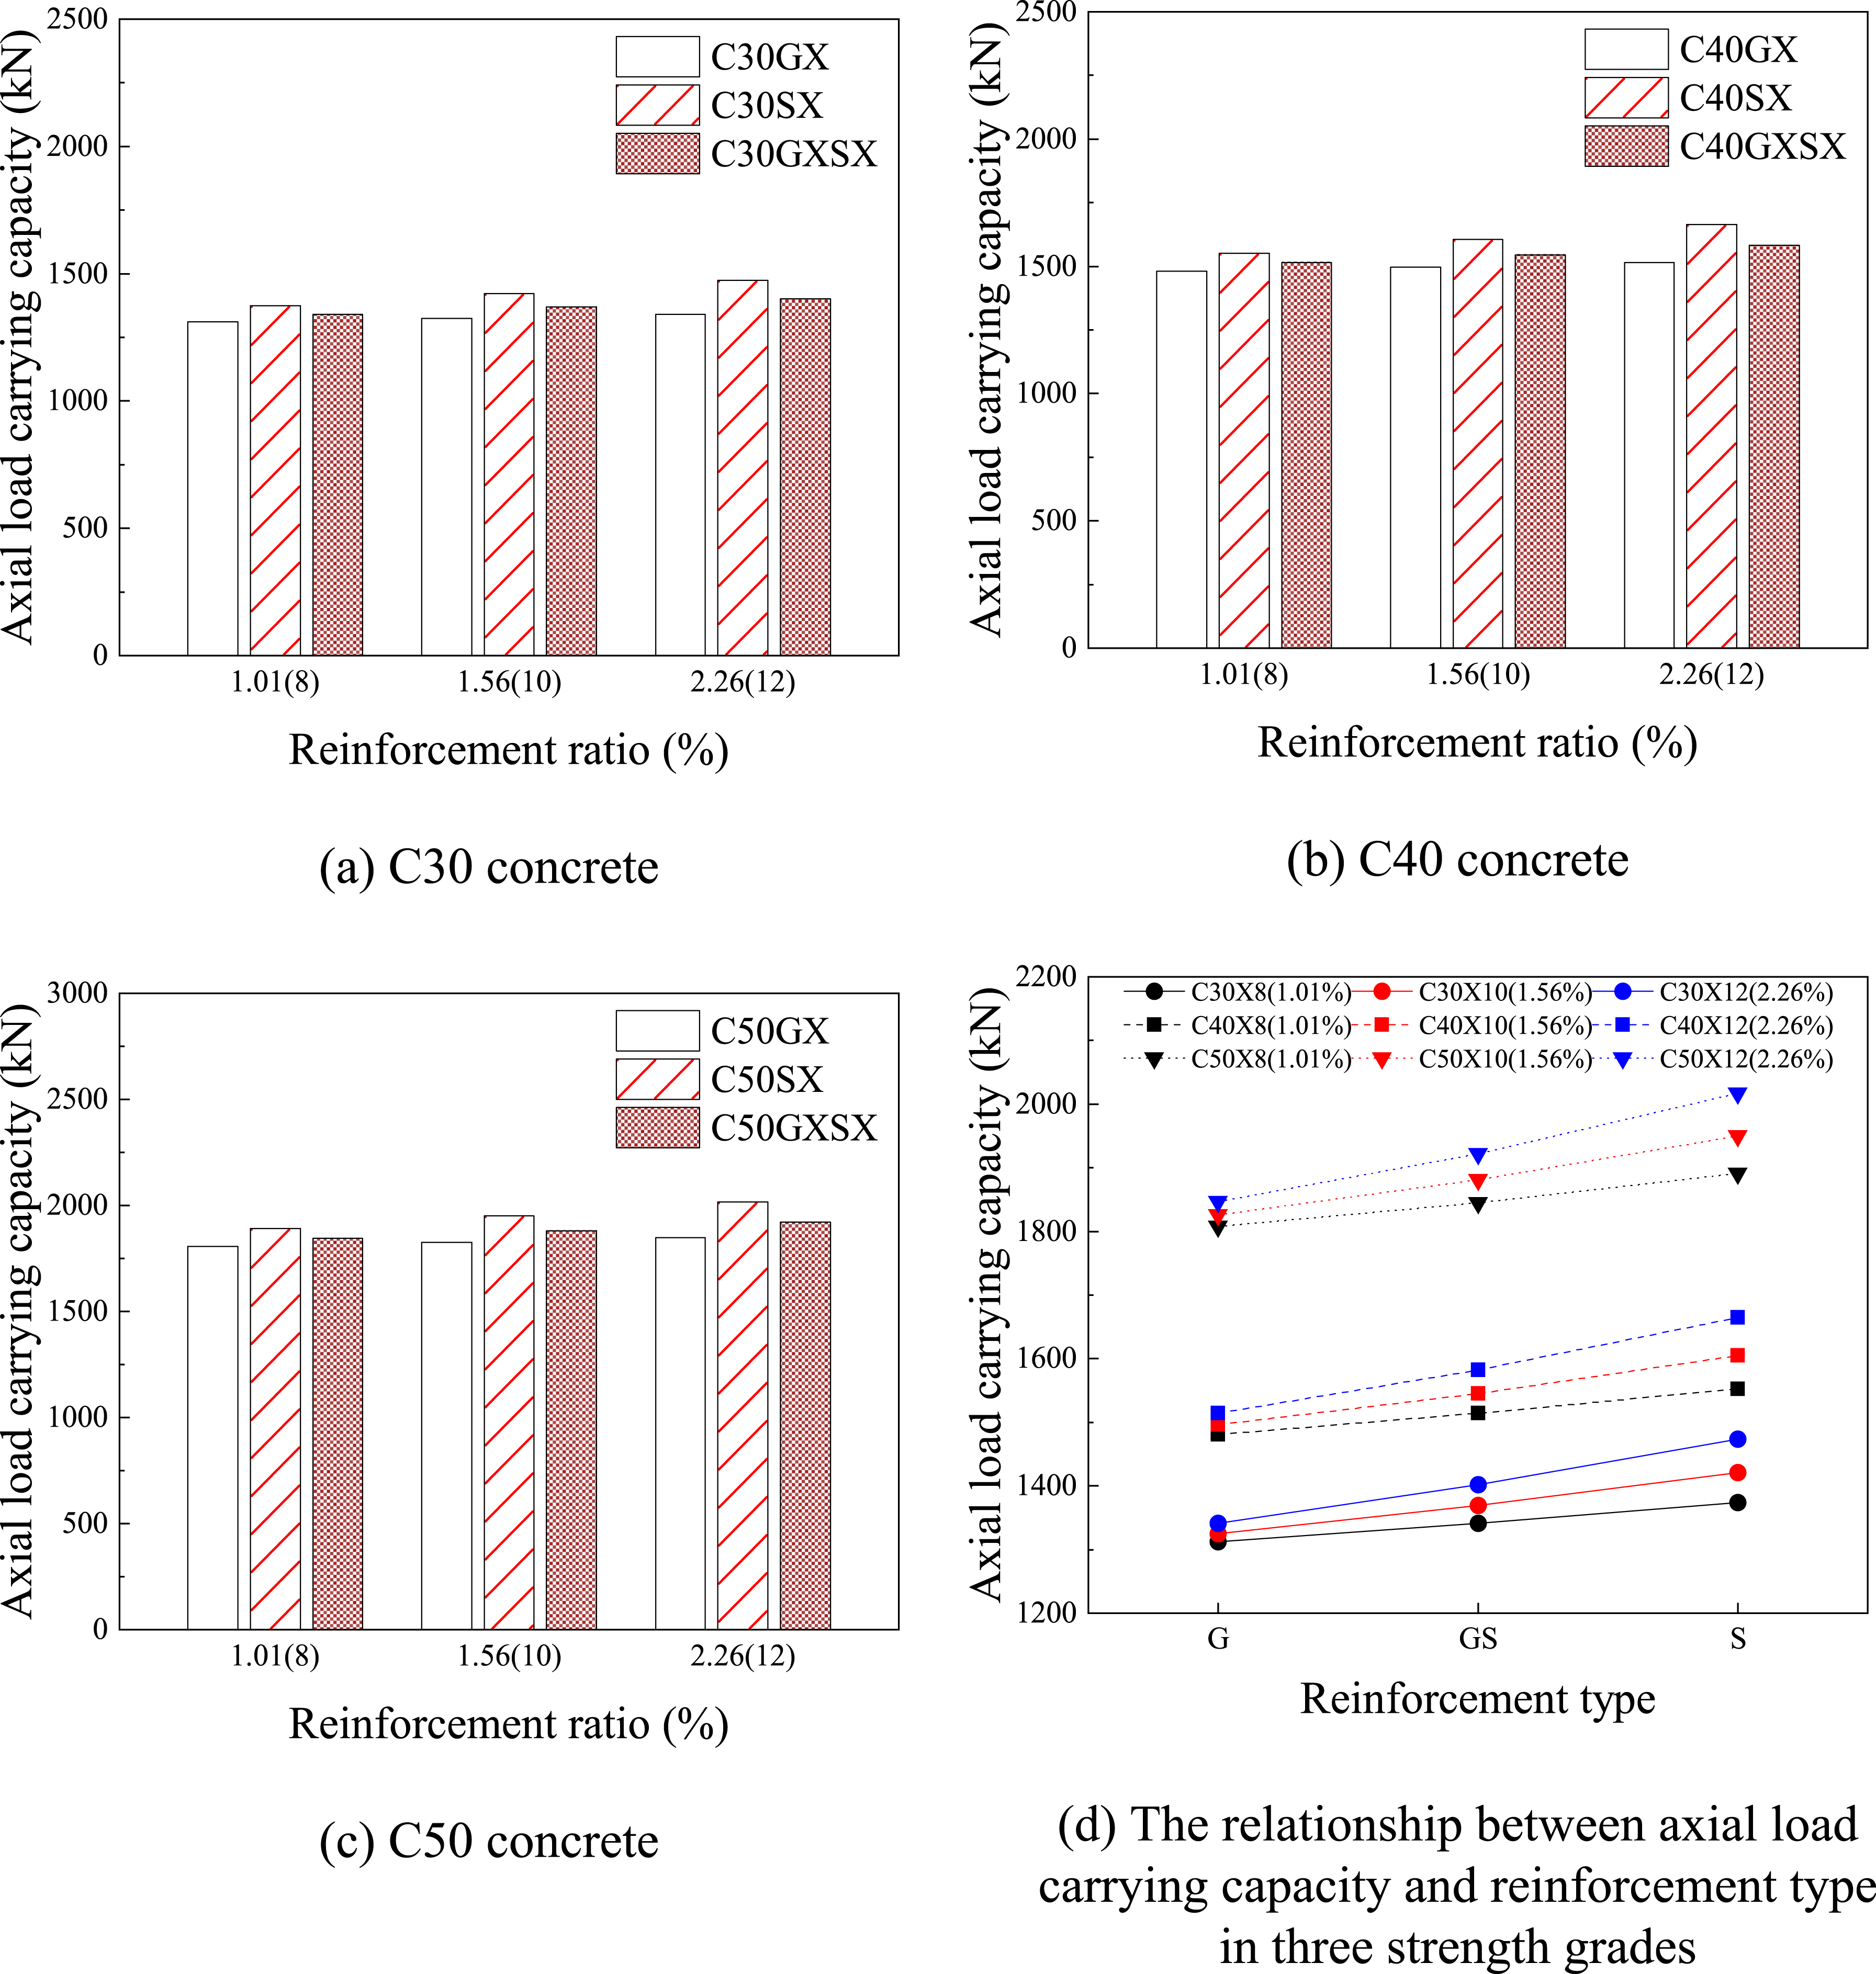
Effect on the reinforcement type of columns
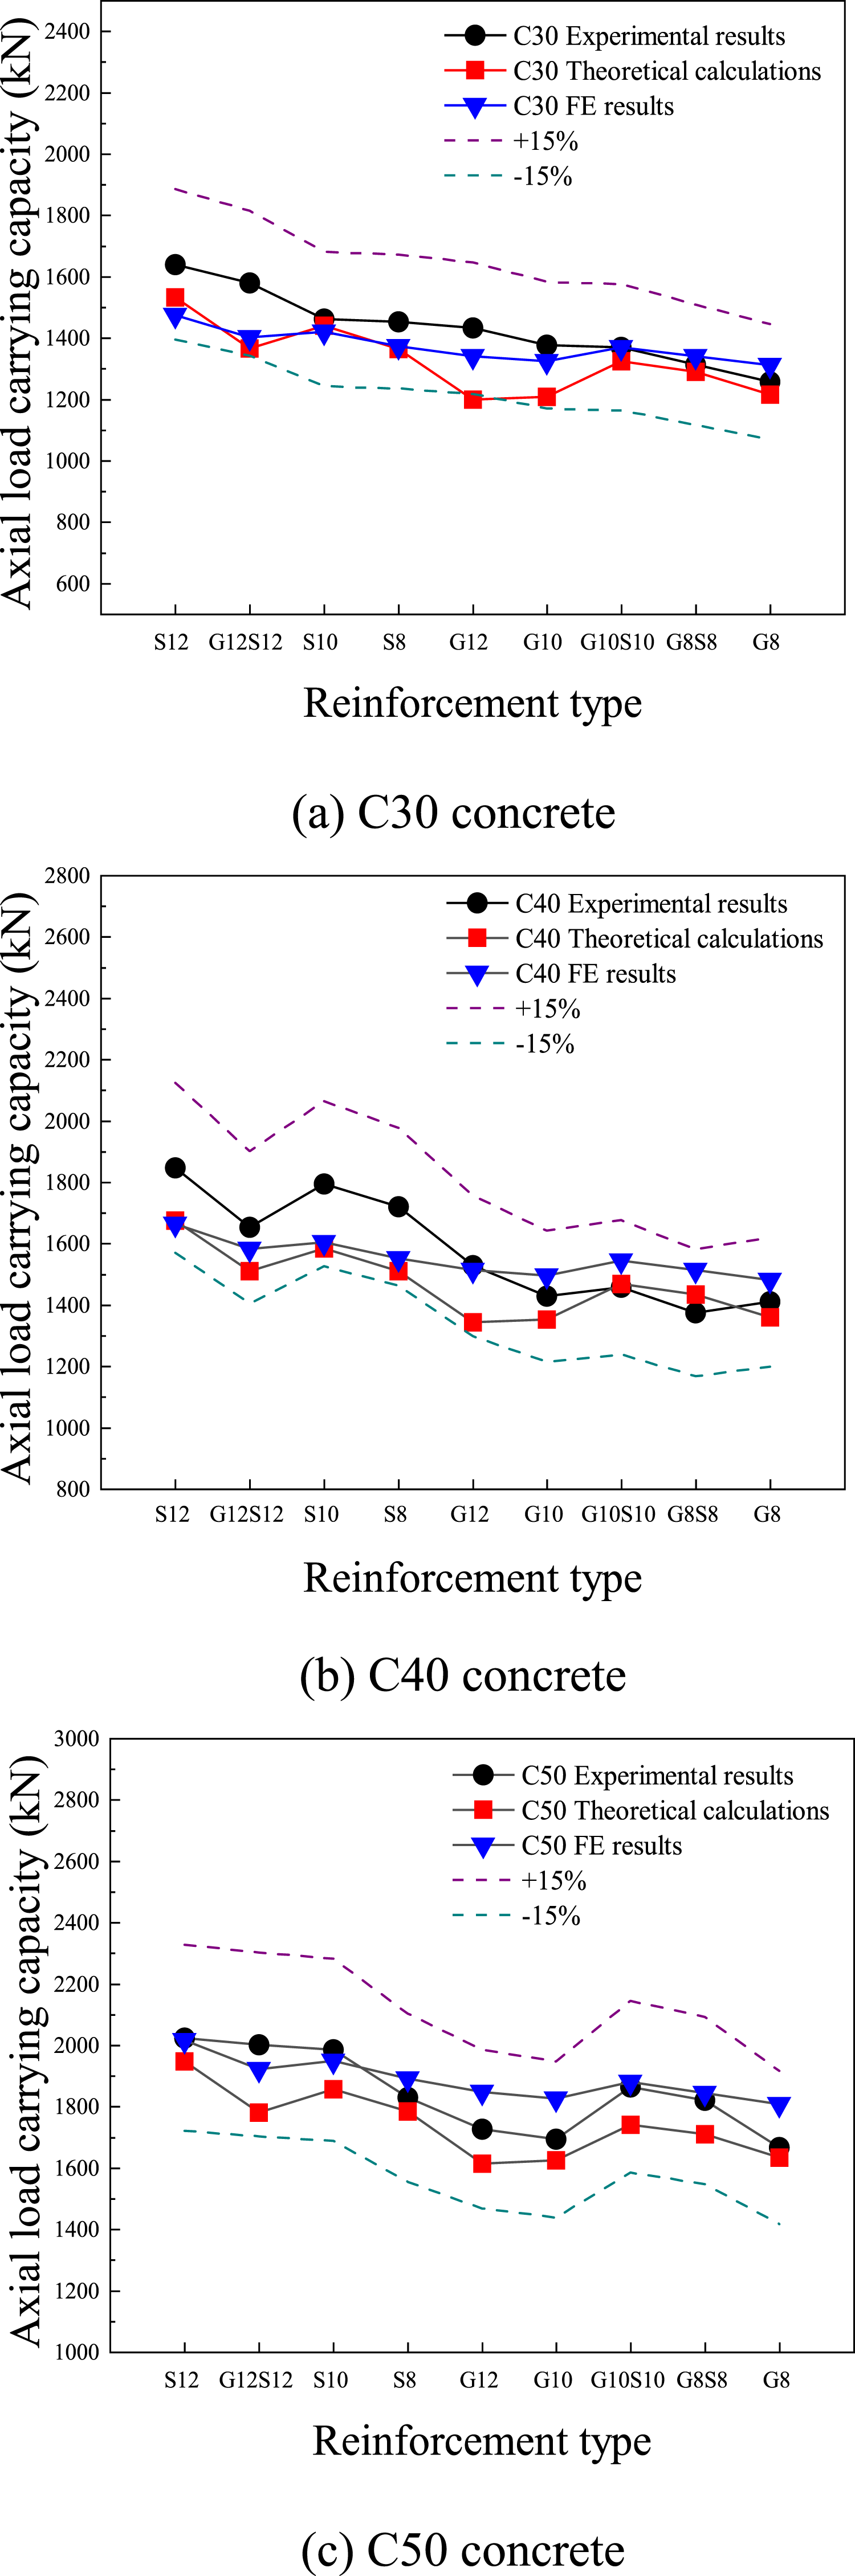
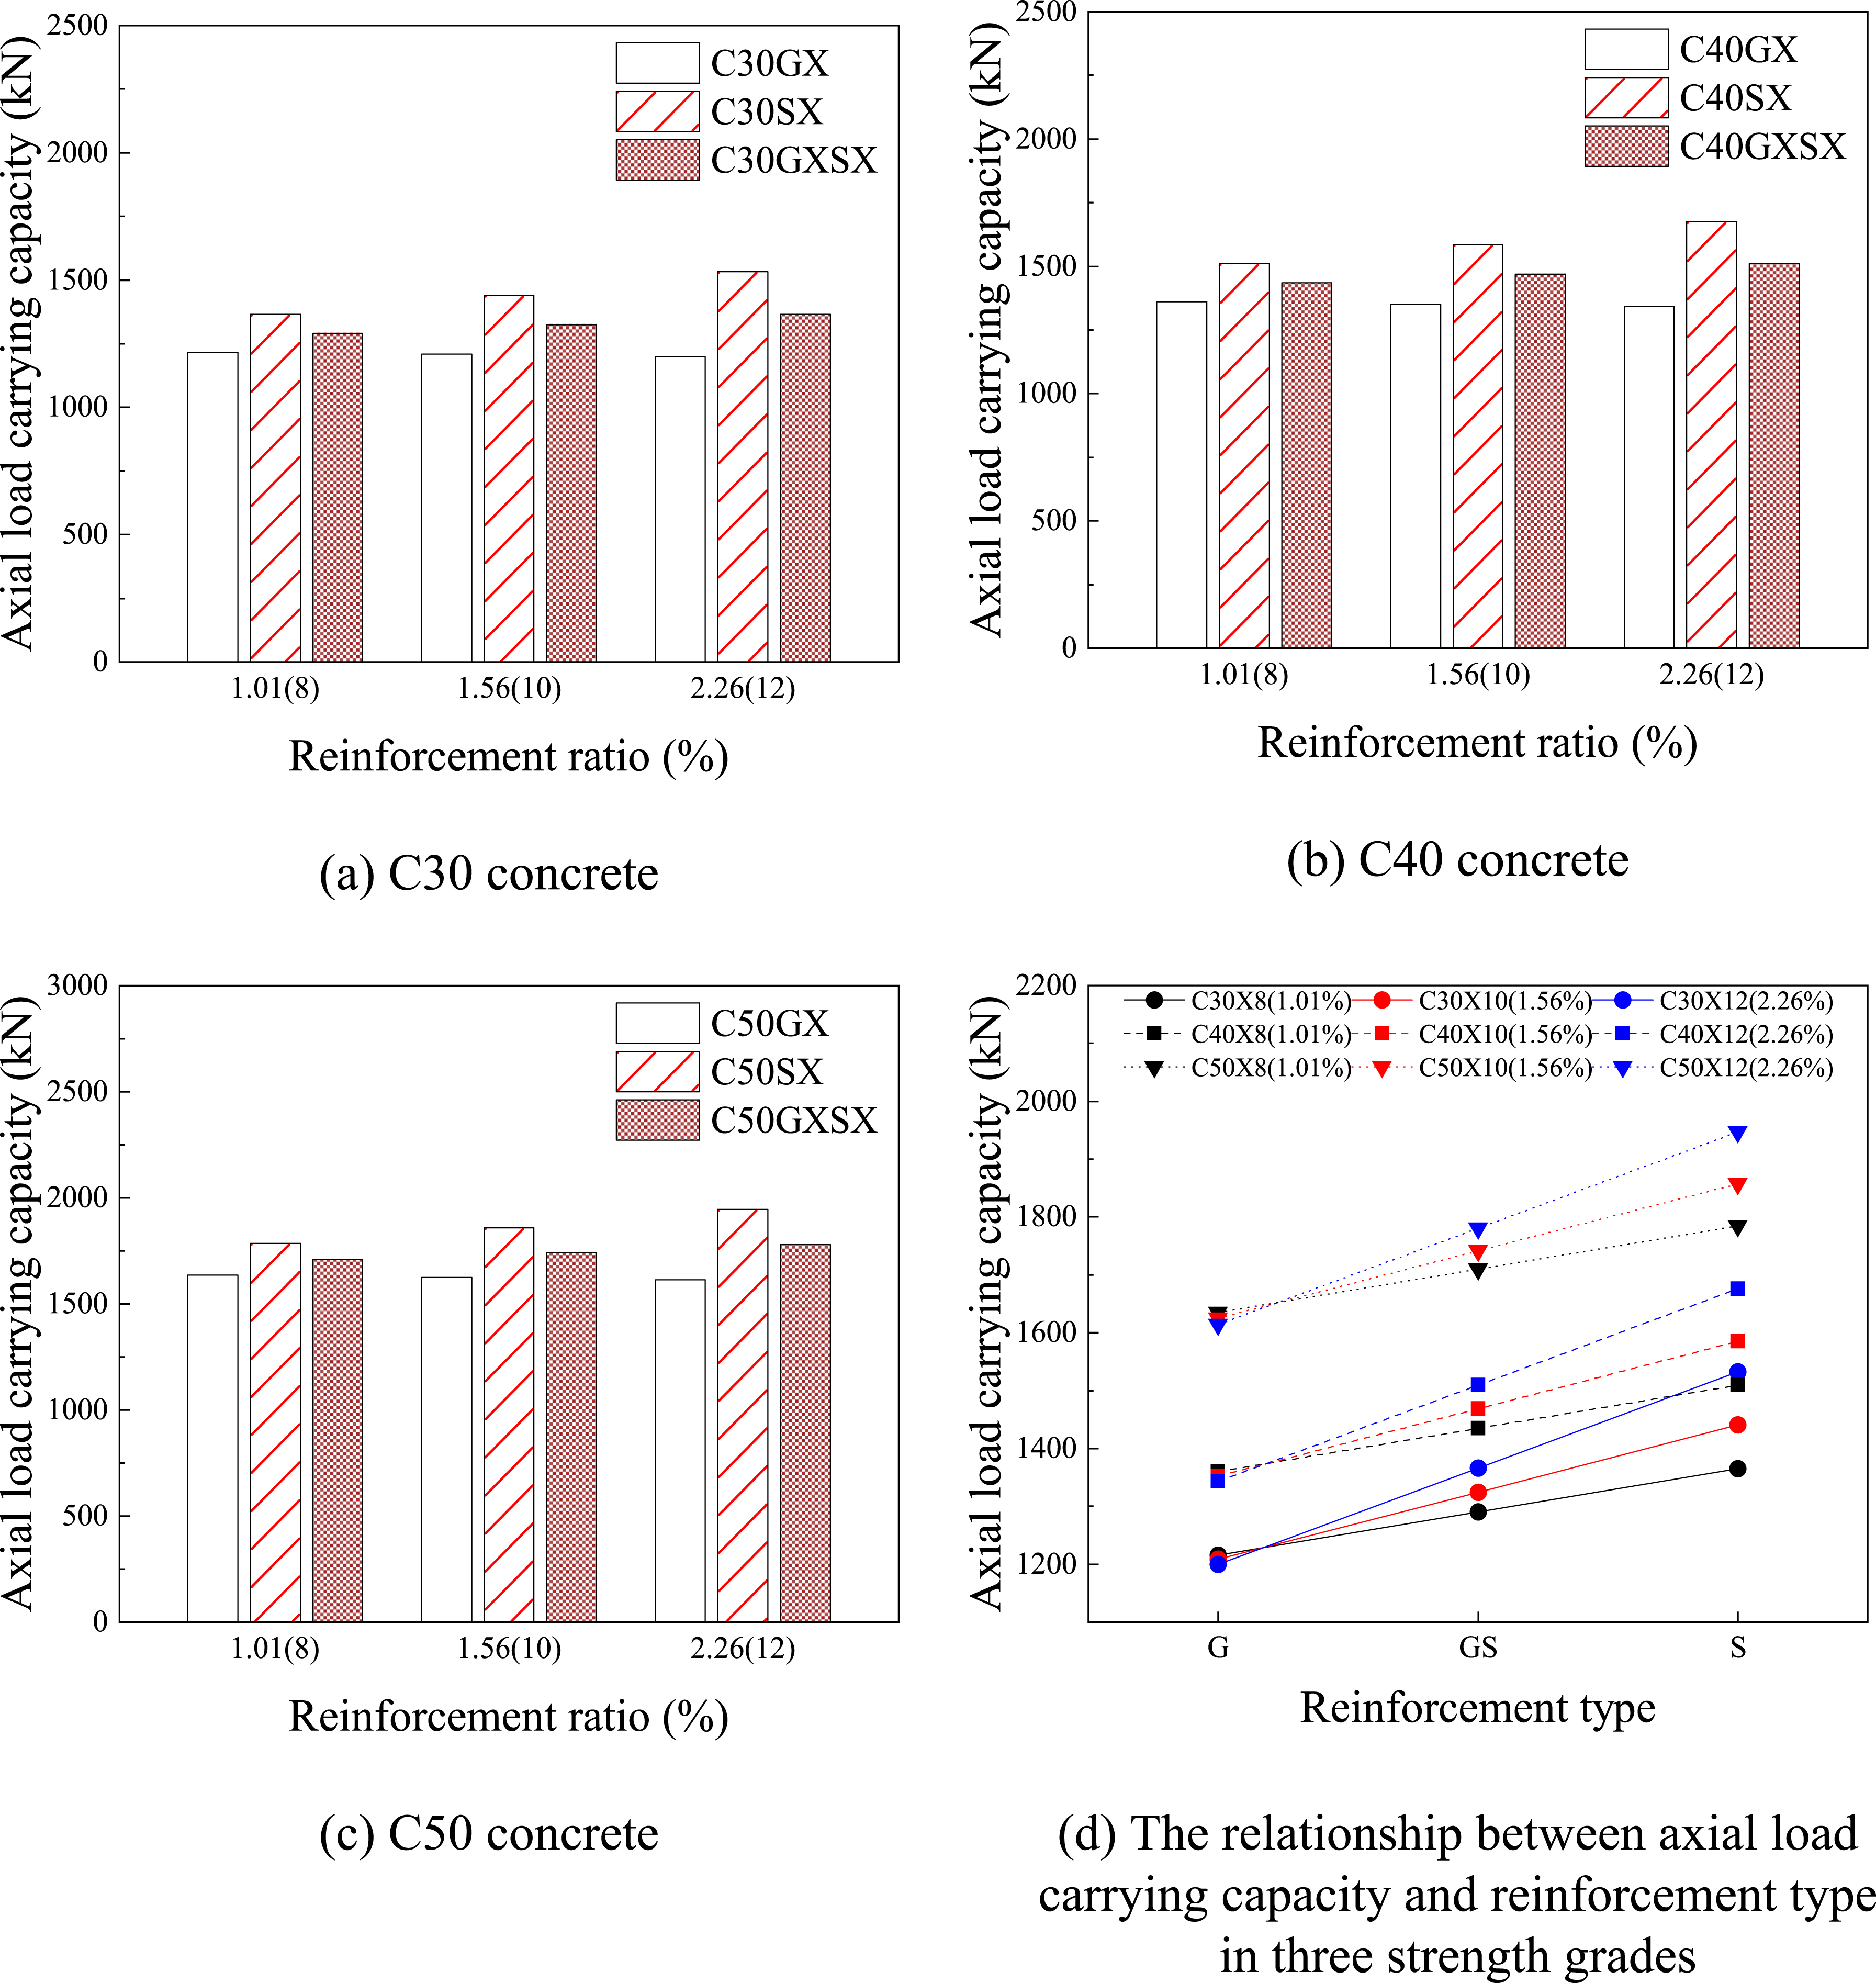
The relationships between axial load carrying capacity and the reinforcement type obtained from experimental study, theoretical analysis, and FE simulation are shown in Figures 10–12. These figures illustrate the influence of various reinforcement types on the axial load carrying capacity of members, maintaining consistent strength grade and reinforcement ratio. Across different subgroups, the results show consistent trends. Among the columns, S-SSCC exhibits the highest axial load carrying capacity, with GS-SSCC columns ranking second, and G-SSCC columns showing the lowest. This can primarily be attributed to the superior elastic modulus of stainless steel bars when compared to GFRP bars. In reinforced members, the higher elastic modulus of stainless steel bars compared to GFRP bars result in S-SSCC columns having greater axial load carrying capacity is than G-SSCC columns. In hybrid reinforced members, the elastic modulus lies between that of stainless steel bars and GFRP bars, resulting in axial load carrying capacity that follows the same trend. This trend is confirmed by both theoretical analysis and FE simulation. Experimental results-Effect of reinforcement type on axial load carrying capacity (a) C30 concrete (b) C40 concrete (c) C50 concrete (d) The relationship between axial load carrying capacity and reinforcement type in three strength grades. Theoretical results-Effect of reinforcement type on axial load carrying capacity (a) C30 concrete (b) C40 concrete (c) C50 concrete (d) The relationship between axial load carrying capacity and reinforcement type in three strength grades. FE analysis results-Effect of reinforcement type on axial load carrying capacity (a) C30 concrete (b) C40 concrete (c) C50 concrete (d) The relationship between axial load carrying capacity and reinforcement type in three strength grades.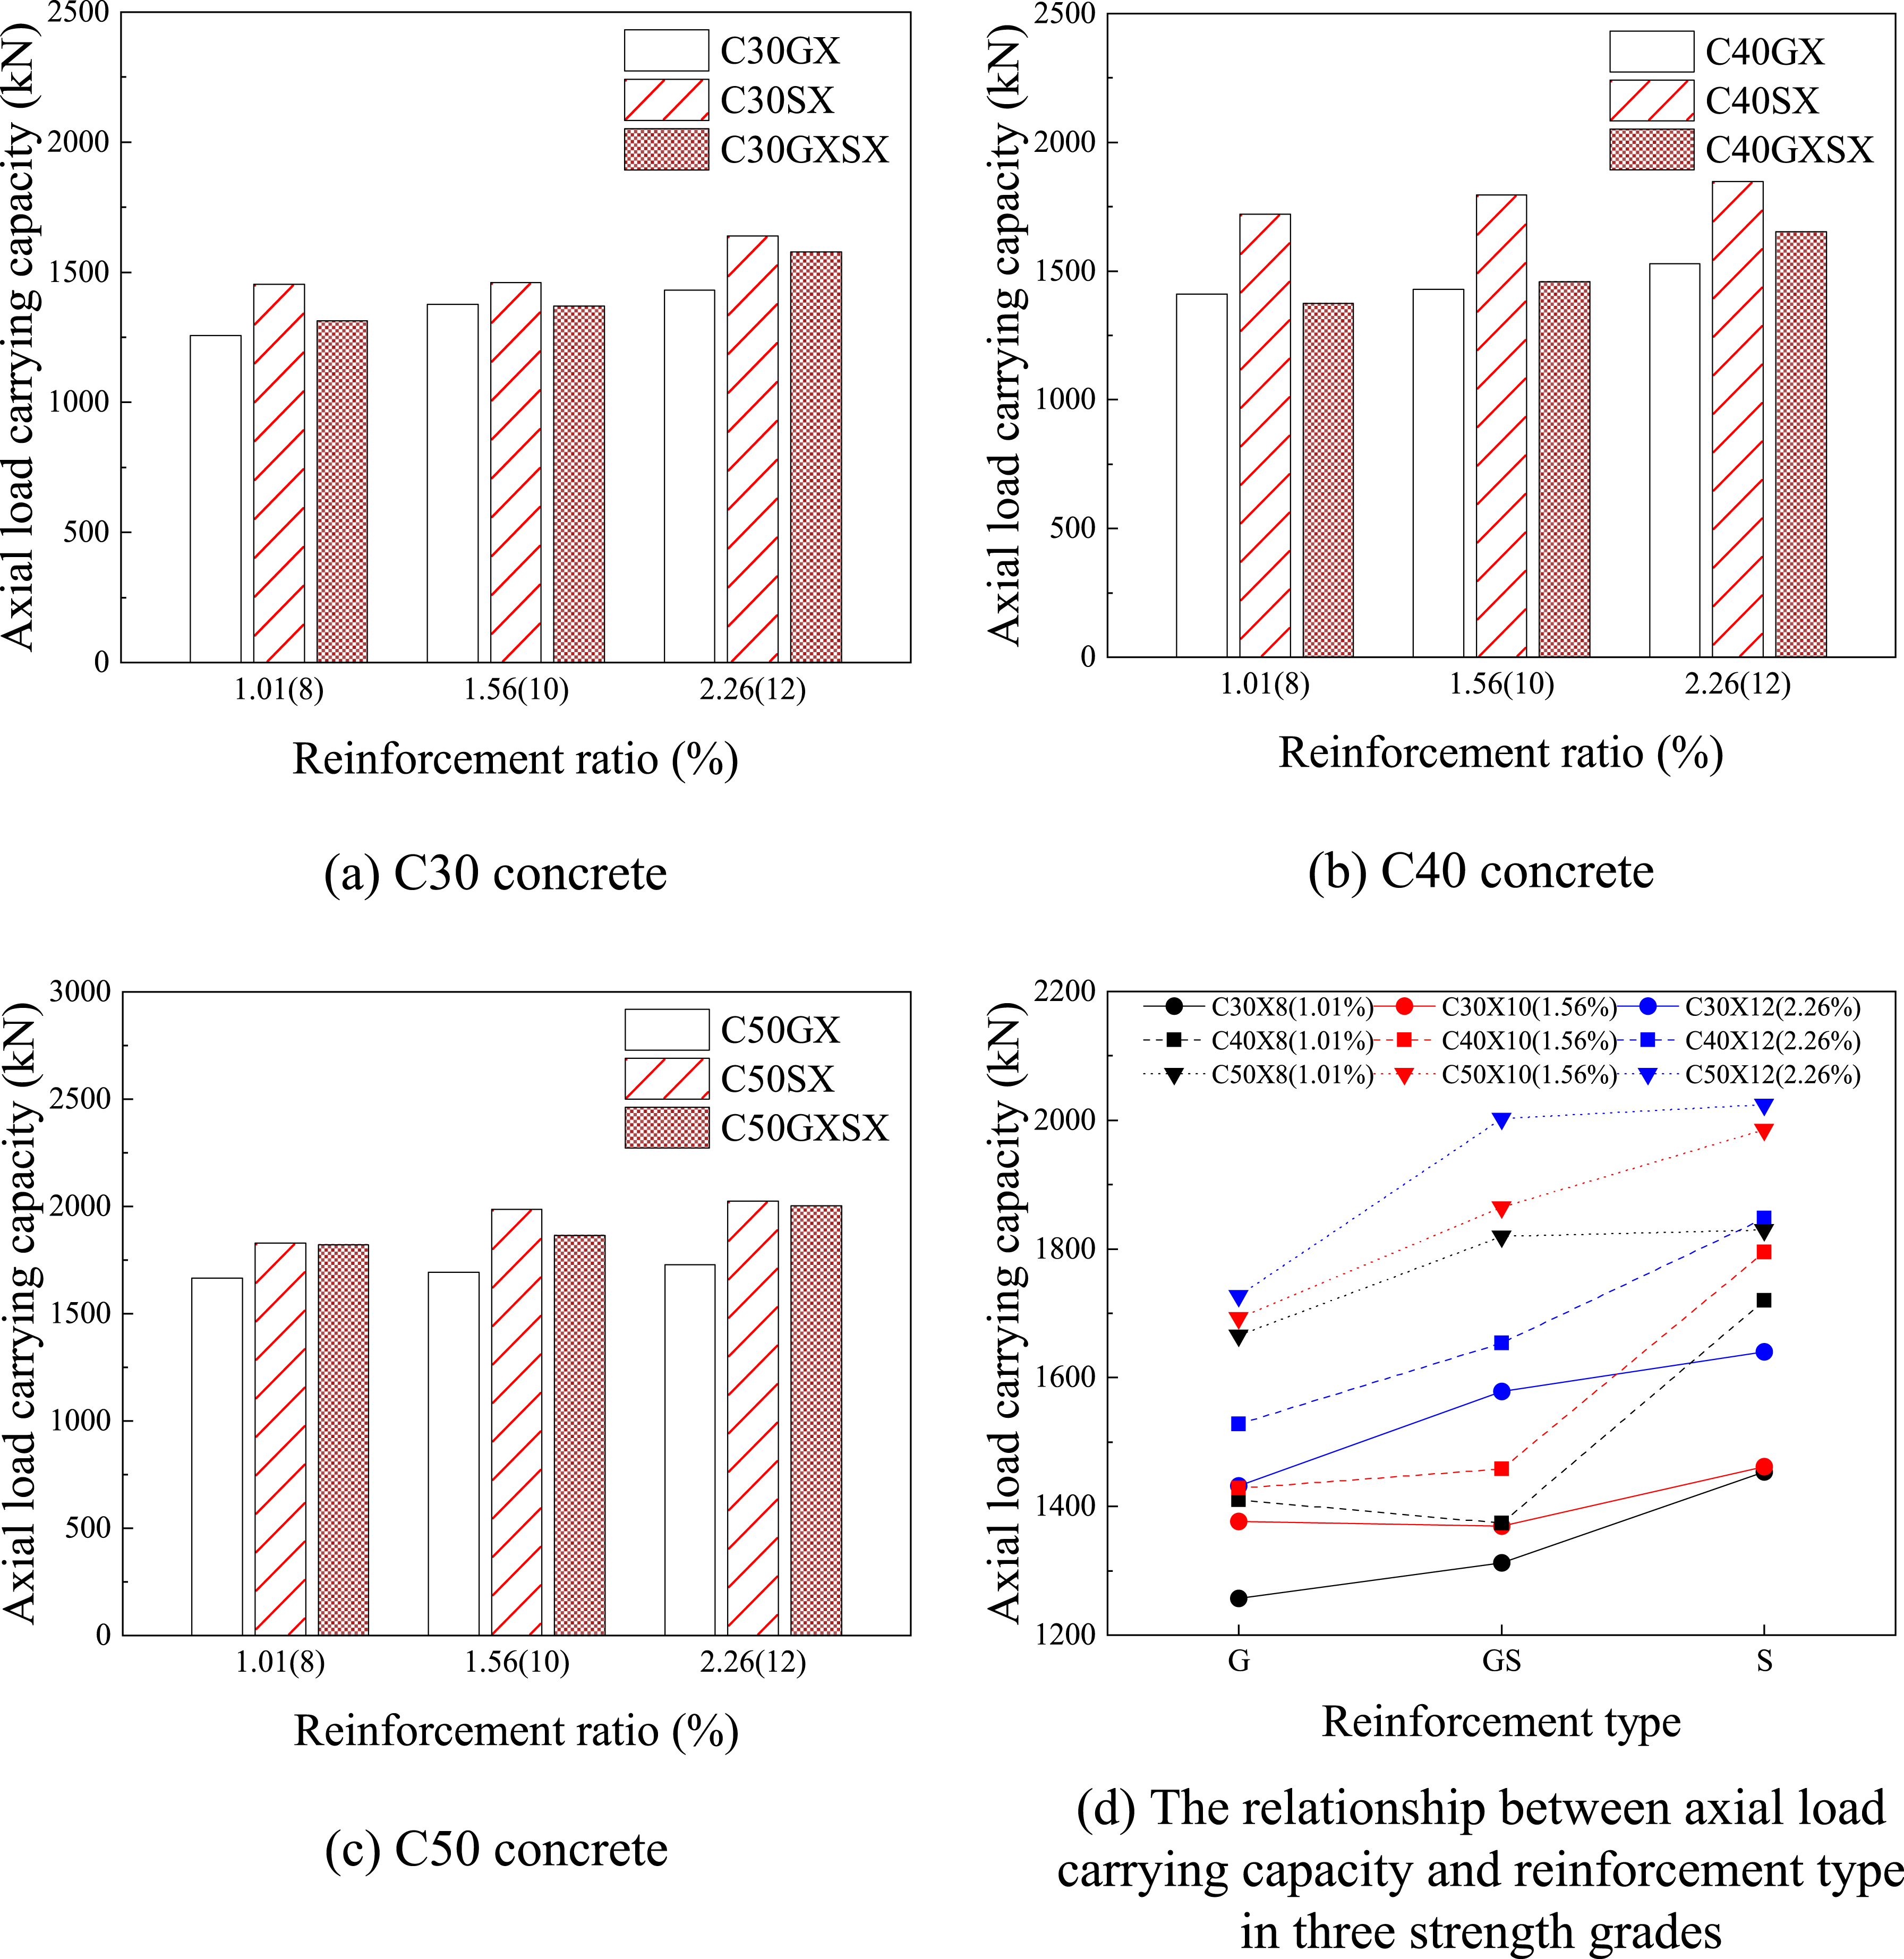
Effect on the reinforcement ratio of columns
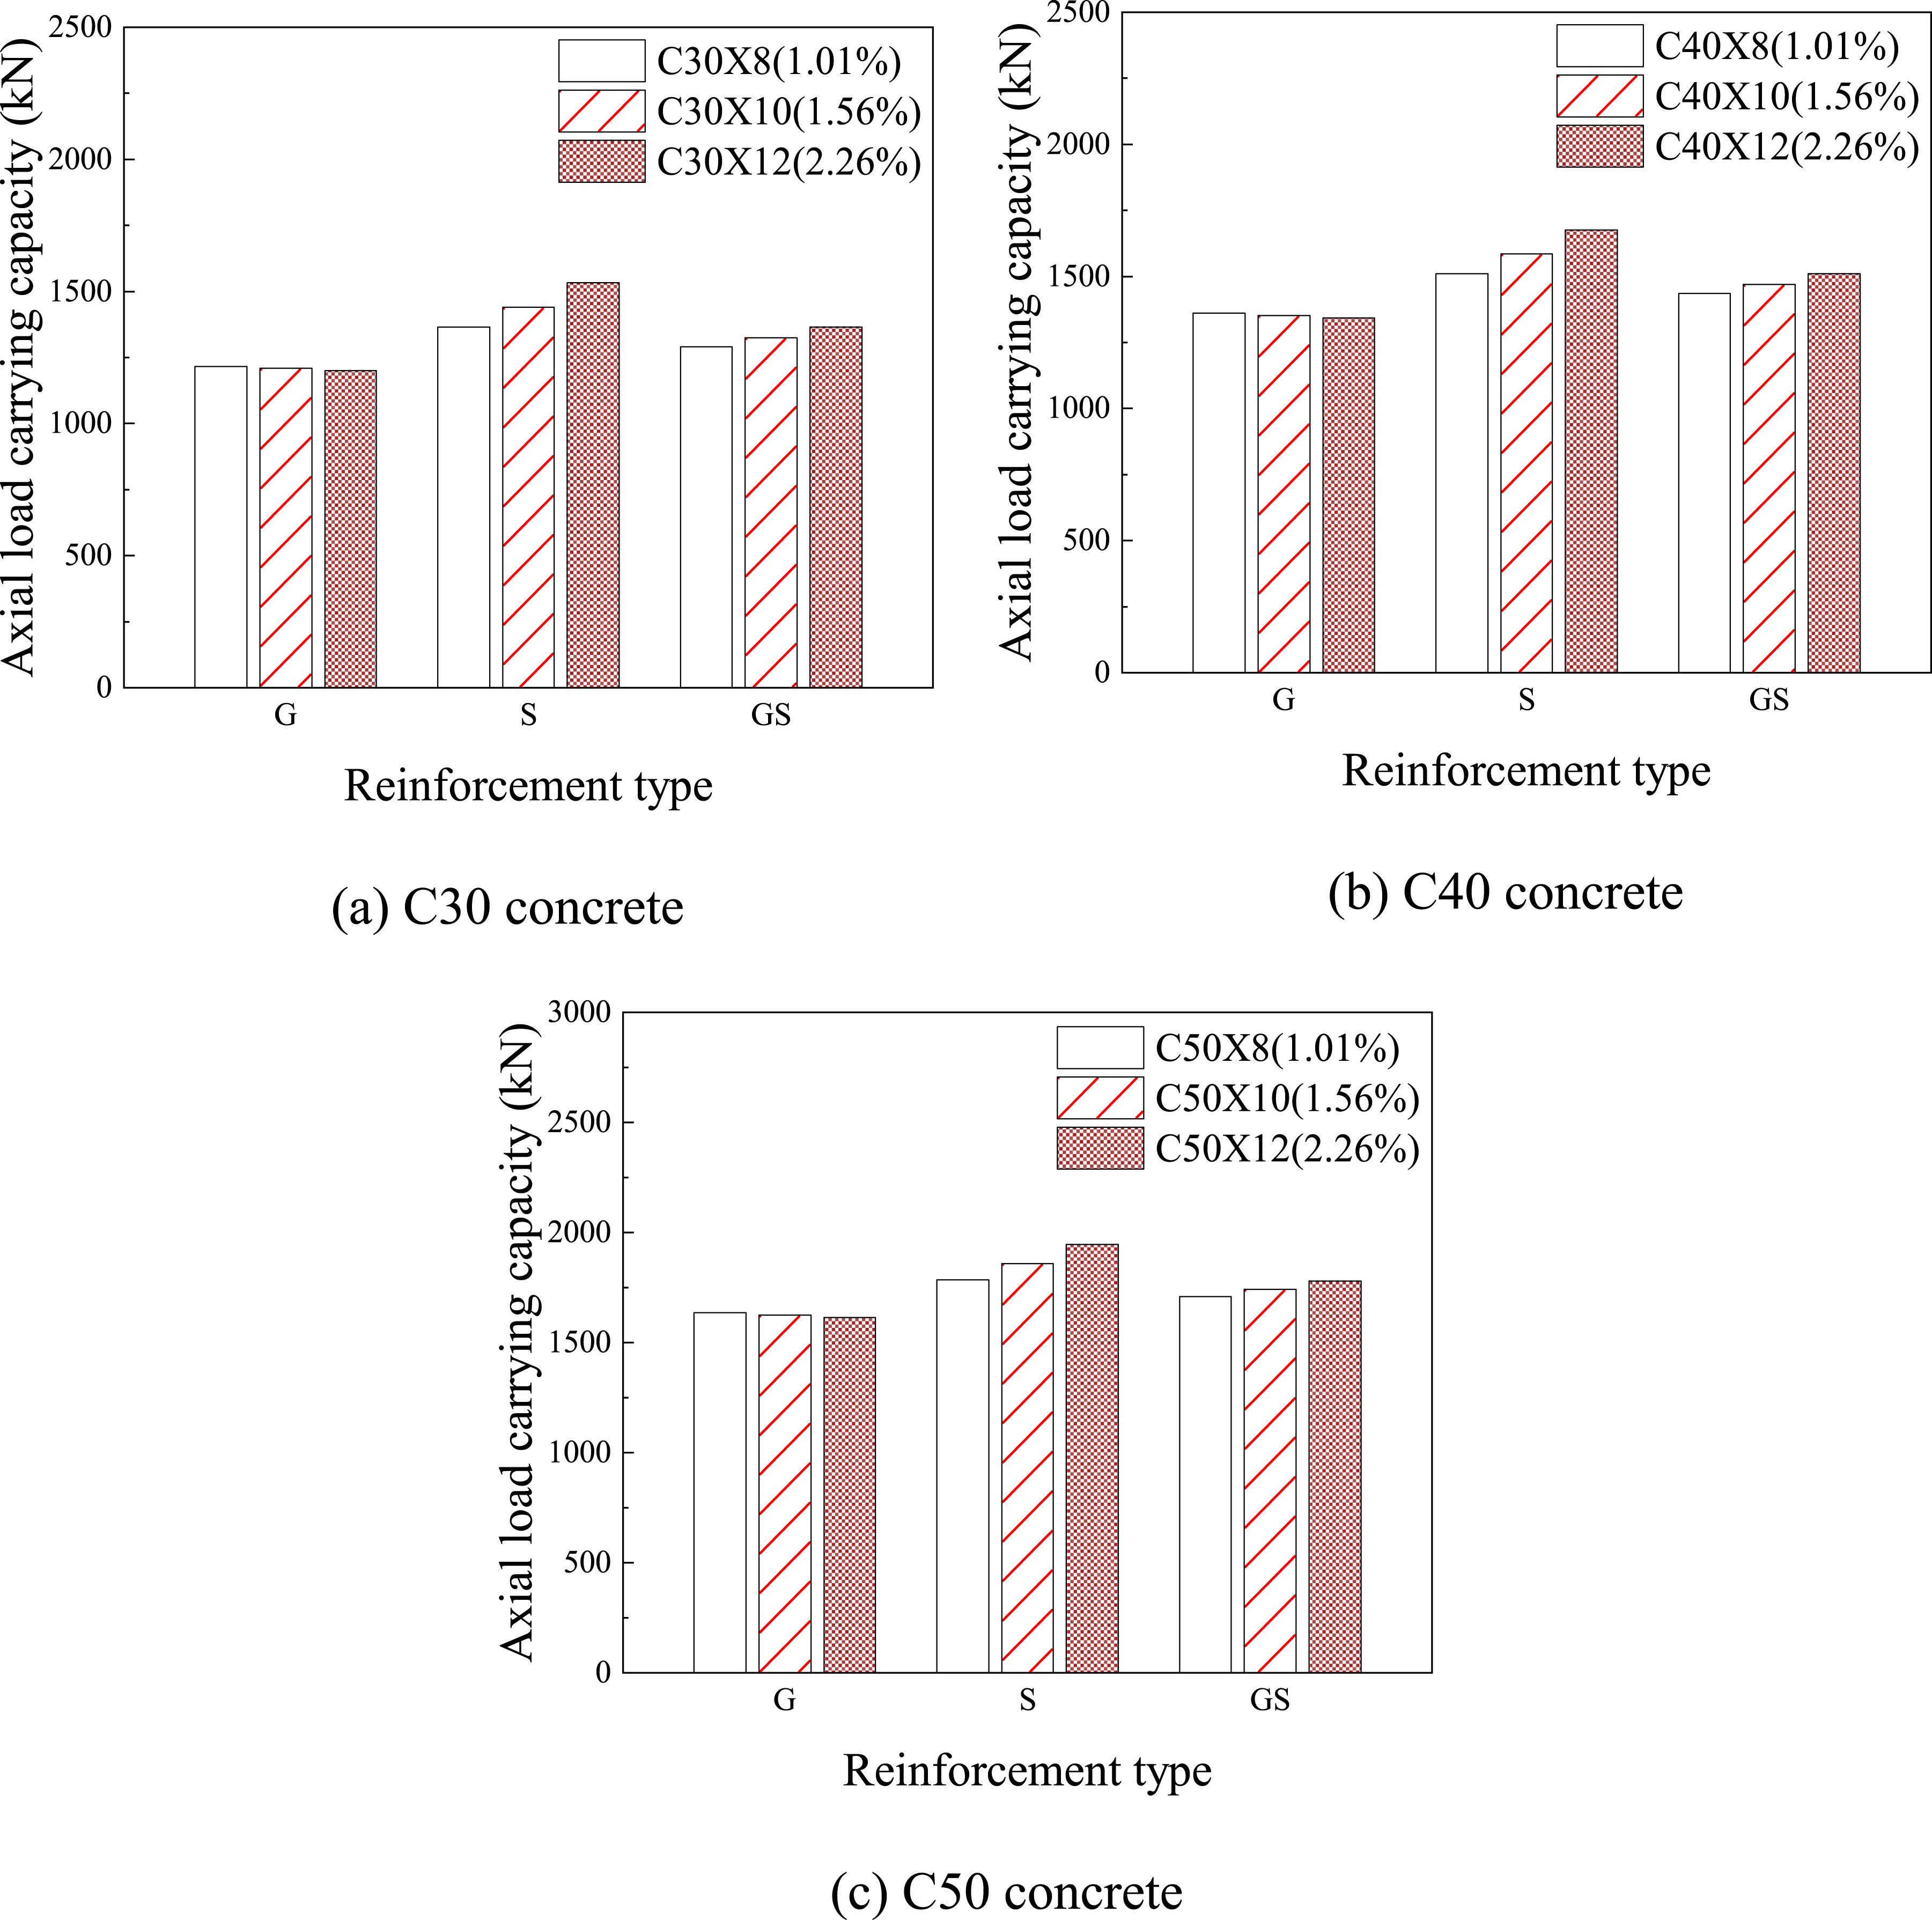
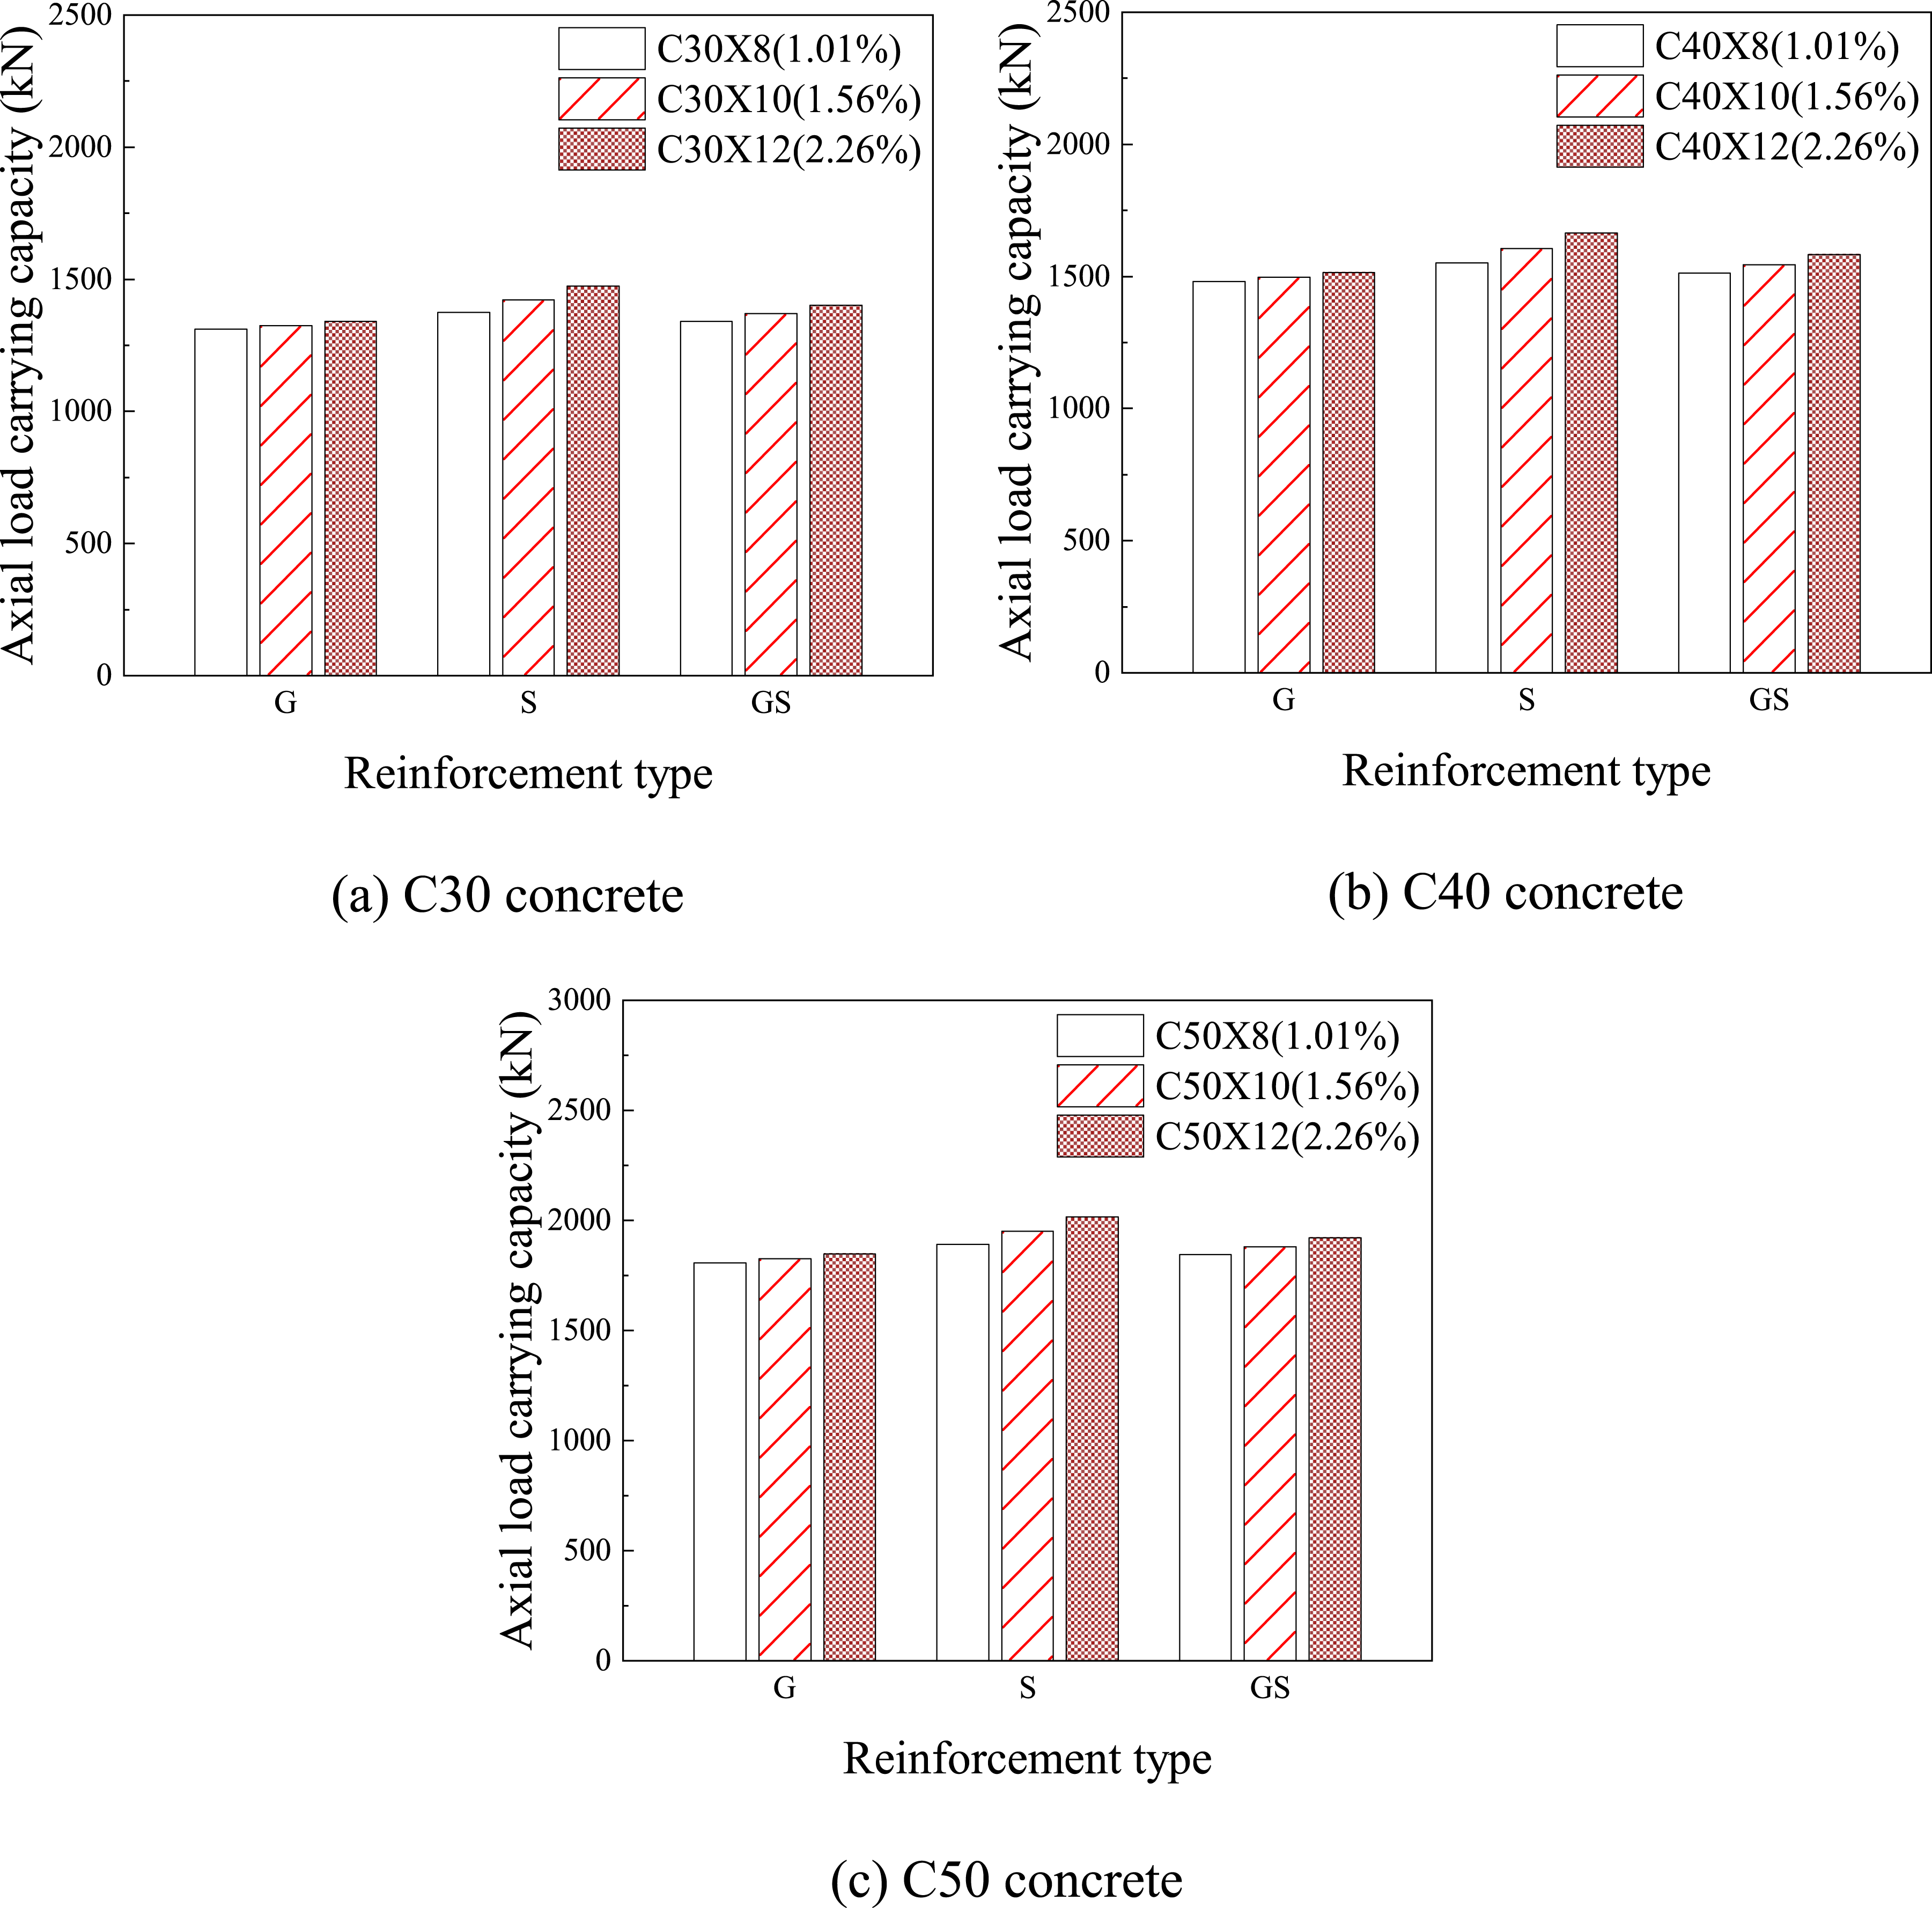
The relationships between axial load carrying capacity and the reinforcement ratio obtained from experimental study, theoretical analysis and FE simulation are shown in Figures 13–15. For the same strength grade and reinforcement type, the axial load carrying capacity increases as the reinforcement ratio increases. For C30 concrete and reinforcement ratios of 1.01%, 1.56%, and 2.26%, the experimental average axial load carrying capacity exceeds that of plain concrete by 10.6%, 16.9%, and 27.1%, respectively. For C40 concrete, the increases are 15.7%, 16.3%, and 24.4%. For C50 concrete, they are 7.5%, 12%, and 17.7%. Similar trends are observed in the theoretical analysis and FE simulations as well. Experimental results-Effect of reinforcement ratio on axial load carrying capacity (a) C30 concrete (b) C40 concrete (c) C50 concrete. Theoretical results-Effect of reinforcement ratio on axial load carrying capacity (a) C30 concrete (b) C40 concrete (c) C50 concrete. Finite element analysis results-Effect of reinforcement ratio on axial load carrying capacity (a) C30 concrete (b) C40 concrete (c) C50 concrete.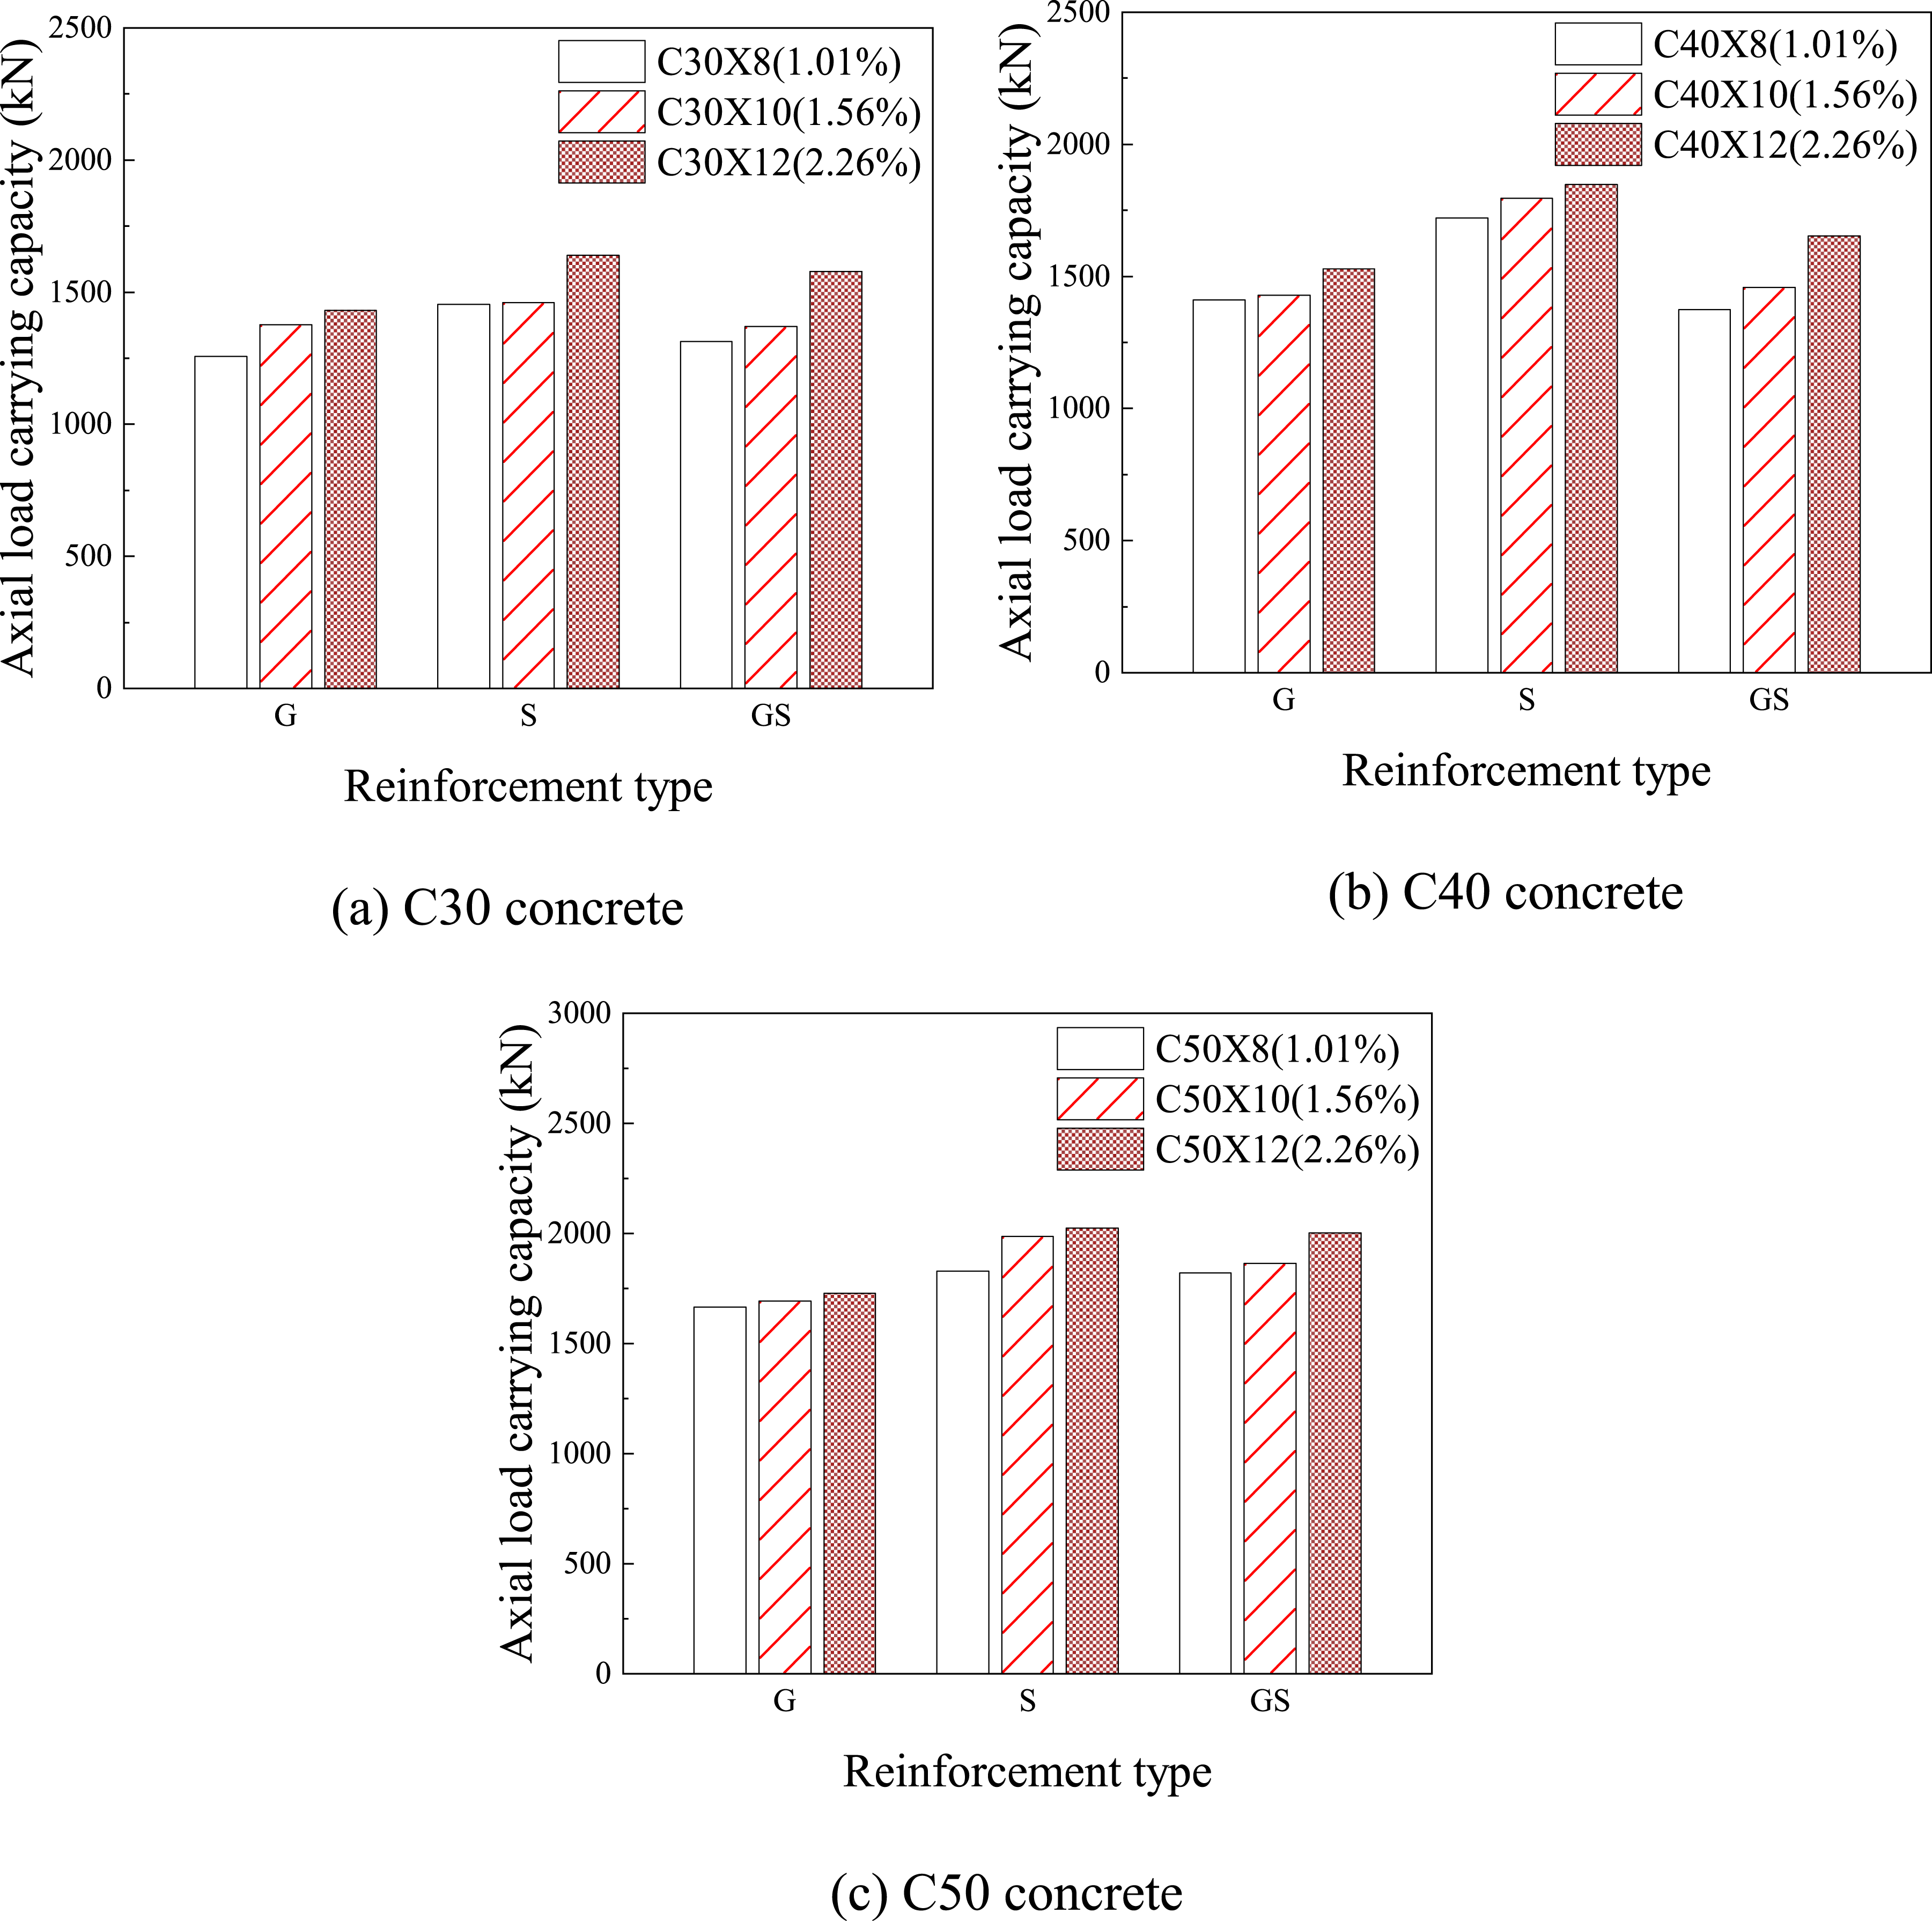
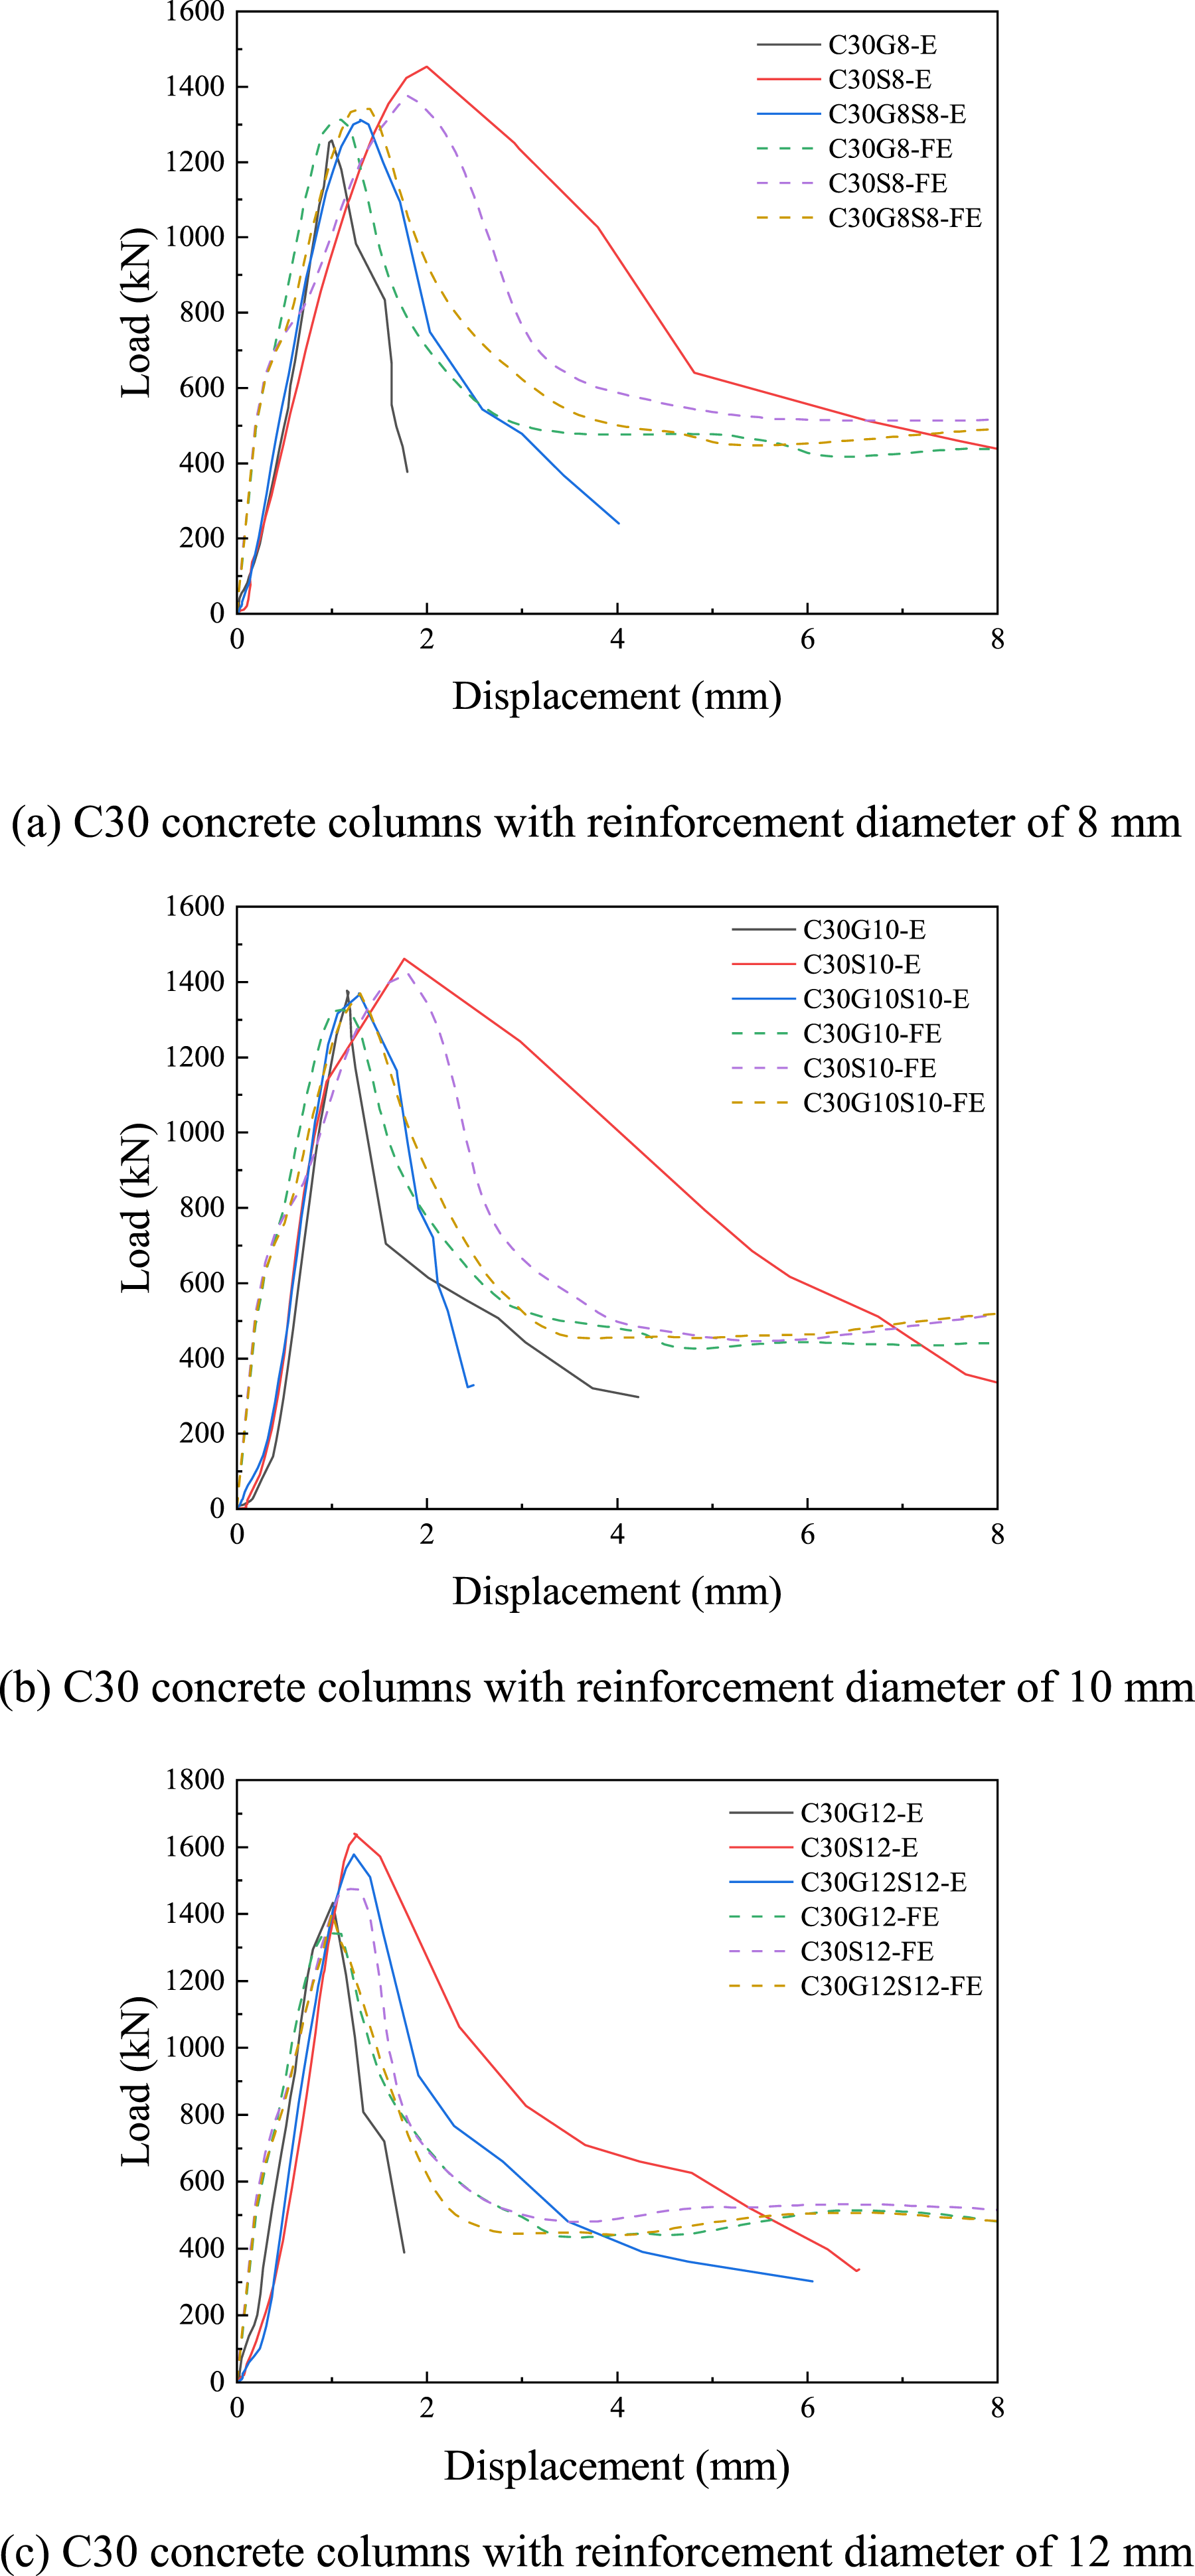
Ductility
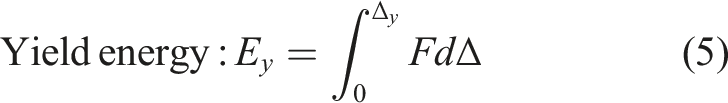
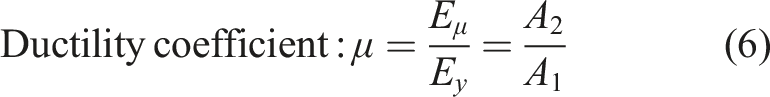
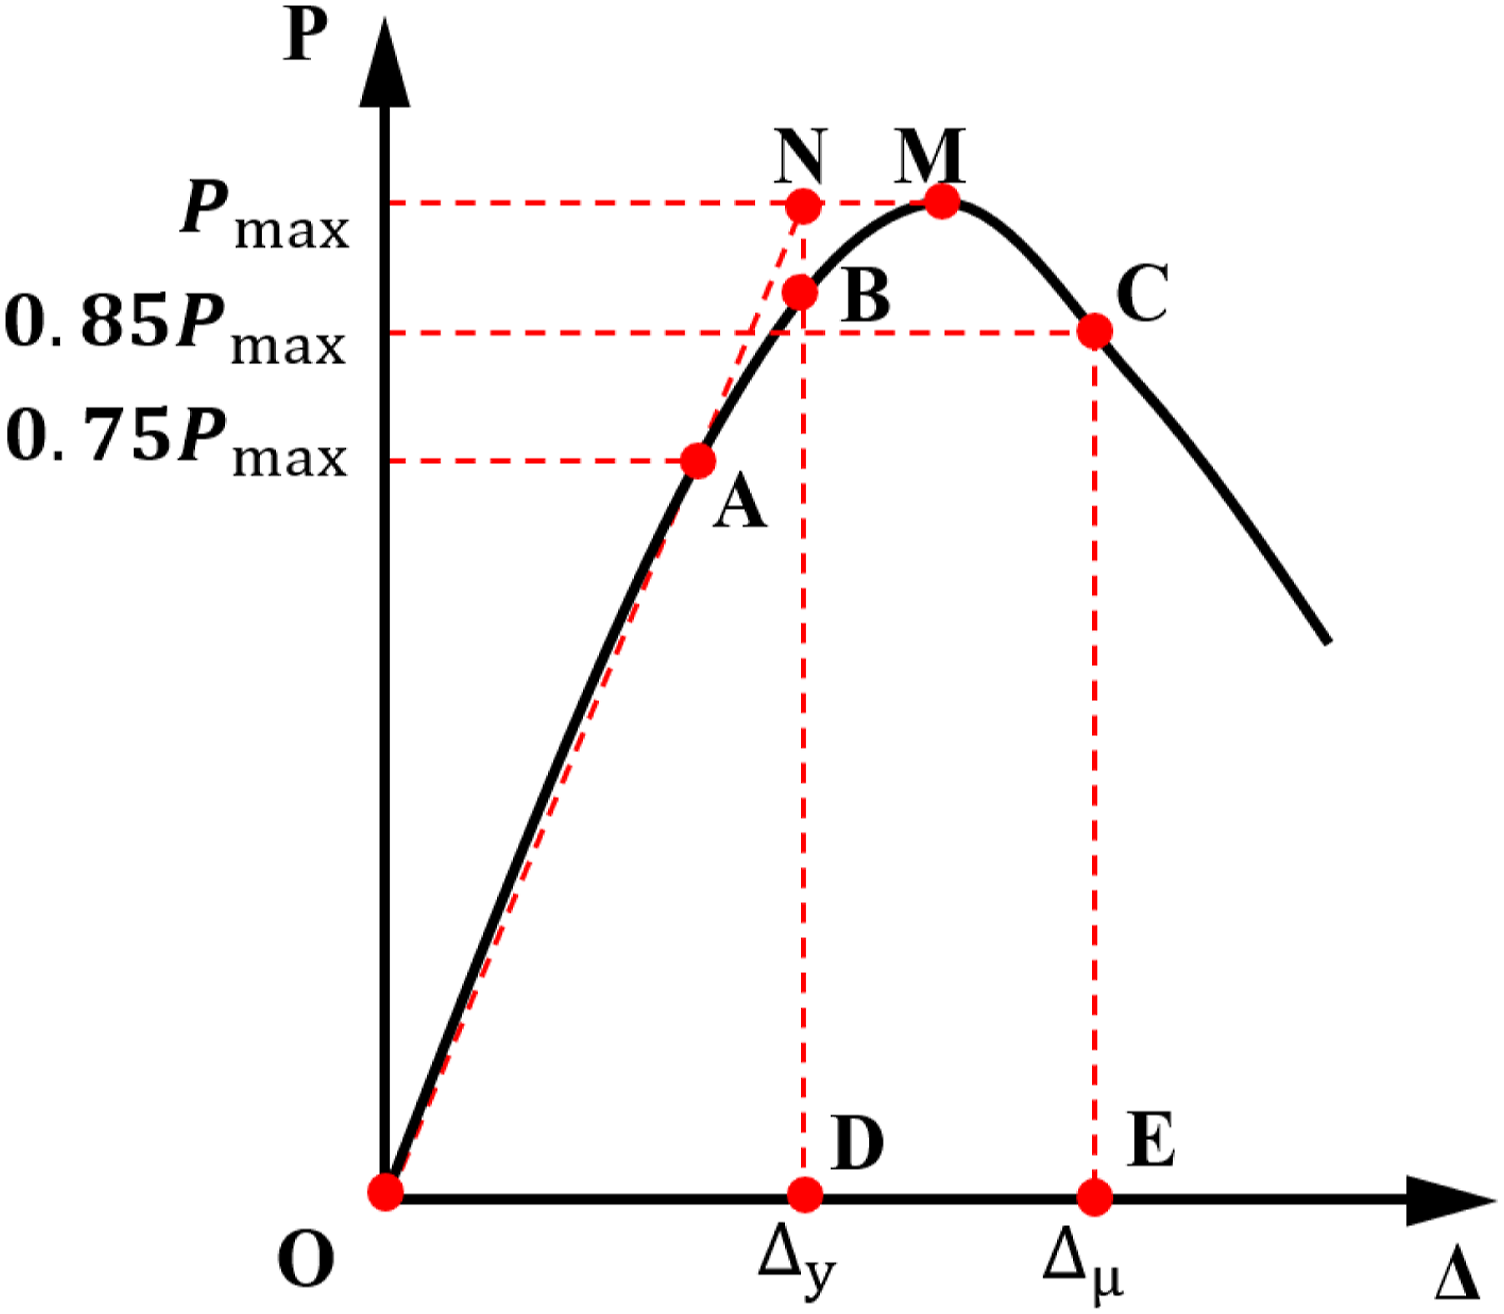
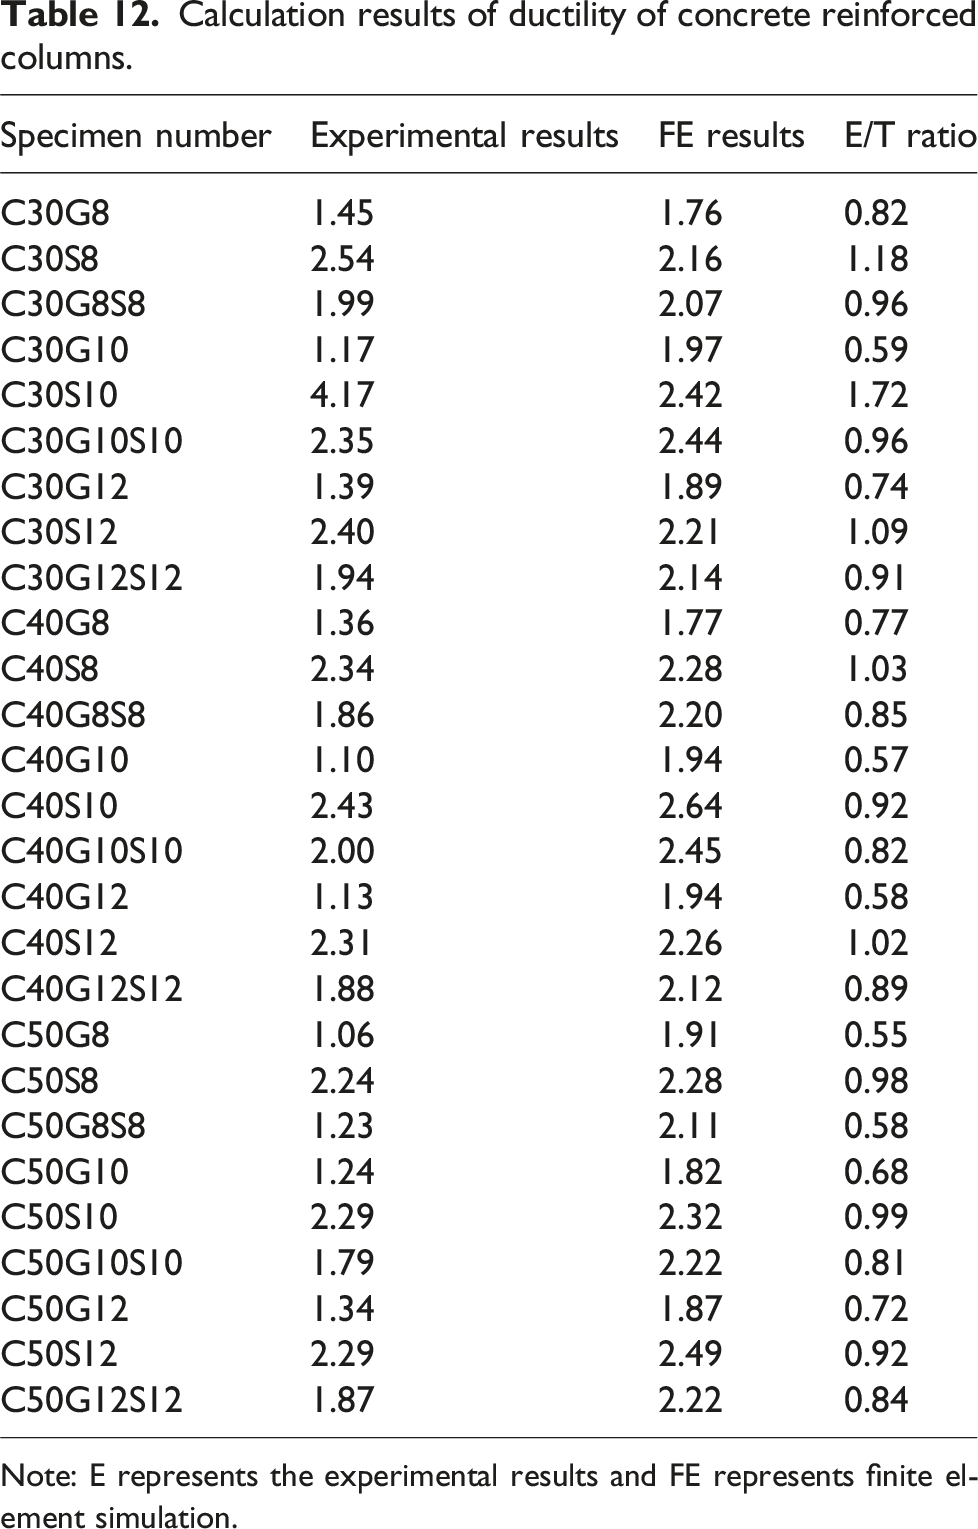
To preliminarily summarize the ductility behavior of the column, it is necessary to observe and analyze the column’s load displacement curve. In this explanation, C30 will serve as the example. Figure 16 illustrates the load displacement curve of the column as observed in both experiments and FE simulations. Based on a comprehensive analysis of the data, it can be conclusively stated that there is significant correlation between the experimental results and the FE simulations. The largest load displacement curve areas are observed in S-SSCC columns, while the area is smallest in G-SSCC columns. Hybrid reinforced columns exhibit load displacement curve areas between S-SSCC columns and G-SSCC columns. Among them, the curve of G-SSCC columns suddenly decreases after peak load, showing brittle failure, while the curve of GS-SSCC columns and S-SSCC columns decreases relatively slowly, showing ductile failure. The ductility coefficient of the column can be determined utilizing the R. Park method, as illustrated in Figure 17. In this figure, point D represents the yield displacement, and the area below OBD and the x-axis is Load displacement curve of columns. (a) C30 concrete columns with reinforcement diameter of 8 mm (b) C30 concrete columns with reinforcement diameter of 10 mm (c) C30 concrete columns with reinforcement diameter of 12 mm. Note: E represents the experimental results and FE represents finite element simulation. R. Park method. Calculation results of ductility of concrete reinforced columns. Note: E represents the experimental results and FE represents finite element simulation.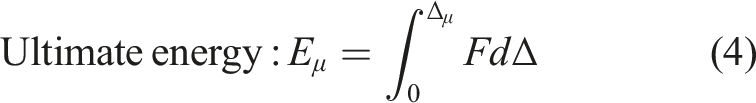
Effect on the reinforcement type of columns
Upon comparing the load displacement curve and ductility coefficient, it becomes evident that S-SSCC columns demonstrate the highest level of ductility, whereas G-SSCC columns exhibit the lowest, when both the strength grade and reinforcement ratio are consistent. In comparison to S-SSCC columns and G-SSCC columns, hybrid reinforcement columns occupy middle position in ductility. This suggests that they offer significantly improvement in ductility when compared to G-SSCC columns. Figure 18 illustrates the relationship between the ductility coefficient and the reinforcement type when both strength grade and reinforcement ratio are consistent. This improvement in ductility indicates that hybrid reinforcement can enhance both the axial load carrying capacity and the ductility of the column. Effect of reinforcement type on ductility coefficient. (a) C30 concrete (b) C40 concrete (c) C50 concrete. Note: E represents the experimental results and FE represents finite element simulation.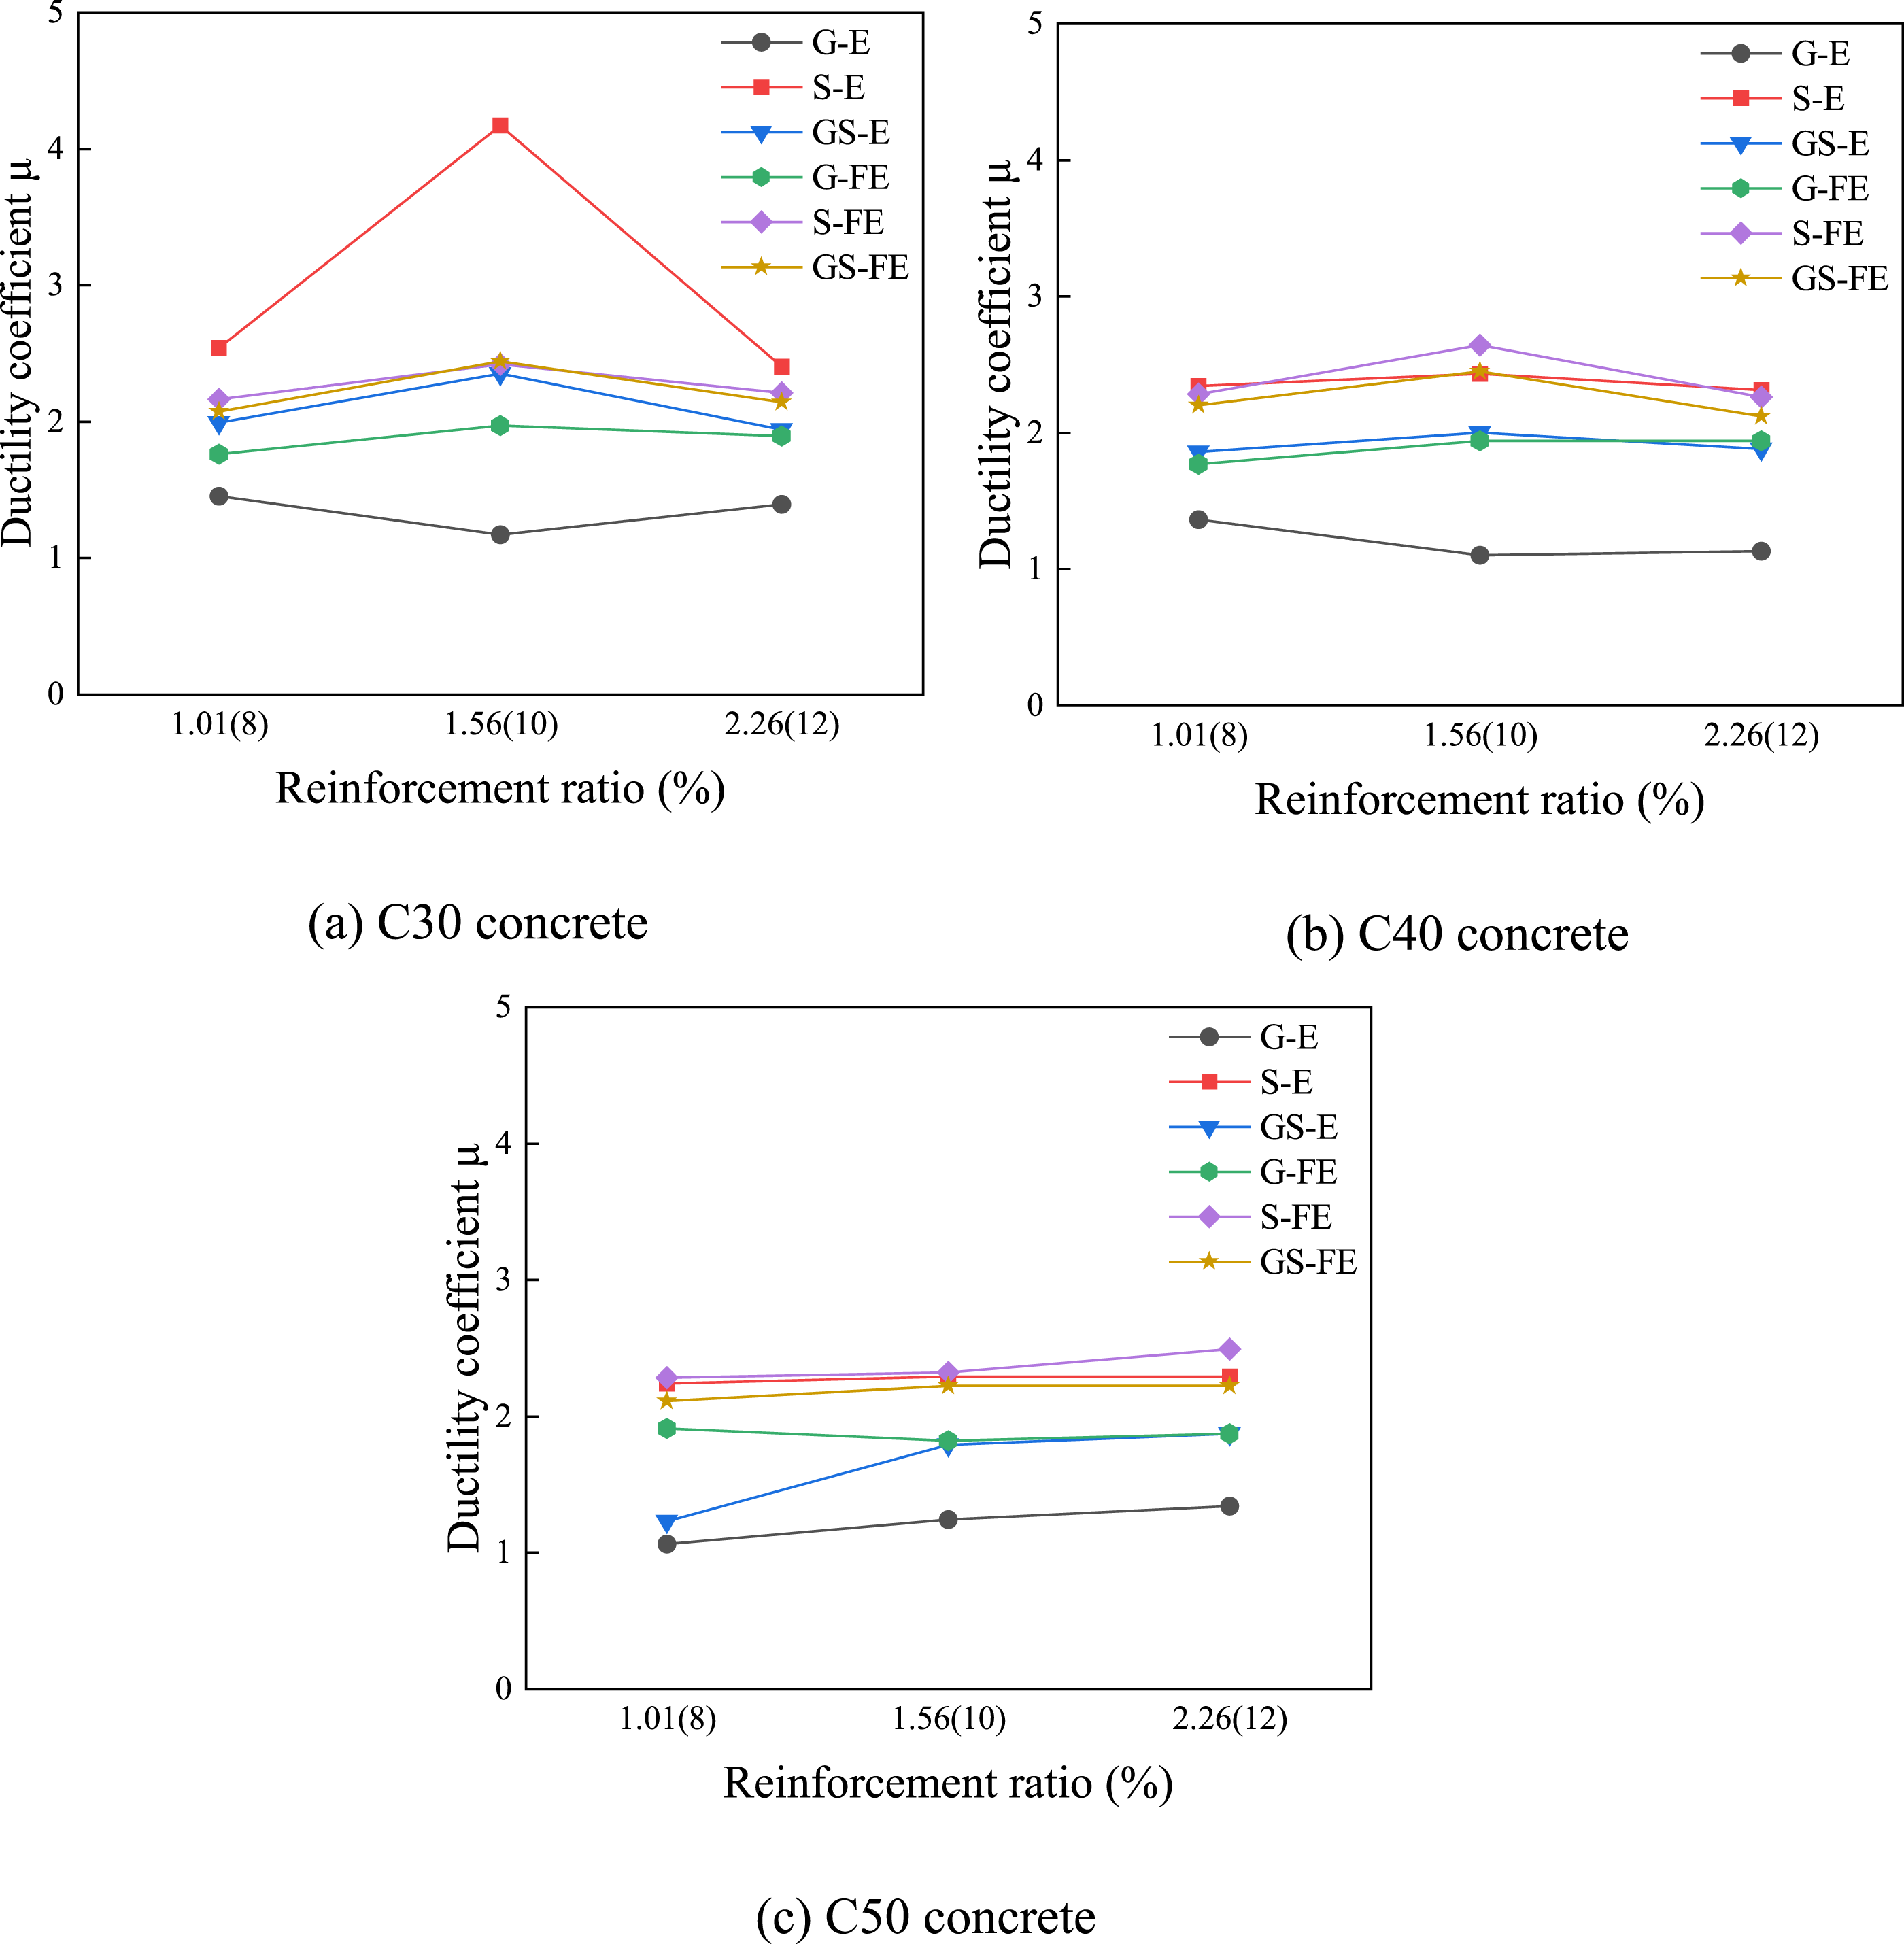
Effect on the reinforcement ratio of columns
Figure 19 illustrates the relationship between the ductility coefficient and the reinforcement ratio when both the strength grade and type of reinforcement are consistent. For concrete of strength grades C30 and C40, it is noted that the ductility coefficient rises initially but subsequently falls as the reinforcement ratio is increased. The optimal ductility coefficient is achieved at reinforcement ratio of 1.56%. In the case of concrete with strength grade of C50, the ductility coefficient progressively rises as the reinforcement ratio increases, achieving its peak value at a reinforcement ratio of 2.26%. Effect of reinforcement ratio on ductility coefficient (a) C30 concrete (b) C40 concrete (c) C50 concrete. Note: E represents the experimental results and FE represents finite element simulation.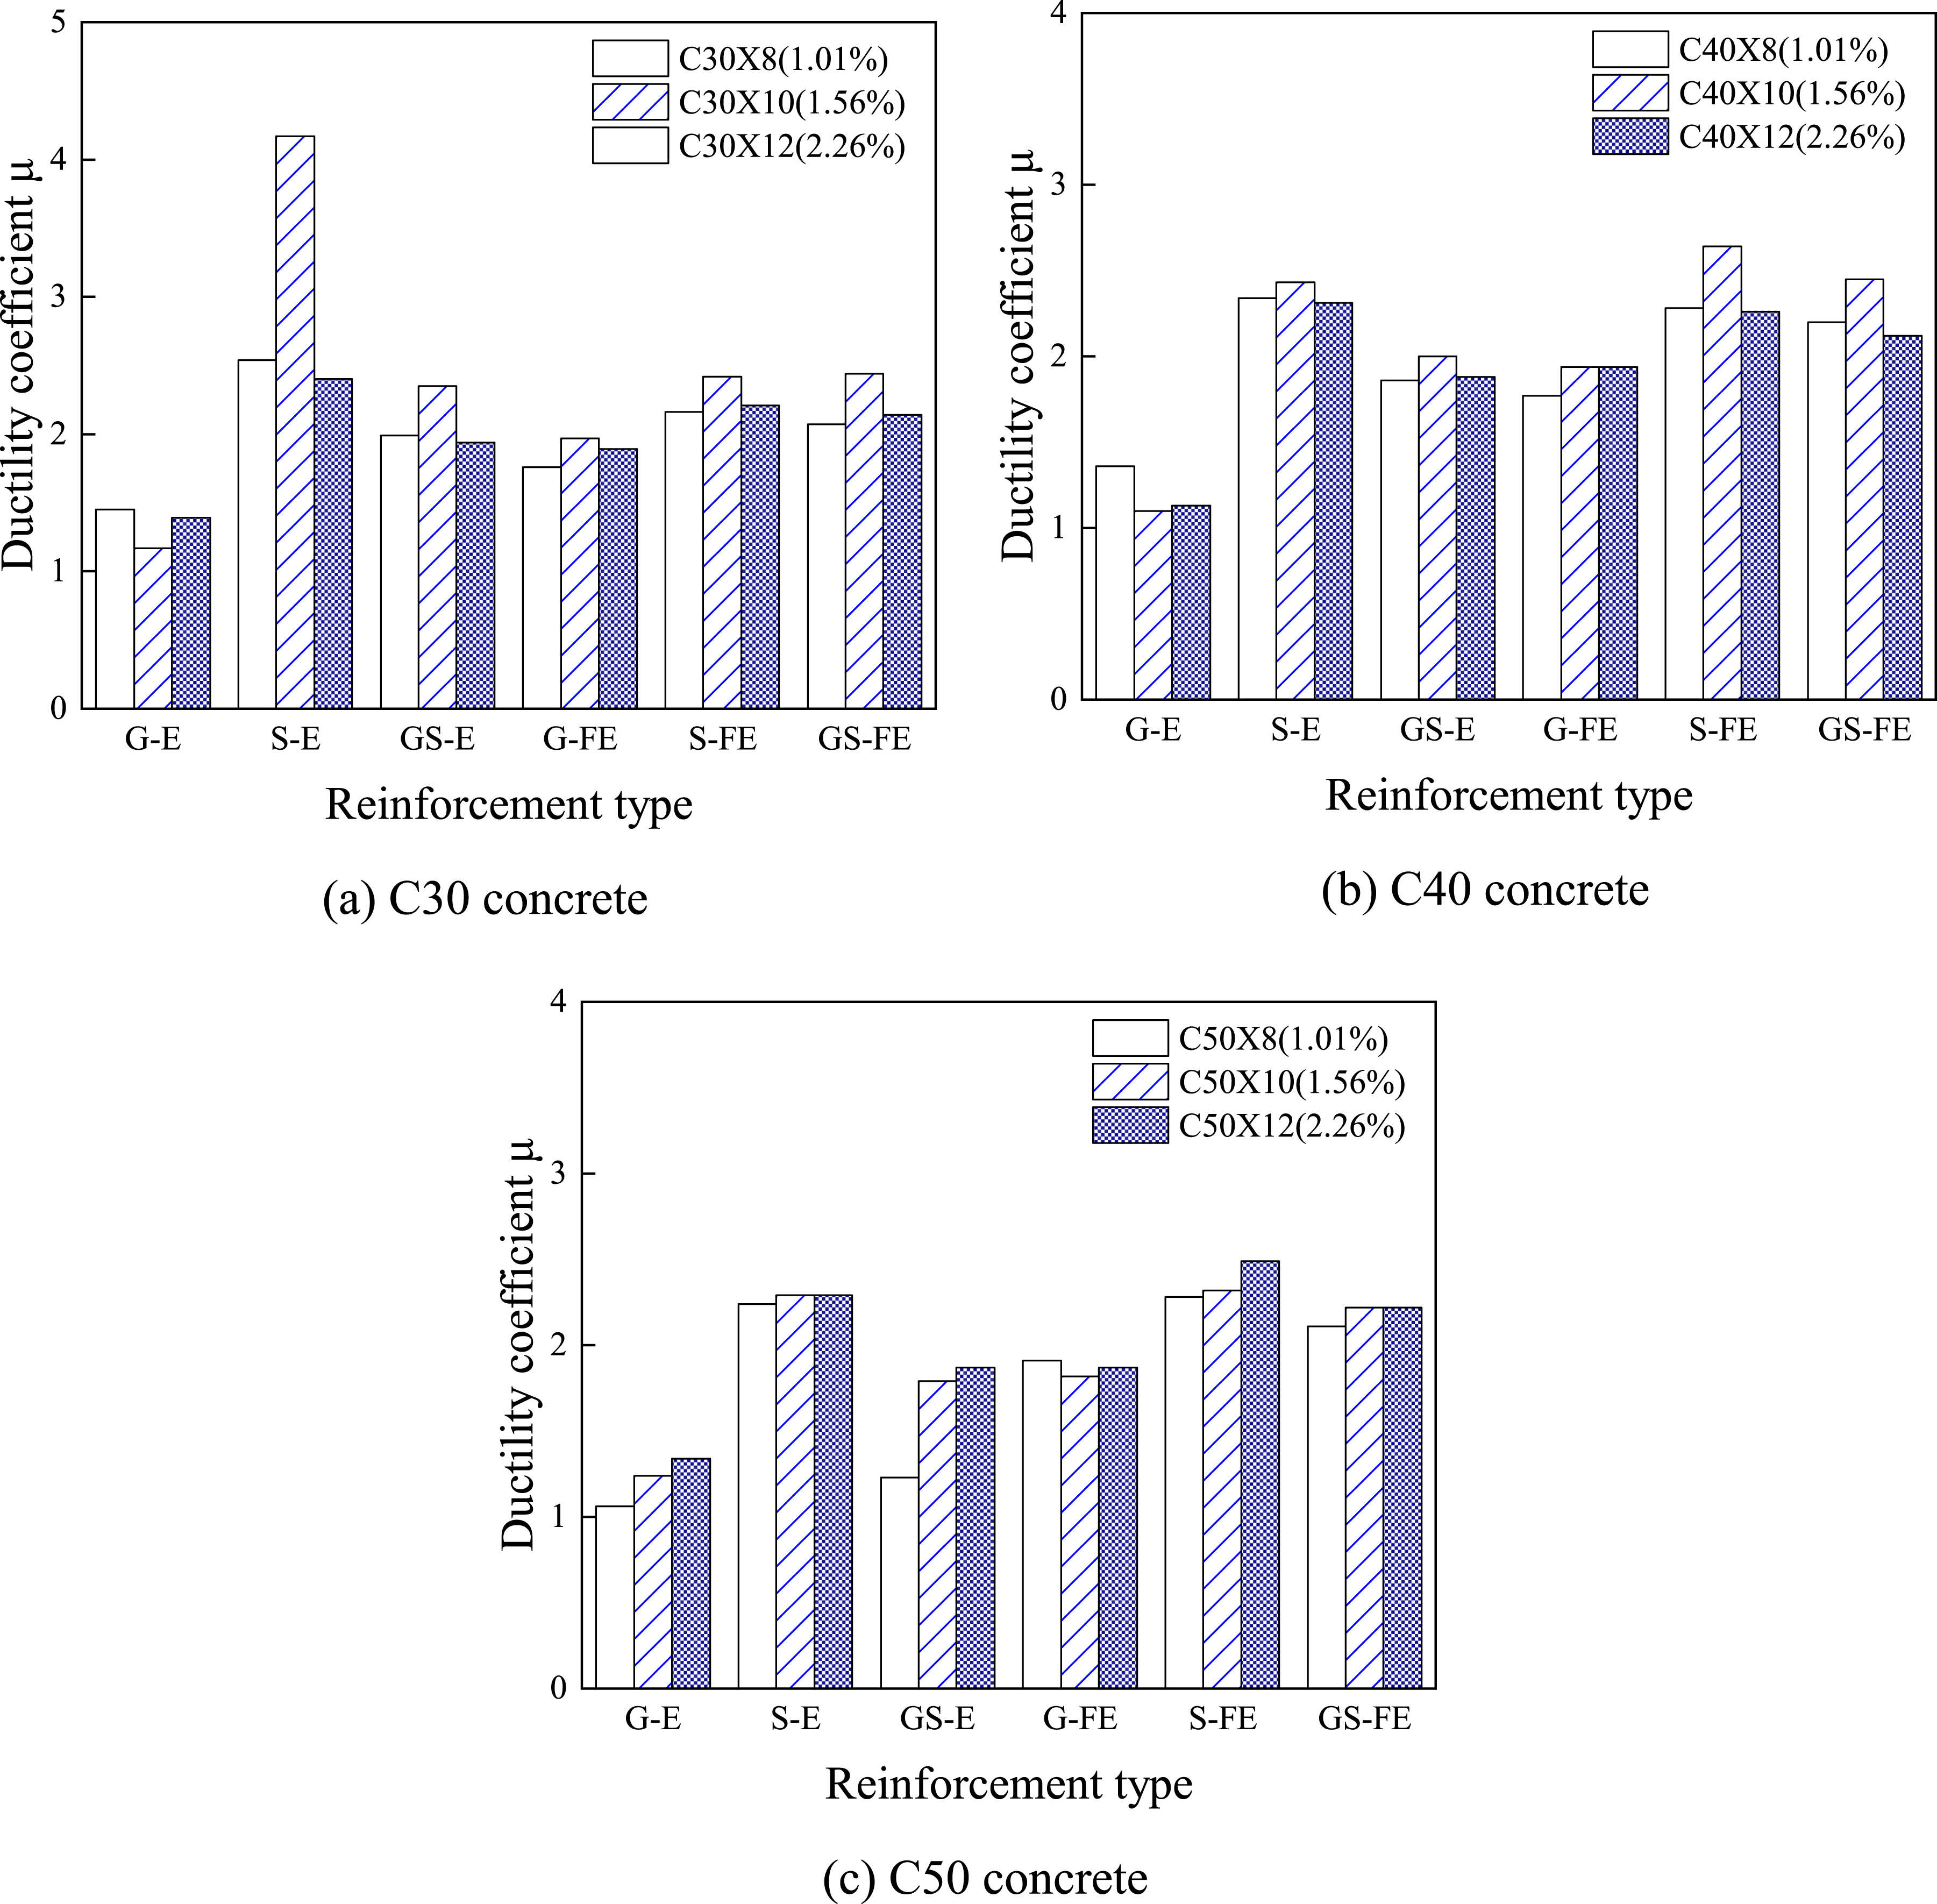
Conclusions
This paper explores the axial load carrying capacity and ductility of concrete columns hybrid reinforced with stainless steel bars and GFRP bars through experimental study, theoretical analysis, and FE simulation. The subsequent conclusions are drawn: (1) P-SSCC columns exhibit brittle failure, characterized by inverted triangular-shaped shear failure, similar to that observed in G-SSCC columns. Nevertheless, G-SSCC columns show significant increase in axial load carrying capacity and comparatively minor damage. The failure process of S-SSCC columns and hybrid reinforced concrete columns consists of three phases: the elastic phase, the elastic-plastic phase and the failure phase, ultimately resulting in ductile failure as the final result. (2) With the same strength grade and reinforcement ratio, the effect of reinforcement type on axial load carrying capacity is as follows: S-SSCC columns have the highest axial load carrying capacity, followed by GS-SSCC columns, while G-SSCC columns have the lowest. The axial load carrying capacity of columns goes up as the reinforcement ratio grows, given the same concrete strength and reinforcement type. (3) Given the same strength grade and reinforcement ratio, among the columns, S-SSCC provides superior ductility, GS-SSCC ranks next in terms of ductility, and G-SSCC is the least ductile. The results of the ductility evaluation indicate that columns with hybrid reinforcement improve the ductility compared to G-SSCC columns. (4) The best ductility is achieved when the strength grades are C30 and C40, and the reinforcement ratio is 1.56%. For C50, the optimal ductility is achieved when the reinforcement ratio is 2.26%. (5) ABAQUS accurately predicts the axial load carrying capacity and ductility of columns, with results that consistently correspond to both experimental results and theoretical analysis. (6) Apart from the control specimens, one specimen for each reinforcement combination was tested. Further studies are required to confirm the results obtained in this study and to establish definitive conclusions.
Footnotes
Author contributions
Qi Cao: Conceptualization, Funding acquisition, Writing – review & editing. Zongke Jia: Investigation, Methodology, Data curation, Software, Writing – original draft. Zhimin Wu: Validation, Supervision. Zhongguo John Ma: Supervision, Writing – review & editing.
Declaration of Conflicting Interests
The author(s) declared no potential conflicts of interest with respect to the research, authorship, and/or publication of this article.
Funding
The author(s) disclosed receipt of the following financial support for the research, authorship, and/or publication of this article: Financial support for this study was provided by the National Natural Science Foundation of China (Grant No. 52271264).
Data availability statement
The datasets generated during and/or analyzed during the current study are available from the author upon reasonable request.