
Abstract
Gearboxes are widely used in industries that involve rotating elements, owing to their ability to transmit power and velocity; hence, their failures significantly impact machine performance. As a result, numerous studies focus on fault identification and gearbox classification. The present study developed a Machine fault simulator (MFS). It diagnosed faults in the bevel gearbox using vibration signals via empirical mode decomposition (EMD) and machine learning (ML) algorithm. The ML methods considered here are Random Forest (RF) and Artificial Neural Networks (ANN). The vibration signals were collected using an accelerometer under Normal, Tooth breakage, Worn-out and Tooth crack gear fault conditions. Using EMD, vibration signals are decomposed into a limited number of intrinsic mode functions (IMFs). Various statistical features of the decomposed EMD signals are extracted to obtain the input vector. The decision tree (J-48) algorithm is used to identify key features for classifier training and testing. The experiments are performed on healthy and simulated-fault gears under 30 N load and 750 r/min conditions. The relative effectiveness of RF and ANN classifiers is also compared through the test part. The experimental results show that the proposed RF algorithm gives good classification accuracy. Further, classification accuracy improves when using RF along with EMD. The proposed methodology will aid practitioners and researchers in diagnosis faults in rotating machine elements.
Keywords
Introduction
The gearbox is a crucial part utilised in many sectors, including automotive, chemical, and aerospace, in rotating machinery systems.1,2 Gears are used to transfer speed and power from one rotating shaft to another. 3 Due to excessive loads and insufficient lubrication, different forms of gearbox failure occur. These systems can fail due to an abnormal gearbox condition that causes vibration, noise and catastrophic system failure.4,5 By detecting incipient defects, unintended gearbox failures could be prevented. Fault gearbox detection consists of three main steps: data acquisition, feature extraction, and classification. Data collection is a method for gathering useful information for fault detection in rotating machinery systems. 6 During data processing, different statistical features are extracted, and these feature vectors are eventually selected as responses for the machine learning algorithm. Vernekar et al. 7 investigated the Naïve Bayes technique and EMD for gearbox problem diagnosis. The authors reported that the proposed hybrid techniques are effective for gearbox fault detection. Liu et al. 8 reported gear accountability detection via rapid dynamic time warping to locate the corresponding defective gear with minor variations in the system’s operating speed. Parey et al. 9 investigated fault diagnosis of a spur gear using EMD from a simulated vibration signal and reported that the significant feature for fault identification is the IMF’s Kurtosis. A novel ensemble method for analysing stability features in CNC lathe turning operations is proposed by Gupta et al. 10 The technique combines several machine learning models to enhance machining performance and improve stability prediction. Its efficacy in determining ideal cutting conditions is demonstrated by experimental validation. The method improves surface quality, decreases tool wear, and increases precision. By developing intelligent machining procedures for CNC processes, this work advances the field. Han et al. 11 compared various machine learning approaches for Fault diagnosis of rotating machinery and reported that RF achieved better performance in terms of accuracy, robustness, and stability. The authors also concluded that RF is less influenced by background noise. Cabrera et al. 12 investigated multi-class fault detection of a spur gearbox using RF and wavelet packet decomposition via vibration signal. The author noticed that the recommended techniques achieve higher classification accuracy.
Cerrada et al. 13 explored the multi-fault condition by selecting the best feature set from vibration signals. The diagnosis system is implemented based on a genetic algorithm (GA) and categorised using RF, with a reported classification accuracy of more than 97% Chen et al. 14 used the EMD approach to obtain the vibration signal. The immune genetic algorithm was utilised to classify faults and select critical characteristics from the obtained feature matrix, and a wavelet transformation was used with a support vector machine. Wang et al. 15 analysed sound signals to diagnose engine failure. They found that the fault state can be confidently predicted by applying the Hilbert-Huang transform to extract significant features, followed by classification with a support vector machine. Praveen et al. 16 developed a three-pole active magnetic bearing fault controller to maintain performance even in the event of a common problem. Nonlinear fuzzy logic control was used to design the fault controller. The author claims that, even in the event of failure, the devised controller can stabilise the rotor for significant deviations from the origin. Gupta et al. 17 use an ANN and local mean decomposition (LMD) to study tool chatter in CNC turning of Al 6061. Vibration signals are broken down, and chatter-related features are extracted using LMD. For precise chatter detection and categorisation, these features are subsequently fed into an ANN model. Experimental results confirm the method’s ability to distinguish between stable and unstable cutting situations. By reducing surface imperfections and chatter-induced tool wear, the technique improves machining efficiency. This research supports the development of sophisticated monitoring systems for CNC turning operations. Hammamiet al. 18 examined the nonlinear dynamic behaviour of a planetary gearbox under both run-up and stationary conditions. According to the authors, the vibration intensity is constant when stationary but rises during the fluctuation and run-up regimes, and the mean Hertzian stiffness and gear mesh stiffness stay constant. Based on vibration measurements and feature extraction, Gougam et al. 19 anticipate the bearing’s remaining useful life. Significant characteristics are identified from the squared raw signal’s filtered band-pass, and health indicators are selected automatically using the relief technique. The nonlinear degradation of the derived indicators is modelled using an Optimised Adaptive Neuro-Fuzzy Inference System with Particle Swarm Optimisation. Junshen et al. 20 conducted a roller bearing fault analysis using the EMD method and employed an ANN as a classifier. Saravanan et al. 21 proposed fault detection in a spur gearbox using wavelet transforms and a neural network. The authors concluded that wavelet transforms were an effective tool for identifying the gearbox fault indicator. Dhakar et al. 22 suggest a support vector machine (SVM) and local mean decomposition (LMD) for diagnosing rolling bearing problems in air compressors. LMD is used to decompose vibration data and extract characteristics associated with faults. An SVM technique is then used to classify these data, precisely identifying and distinguishing bearing problems. Experimental results demonstrate the method’s remarkable accuracy and resilience across a range of operating conditions. By enabling early fault detection, the technique enhances predictive maintenance plans. This work improves the dependability and effectiveness of industrial machinery monitoring.
Analysis of vibration signals is a widely used approach for fault detection in machine-driven rotary structures. Vibration indications, however, remain considered nonstationary and nonlinear. In addition, background noises present a serious problem in the study of signals of this kind. In addition, relatively weak signals from the gearbox are often influenced by relatively stronger signals. All of these limitations force us to develop the most effective method for diagnosing gearbox failures. Defects and degradation in the gearbox have a significant impact on the reliability of rotating equipment. These defects can be caused by a variety of circumstances, including defective assembly, insufficient lubrication, and overload, and they can result in significant financial losses as well as considerable risks to the workers. As a result, gearbox fault identification has long been a research topic, with a variety of techniques and approaches proposed to address the problem and improve efficiency and reliability. Since vibration signals operate more efficiently than temperature, current, and sound signals, they are frequently used for problem diagnostics. This is owing to the ease with which it may be obtained and the value of the information it gives about the cause and severity of the malfunction.
The effectiveness of prior defect-detection methods has been demonstrated under constant speed and loading conditions; however, gears are commonly used in harsh environments under nonstationary operating conditions, rendering such methods less effective and inaccurate. The authors of this article attempted to address the problem of nonstationary, nonlinear vibration signals using the EMD approach. Based on the energy entropy of the different IMFs, a thorough statistical analysis identifies the best IMFs for diagnosing gearbox faults. The integration of EMD, statistical feature extraction, and machine learning classifiers such as RF and ANN has been explored in prior research, the present study offers distinct contributions. First, it focuses on bevel gearbox fault diagnosis under controlled loading conditions, an area with comparatively limited investigation. Second, a hybrid feature selection approach based on the J-48 decision tree is employed to identify the most significant features from EMD-derived signals. Third, a systematic comparative analysis of RF and ANN classifiers with and without EMD preprocessing is presented, quantitatively demonstrating the effectiveness of EMD in improving classification performance. This explicit evaluation provides deeper insight into the role of EMD, which is often not comprehensively addressed in existing studies. Gearboxes are detected using IMS run-to-failure vibration signals in both real-world and simulated fault conditions. Figure 1 displays the flowchart for the suggested fault identification method. Flowchart of proposed Fault diagnosis techniques.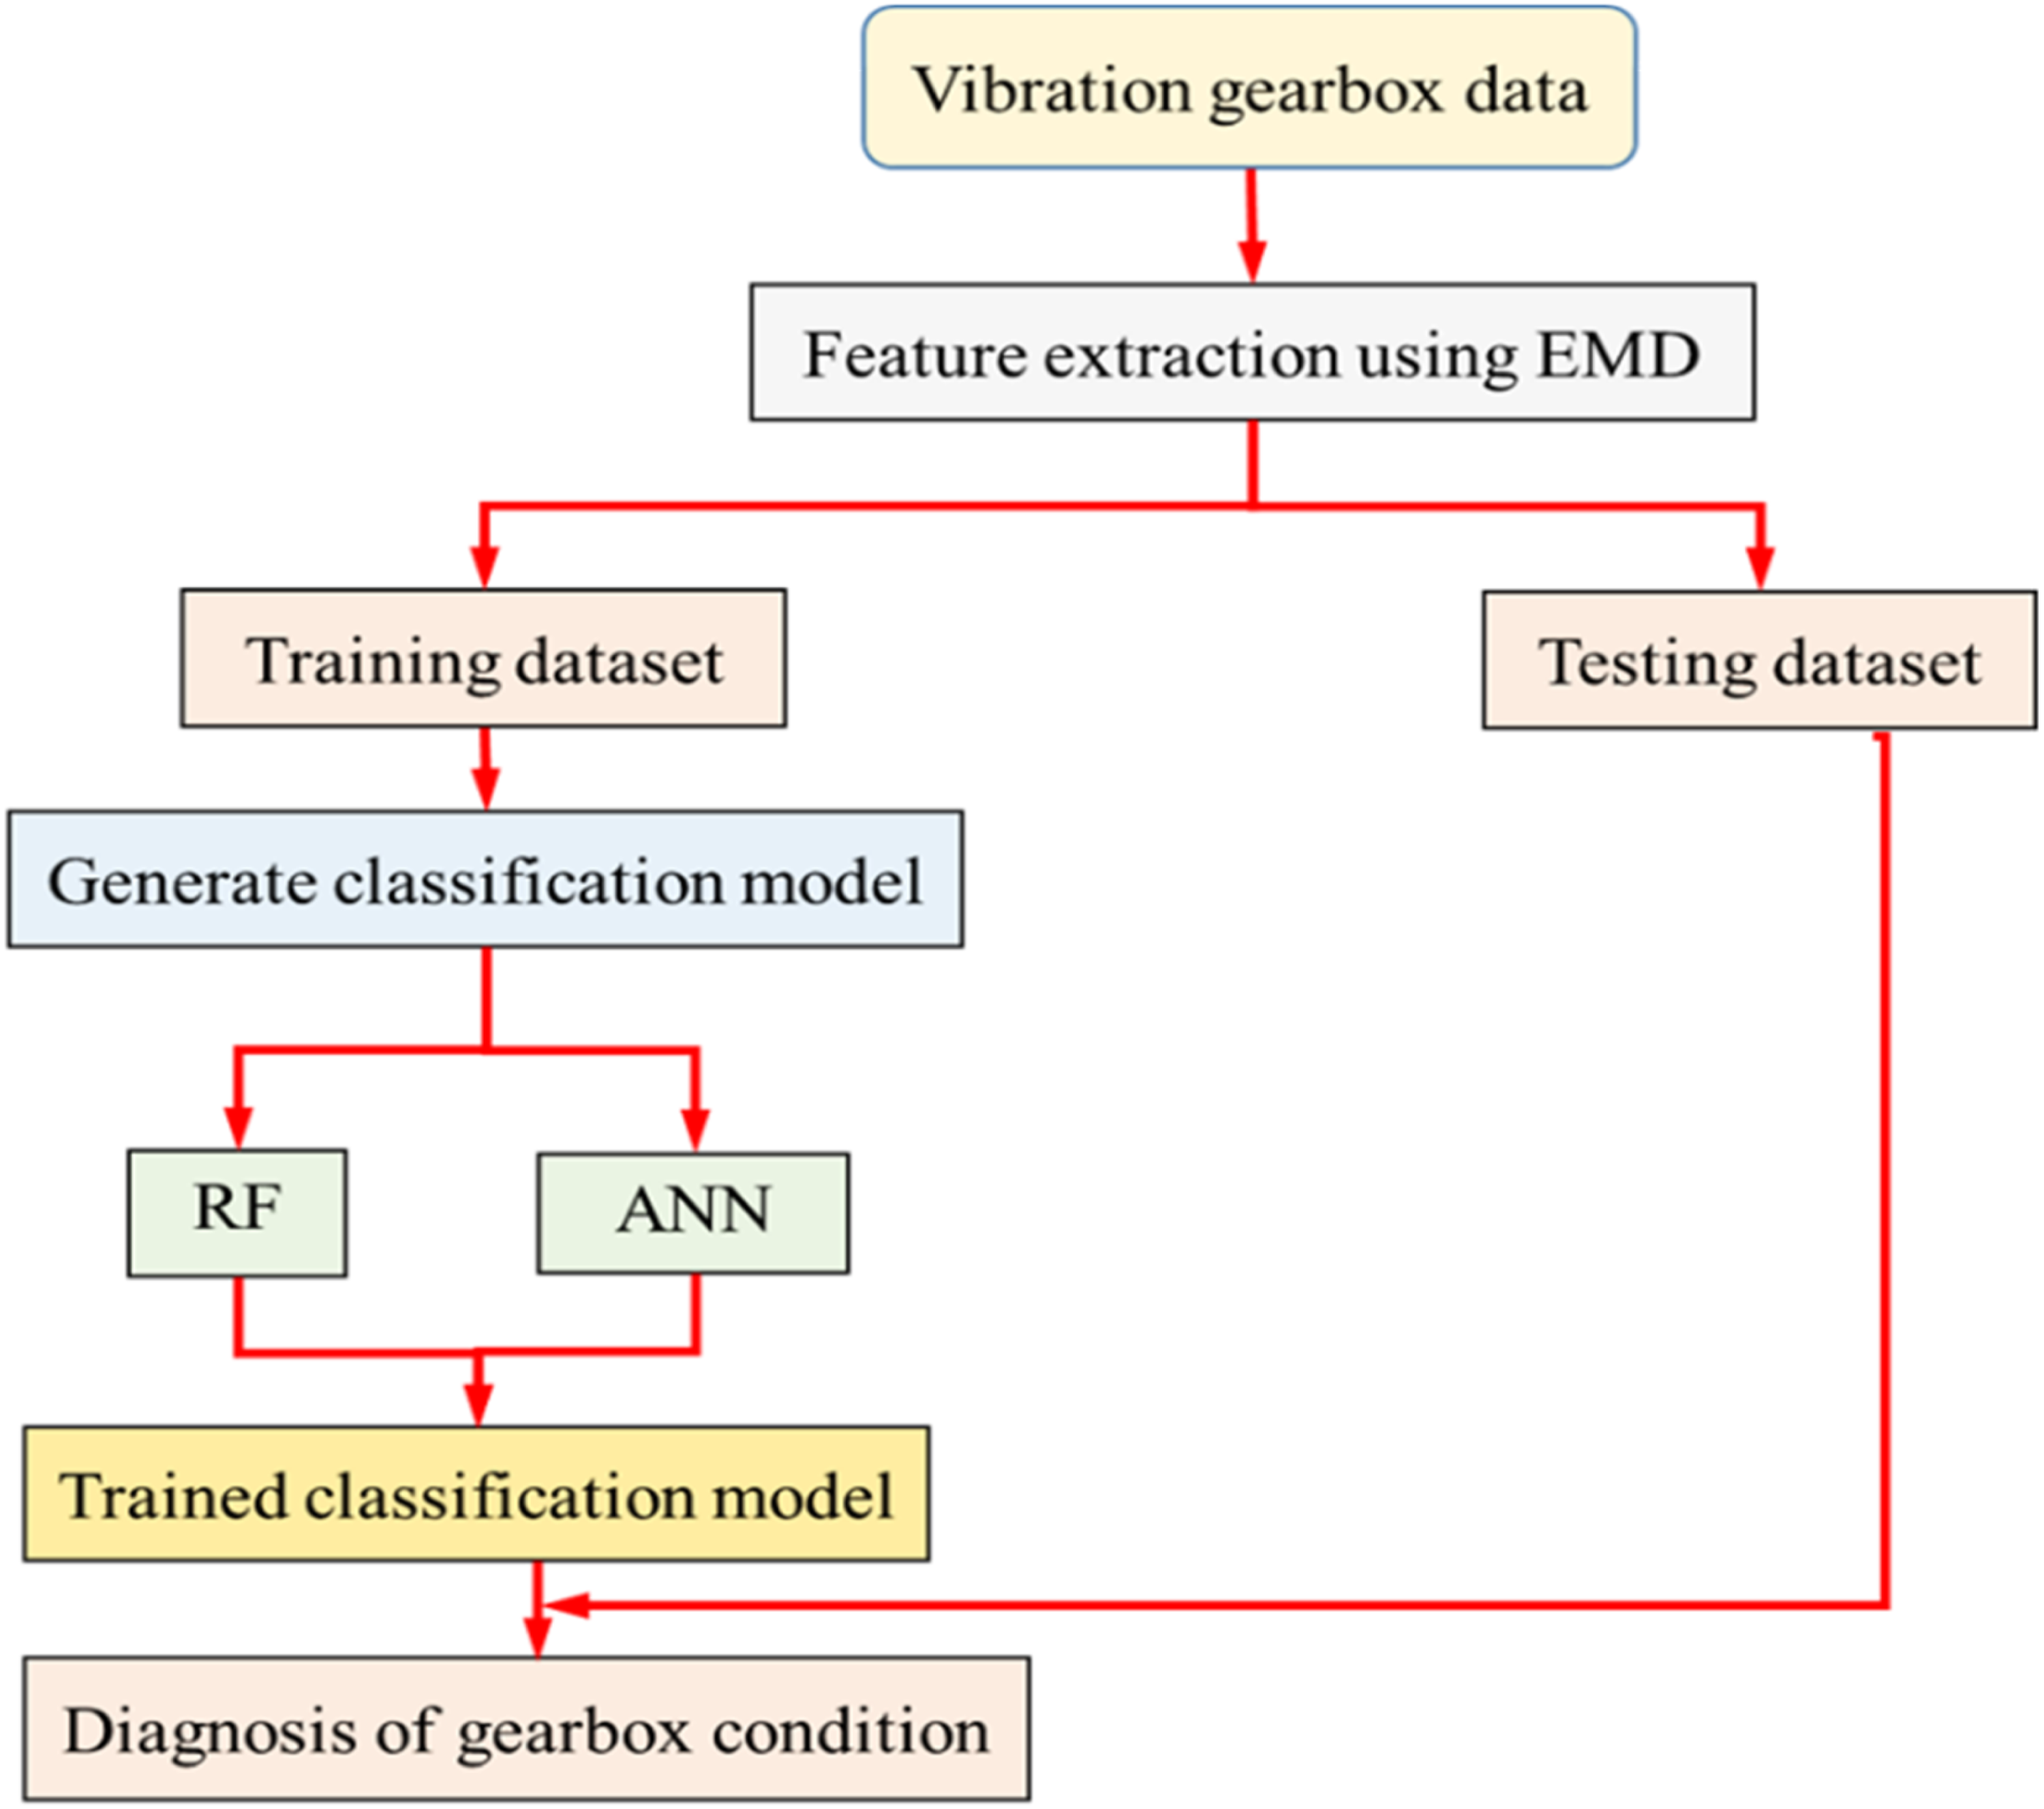
Experimental setup and procedure
Experimental test rig
An experimental setup has been developed based on available literature for the requisite Fault diagnosis of the bevel gearbox. The experimental test rig setup used for fault identification of the bevel gearbox under normal and simulated defective conditions is shown in Figure 2. The accelerometer vibrational signals were collected under 30 N loads and 750 rotational speeds. The selection of a fixed operating condition in this study was intentional and methodologically motivated. The primary objective of this work is to systematically evaluate the effectiveness of the proposed EMD-based feature extraction and machine learning framework under controlled and repeatable conditions. By maintaining constant speed and load, we eliminate external variability and ensure that the observed differences in vibration signals are solely attributable to fault conditions, thereby enabling a more reliable assessment of the diagnostic capability of the proposed approach. A bevel gearbox is used as a test part attached to a 1 HP three-phase induction motor to transmit power. The operating speed range of gearbox systems is 100–1440 r/min. An accelerometer with a sensitivity of 10.19 mV/(m/s2) and the vibration signals are gathered using a frequency range of 1 to 4000 Hz. Vibration data is collected and evaluated through a National Instruments (NI) 9234 four-channel data capture kit and NI LabVIEW software. At the specified speed, five experiments were conducted for each gear condition, and the data file was retained. For all situations under the given operating conditions of load and speed, A sample length of 12800 and a sampling frequency of 25.6 kHz are chosen, and each sample is taken for 0.8 seconds. Consequently, there are 30 data sets, each containing 20,640 samples. As a result, 6,19,200 samples for healthy individuals and those for different conditions were collected. In this manner, datasets for both healthy and simulated defective gears, totalling 2476800, were acquired. Schematic diagram of the experimental setup.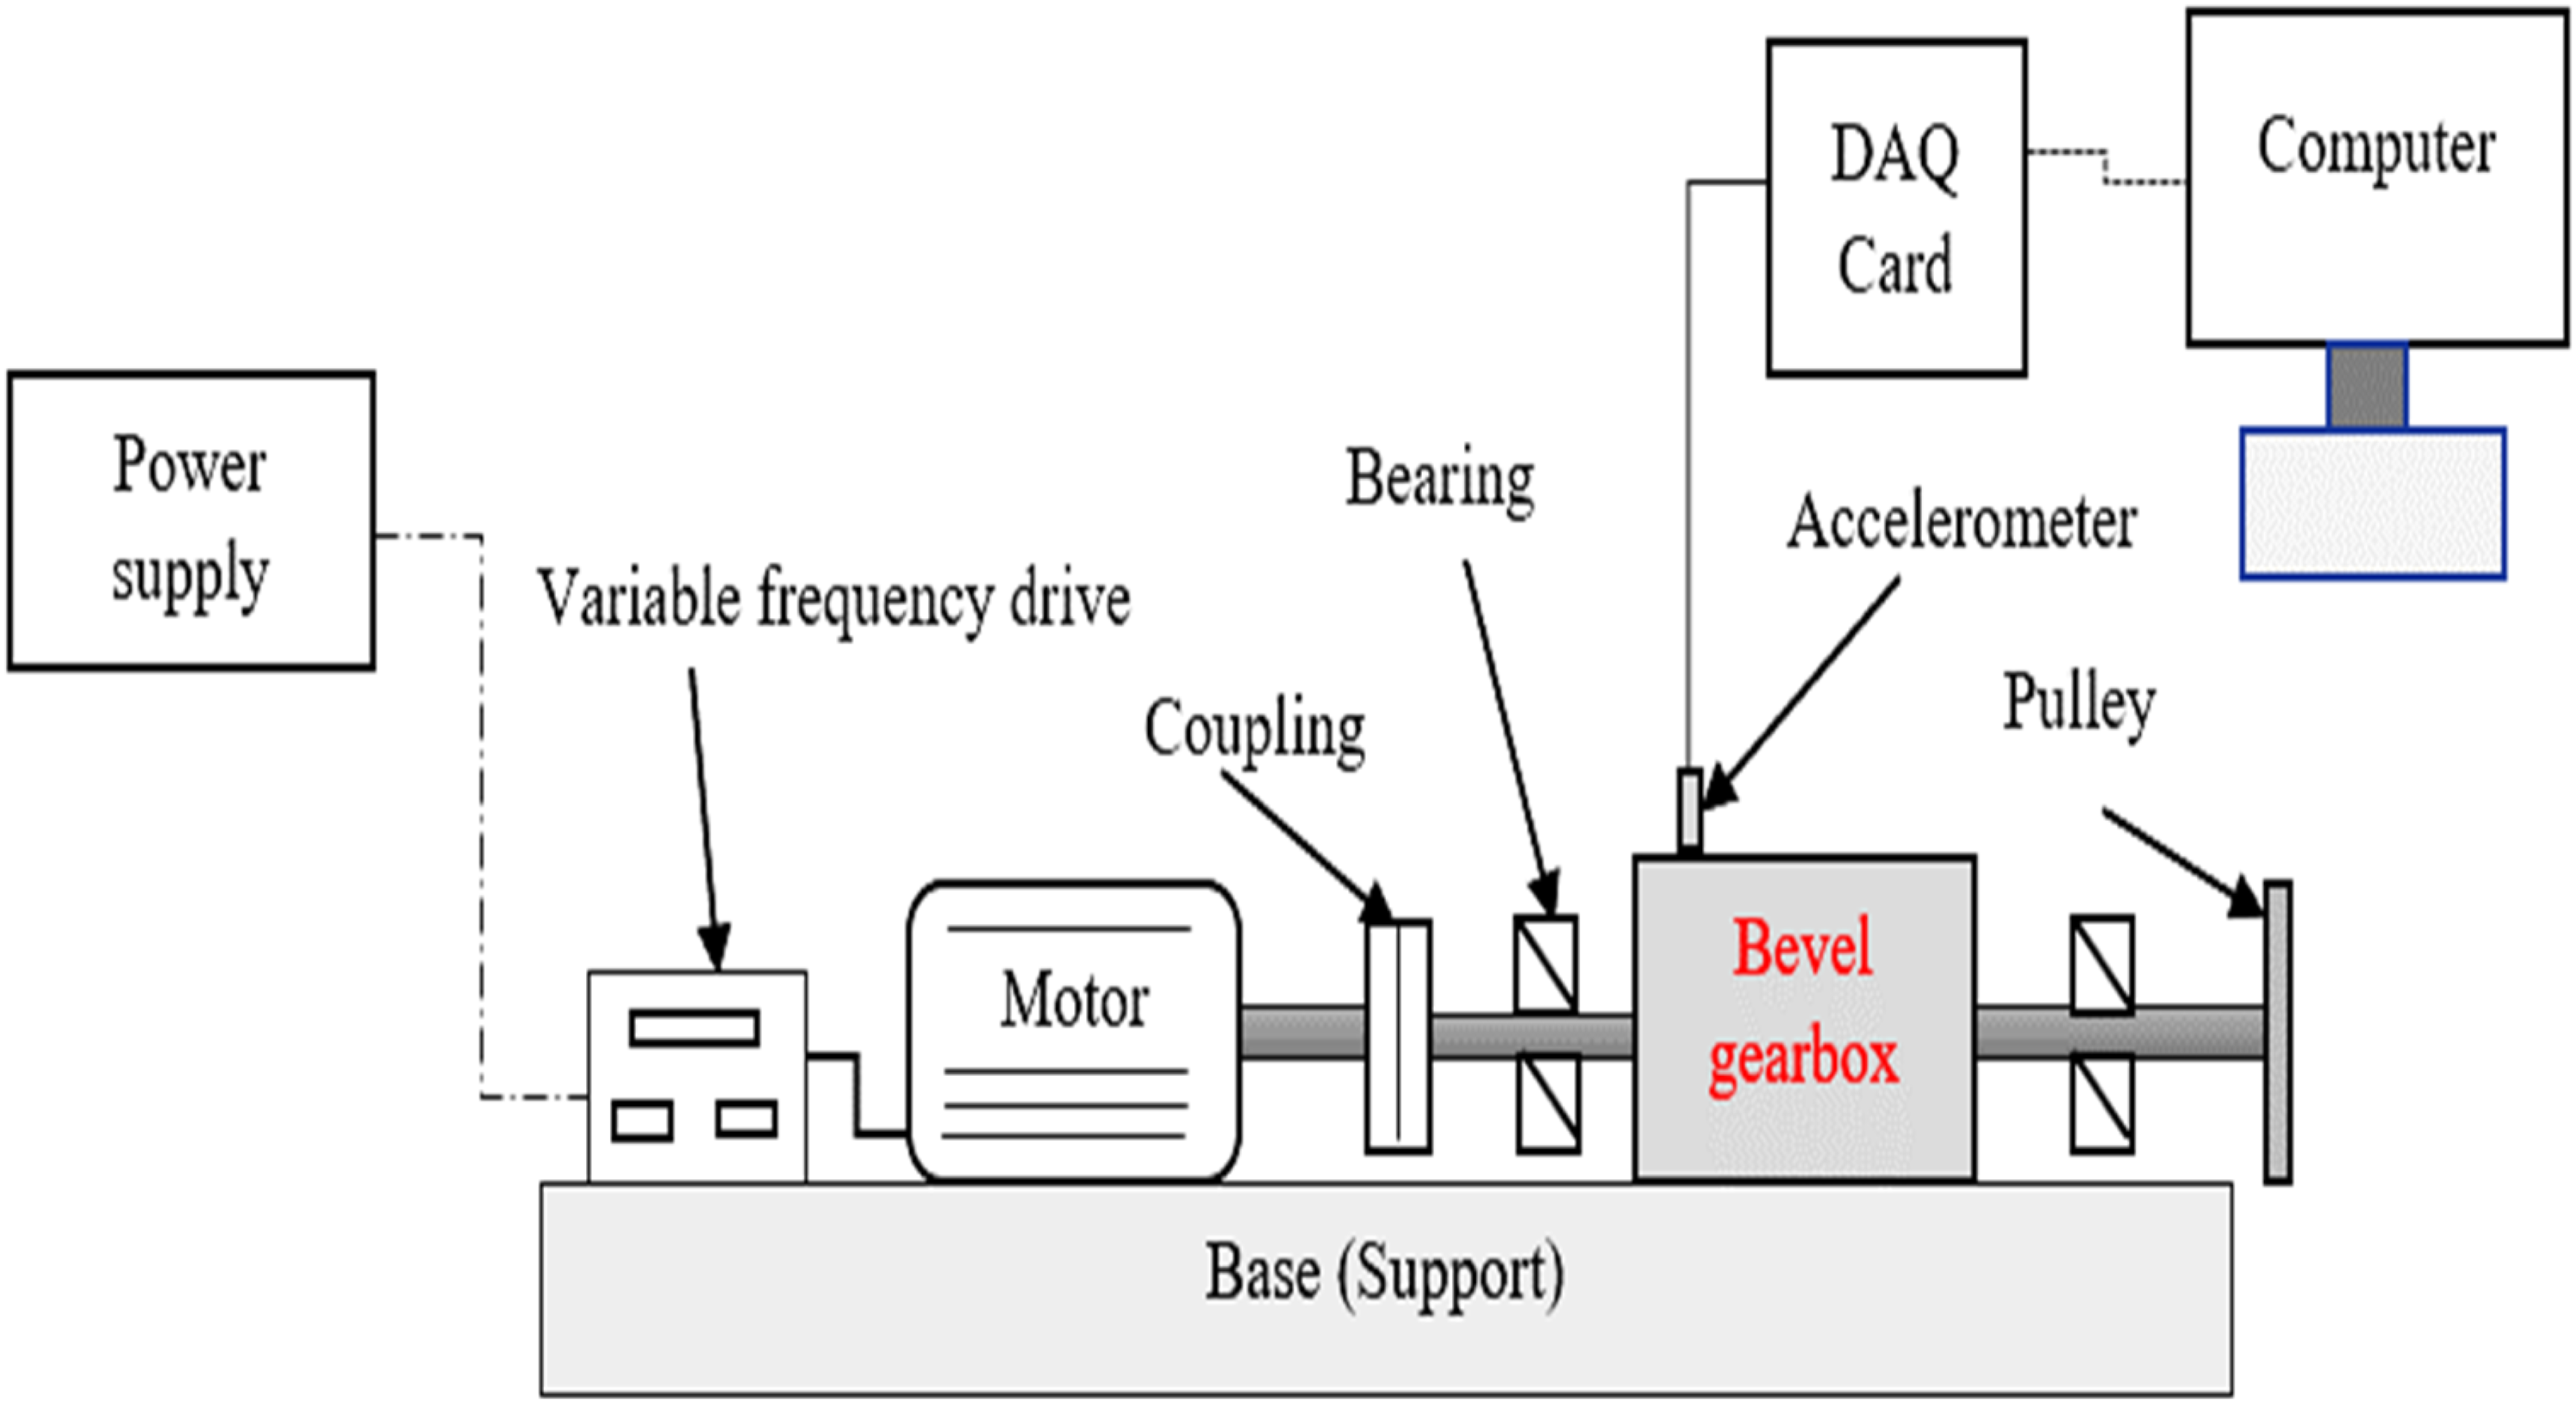
Experimental procedure
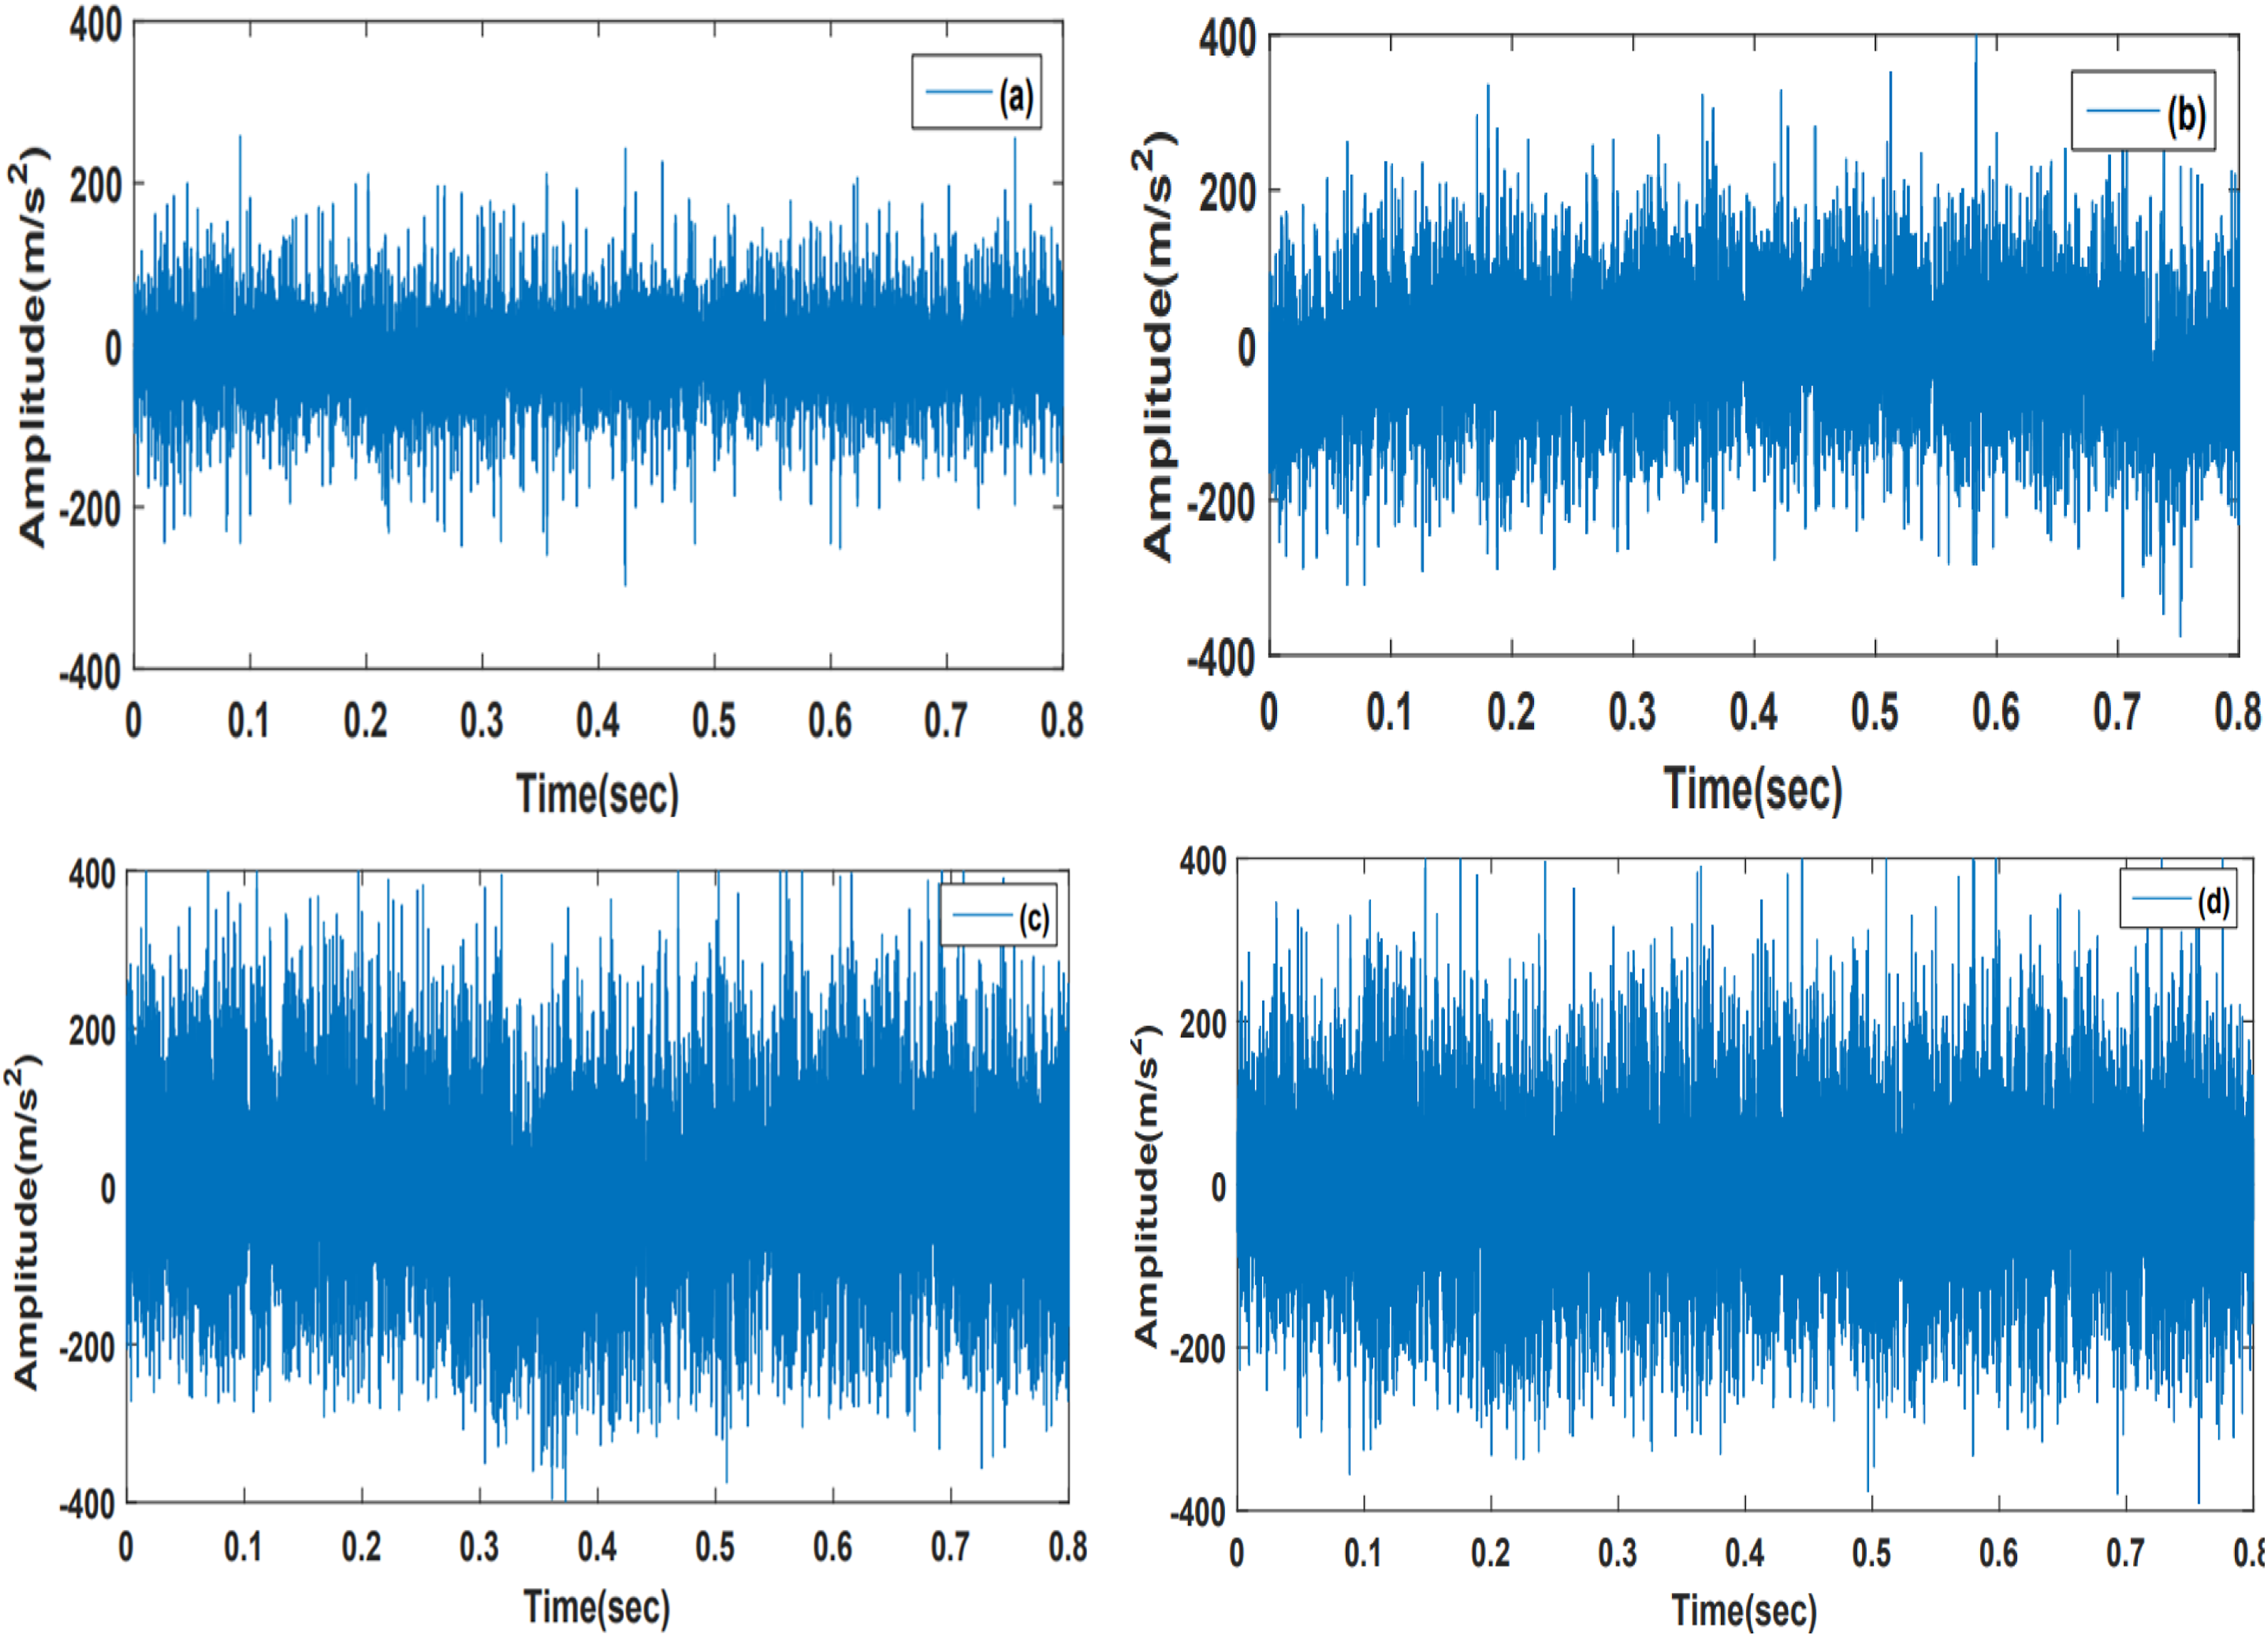
The four conditions of bevel gears used to identify the fault of the gearbox are shown in Figure 3. One gear was taken as the normal condition, free of flaws. An electrical discharge machine (EDM) on the bevel gearbox was used to simulate faults in other gears to control the defect’s magnitude. Conventional gearbox test rigs reported in the literature are primarily designed for general-purpose fault studies predominantly focusing on spur or planetary gear systems under limited fault conditions. The proposed MFS is specifically engineered to address controlled, fault diagnosis in bevel gear systems, which inherently exhibit more complex kinematics, contact patterns, and vibration signatures. A key differentiating aspect of the proposed MFS is its ability to facilitate precisely controlled and repeatable fault induction using EDM. The vibrational signals were extracted from the accelerometer mounted on the test rig. After the faults were introduced, vibration data were captured from the bevel gearbox over time. Using 25.6 kHz as the sampling frequency and a sample length of 12800 is chosen for all conditions at 30 N and 750 r/min, and each sample is collected for 0.8 s. Therefore, each data set contains 20,640 samples, and there are 30 data sets in total. Hence, 619200 samples were obtained from healthy individuals with other conditions. This way, 2476800 datasets were obtained for healthy and simulated faulty gears. The proposed framework incorporates EMD, which is specifically designed to analyze non-stationary and nonlinear signals. Unlike conventional signal processing techniques, EMD adaptively decomposes vibration signals into IMFs, making it inherently suitable for handling variations in operating conditions such as speed and load. The amplitudes of the time-domain responses of the vibration signals are shown in Figure 4 under healthy and faulty conditions at a 30 N load and 750 r/min. Bevel gearbox conditions (a) Normal gear (b) Tooth breakage(c) Tooth pitting (d) Worn-out. Amplitude response of vibration signals at 750 r/min and 30 N for different gearbox conditions.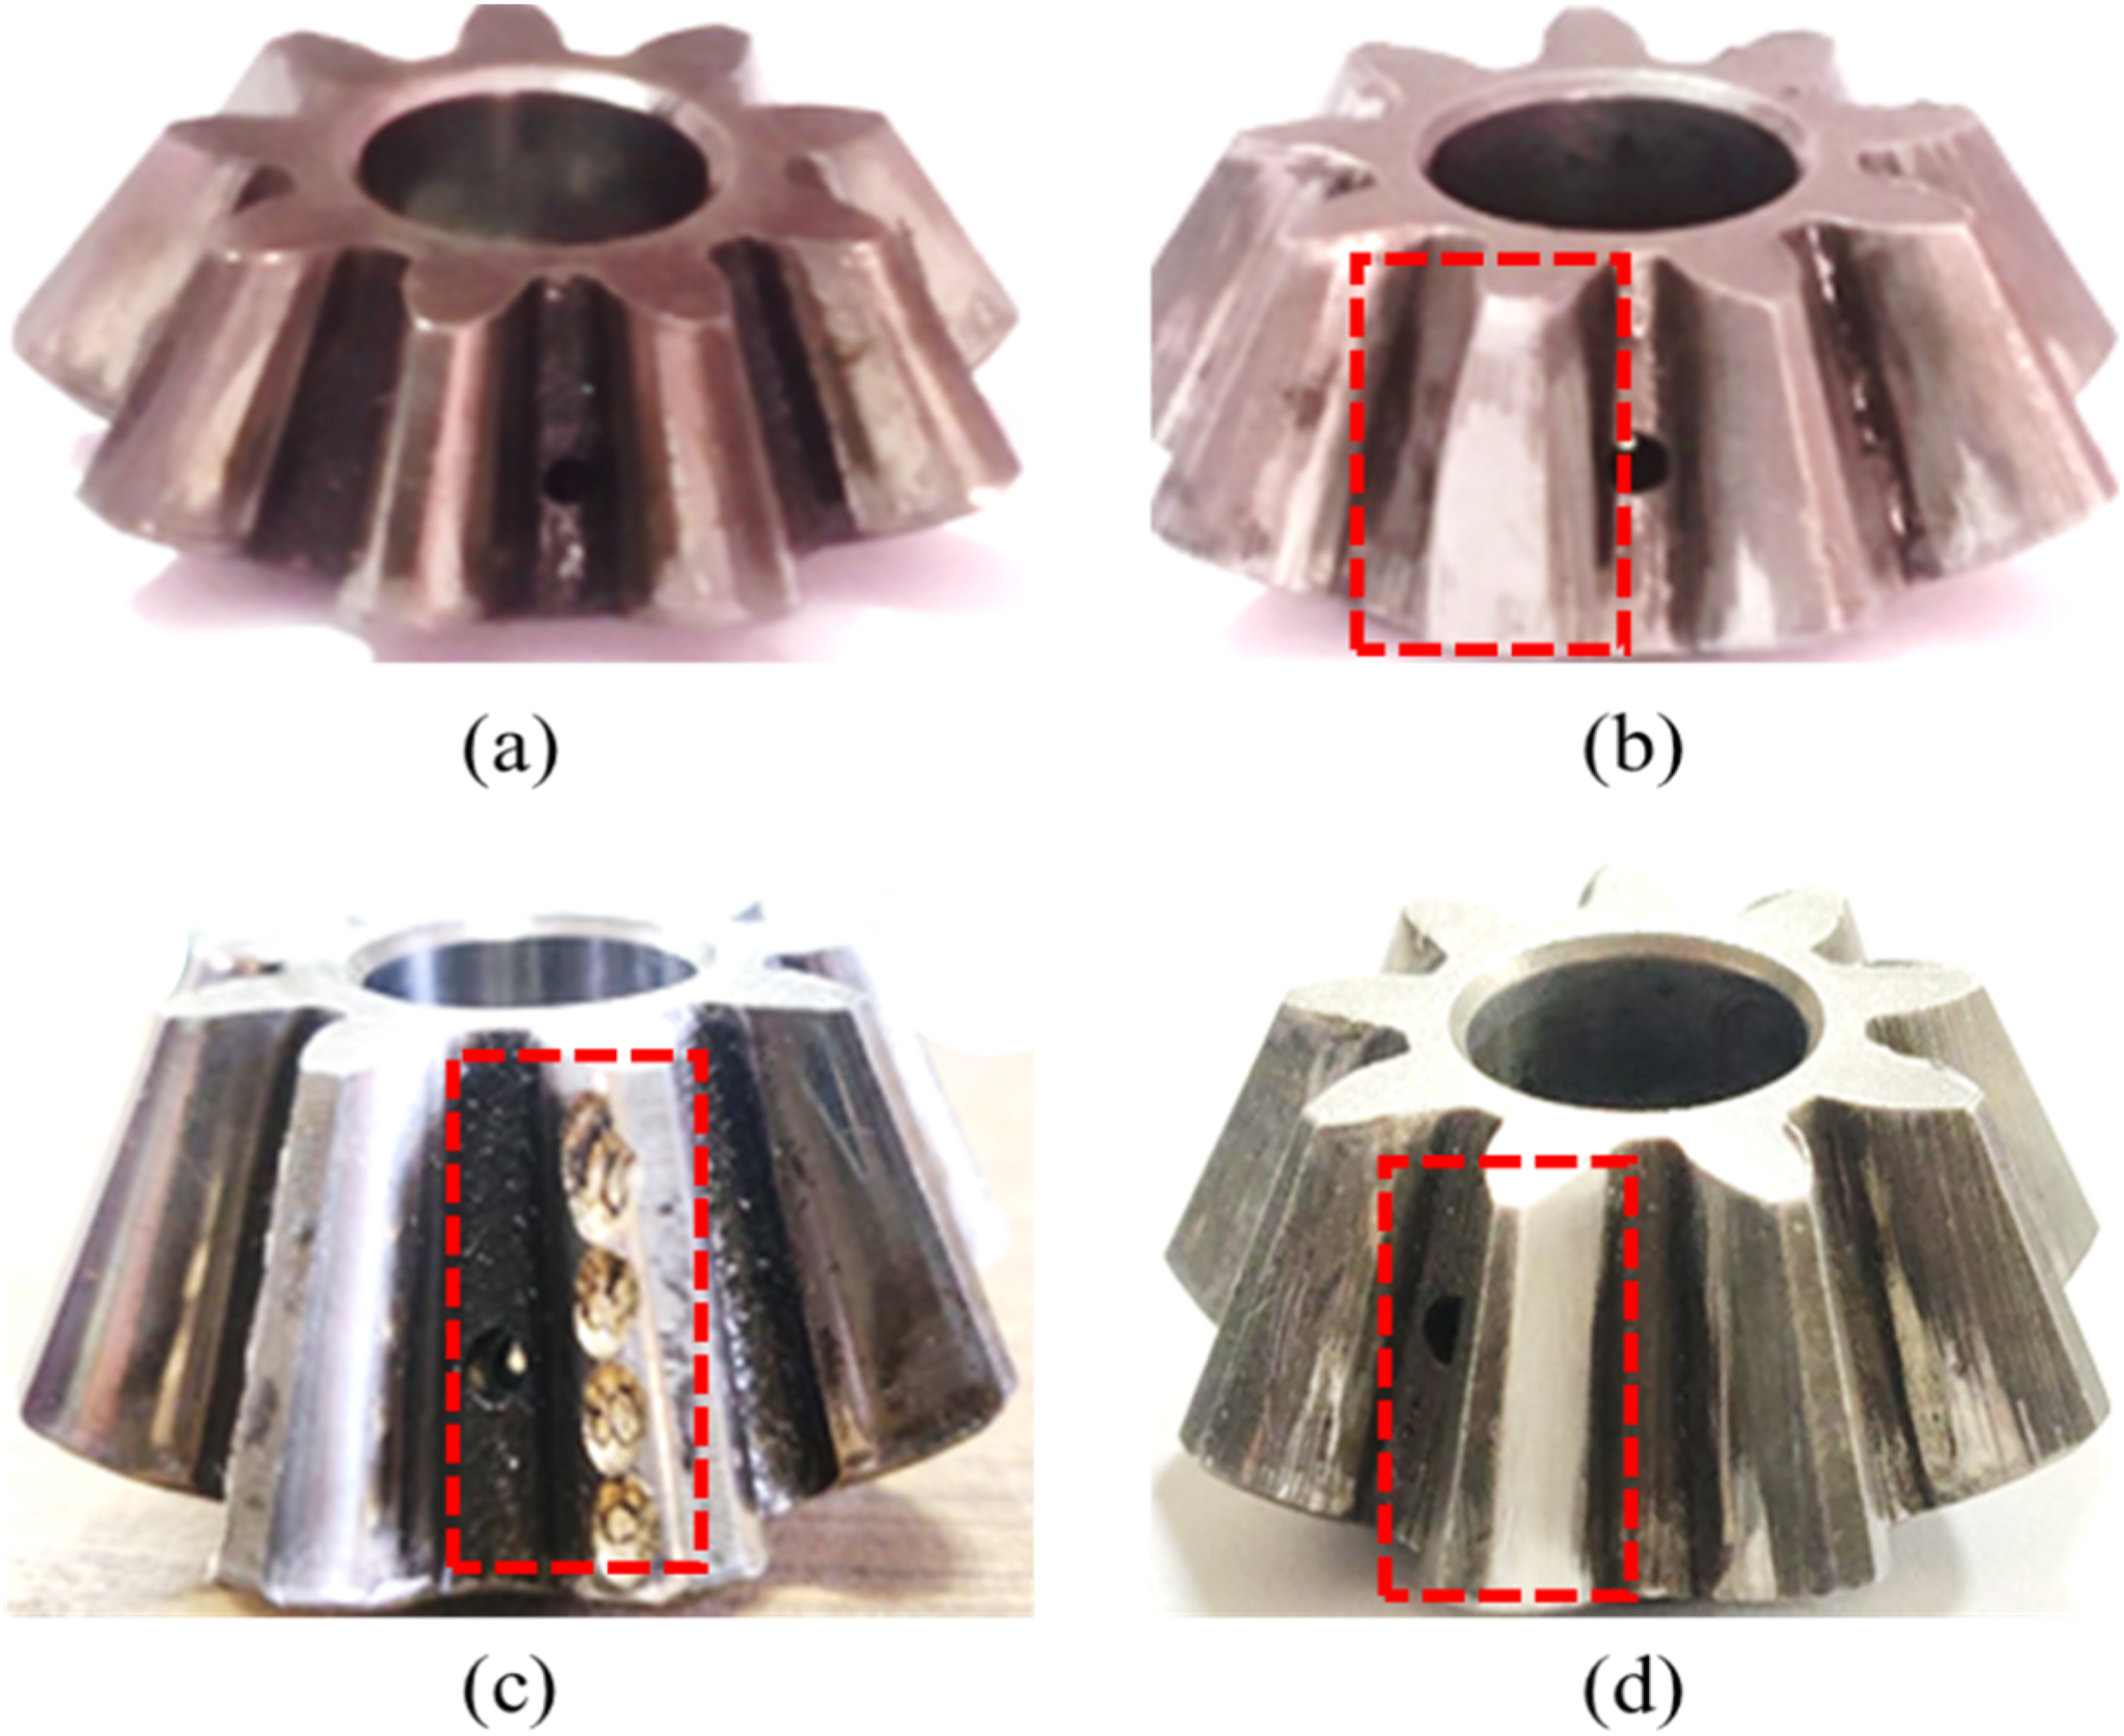
Fault diagnosis techniques
Random forest (RF)
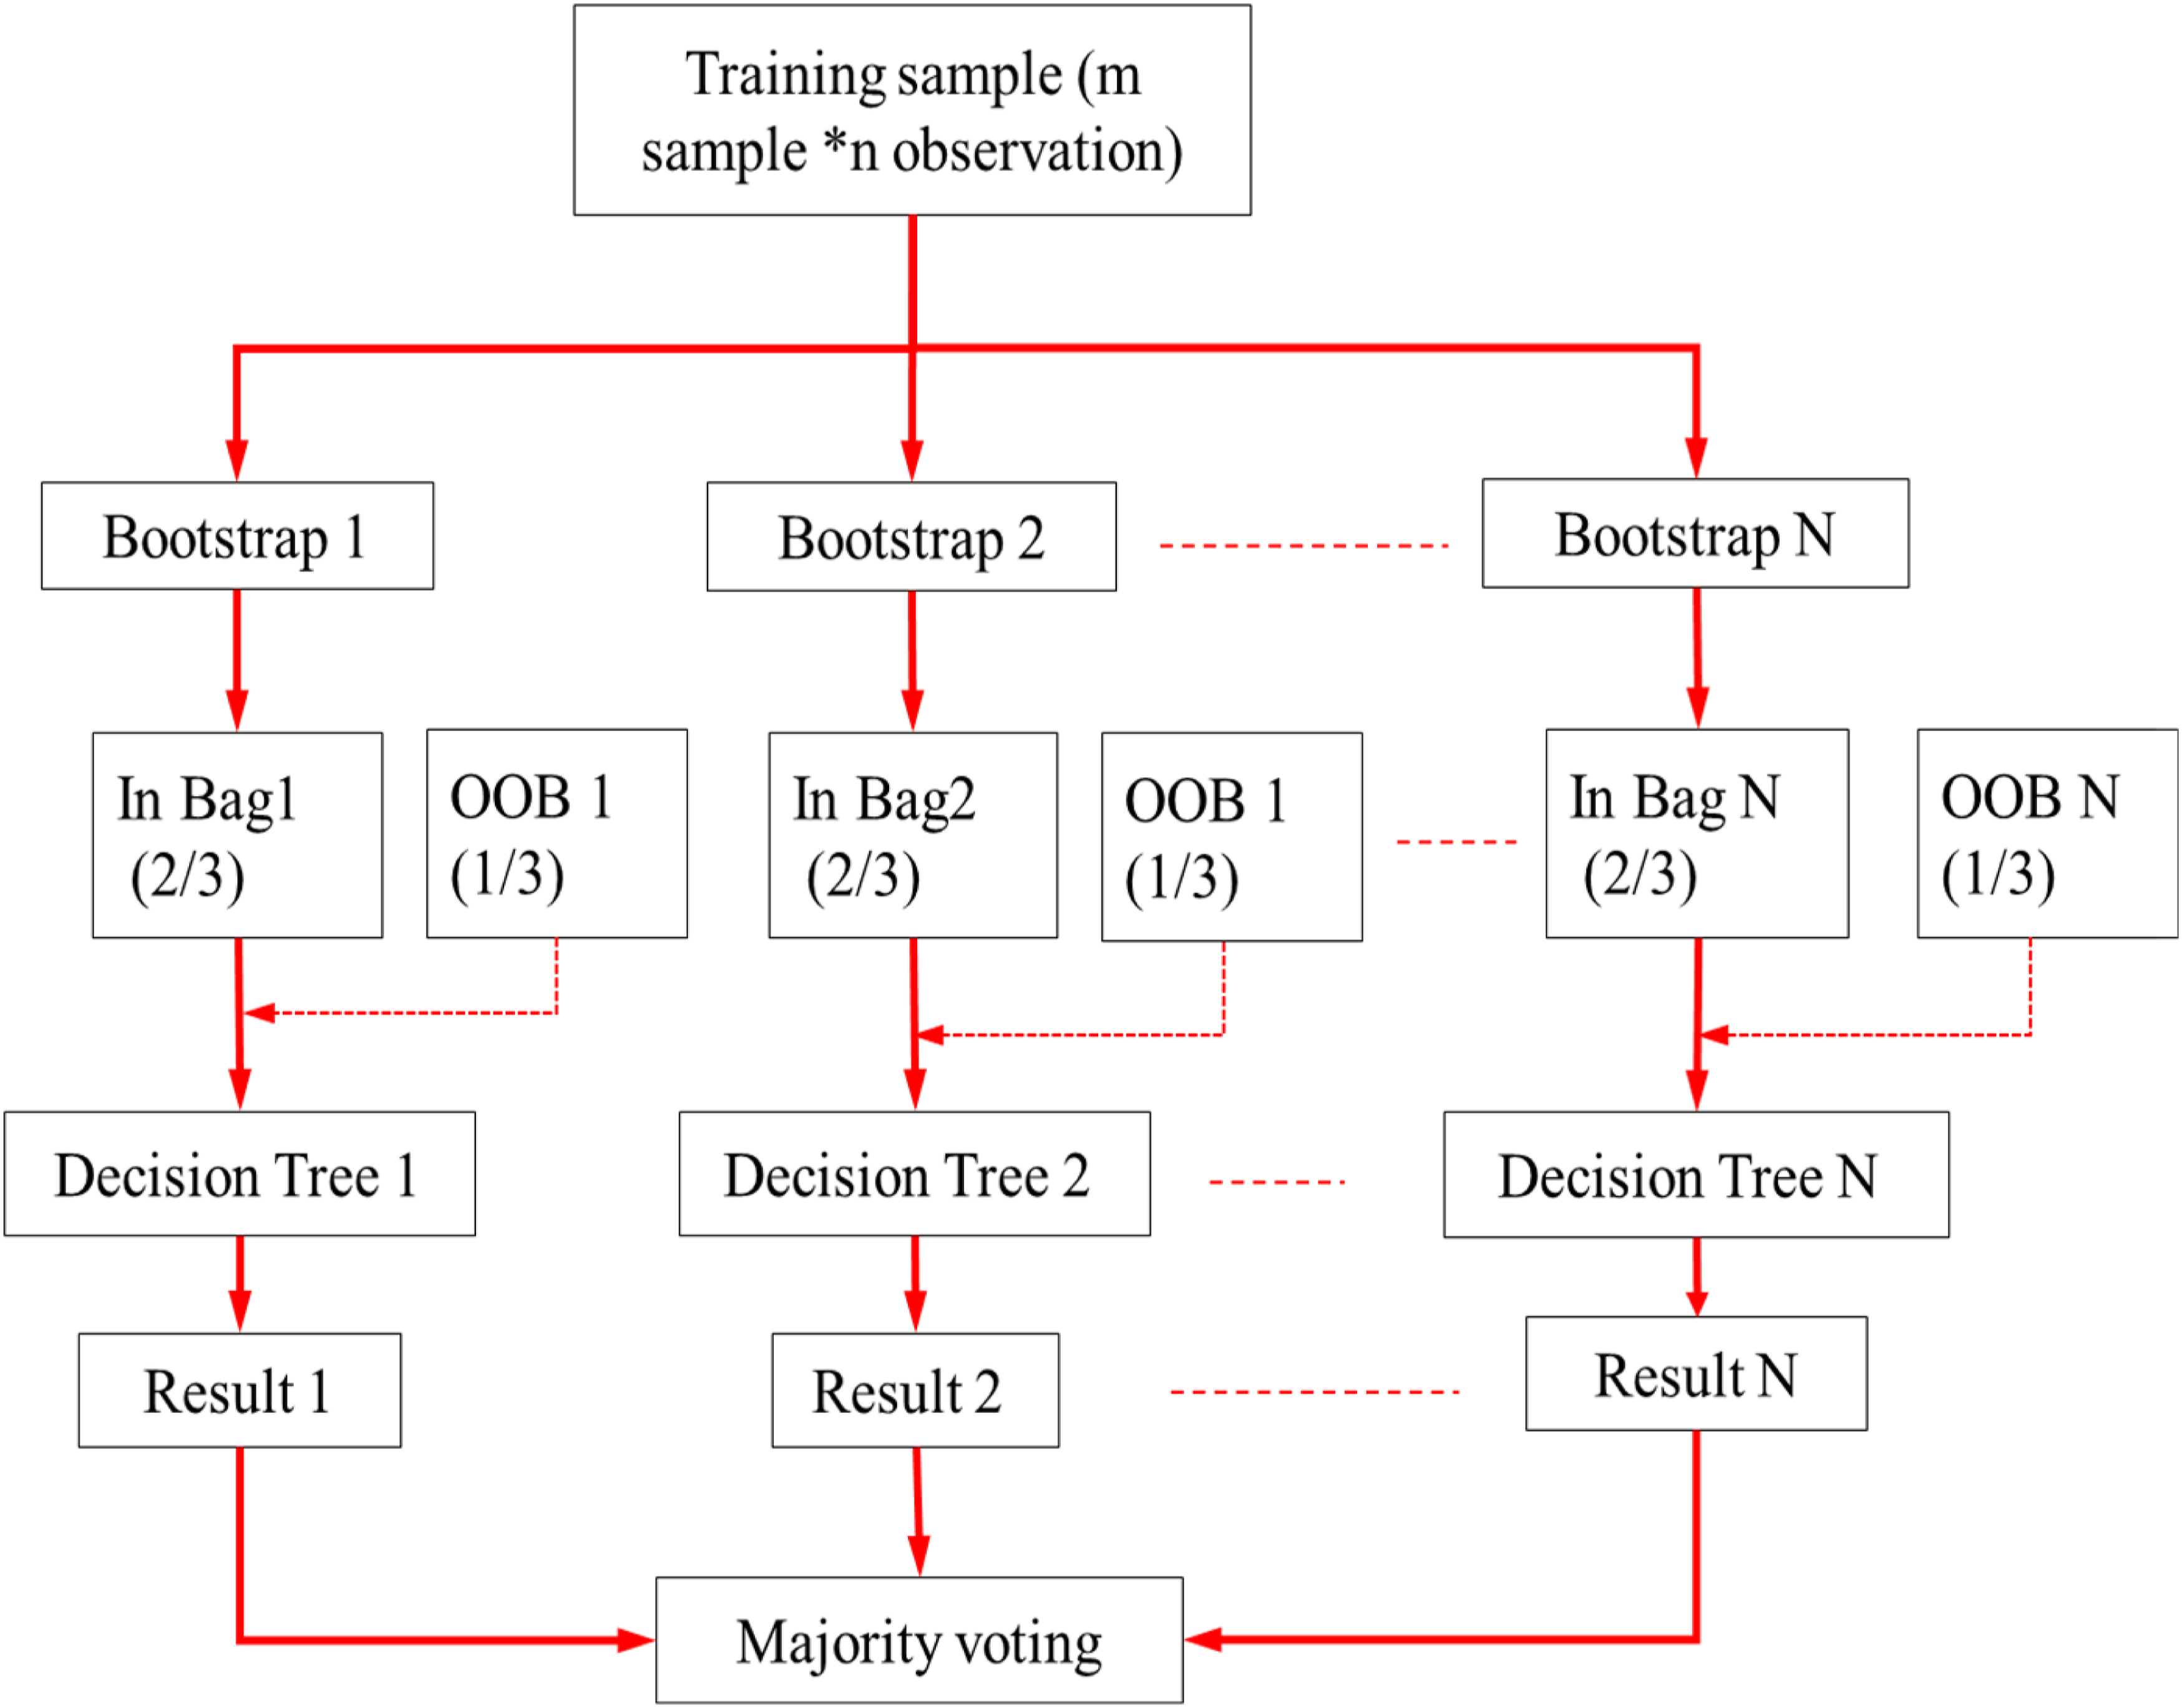
The RF approach is an ensemble learning method for supervised classification that manages the mixture of different decision classifiers and reaches a final decision by a majority of votes. Leo Breiman and Adele Cutler first invented the RF technique in 2001. Depending on the different types of applications, the execution of a single classifier often varies. Therefore, to increase the classification accuracy of a single classifier, the researcher suggested the ensemble learning technique.23,24 The RF technique’s flow chart is shown in Figure 5, and the following are the detailed steps of RF
25
: • Using the bootstrap procedure, take a random sample from the training dataset of n observations and m functions. For each bootstrap, which is bagging data, almost 2/3 of training data is used to create data. The remaining 1/3 of the data is called Out-of-Bag (OOB) data, which is used to obtain the tree’s error rate. • Create a decision tree for each bootstrap sample with the following change: initially, randomly pick a subset of m features for each node. Then pick an outstanding split mode. No pruning is performed in the increasing method, • To create a forest, that is, a set of trees, repeat the above steps. • The test dataset was fed into the RF algorithm, and the outputs from the N trees were collected. The final decision is adopted by a plurality of the votes cast. Flow diagram of RF techniques.
Artificial neural network (ANN)
ANNs are influenced by the human brain and biological learning process. ANNs are mostly a connected array of elements known as neurons.26,27 They process the information as a parallel distributed network. In this work, multilayer perceptron (MLP) neural networks-the most popular kind of ANN-are utilized. An input layer of source nodes, an output layer, and one or more hidden layers of computation nodes, or “neurones,” make up MLPs. The number of nodes in the input and output layers is influenced by the number of input and output variables. The number of hidden layers and nodes in each hidden layer affects a network’s ability to generalize. The performance could not be adequate if there are fewer hidden layers and neurons. However, if there are too many hidden nodes, the training data may be overfitted, which would lead to poor generalization on the new data. Figure 6 shows a typical three-layer MLP design, Finding the connection weight values that minimize an error function between the target values in the training set and the network’s actual output is how an MLP network is trained. Back-propagation is the foundation of the most widely used training techniques, and mean square error (MSE) is one of the often used error functions. Nodes in the input layer reflected the normalized properties extracted from the measured vibration signals. The ANN was developed, trained, and implemented using back-propagation and the Levenberg-Marquardt training technique. The ANN was trained iteratively to reduce the mean square error (MSE) between the network outputs and the corresponding target values. The gradient of the performance function (MSE) was used to adjust the network weights and biases at each iteration. This study used an MSE of 10−6, a minimum gradient of 10−10, and a maximum iteration number (epoch) of 500. The training would stop if any of these conditions were met. The network’s initial weights and biases were automatically generated by the algorithm. ANN preparation requires the adjustment of weights and biases to minimise the mean square error.
28
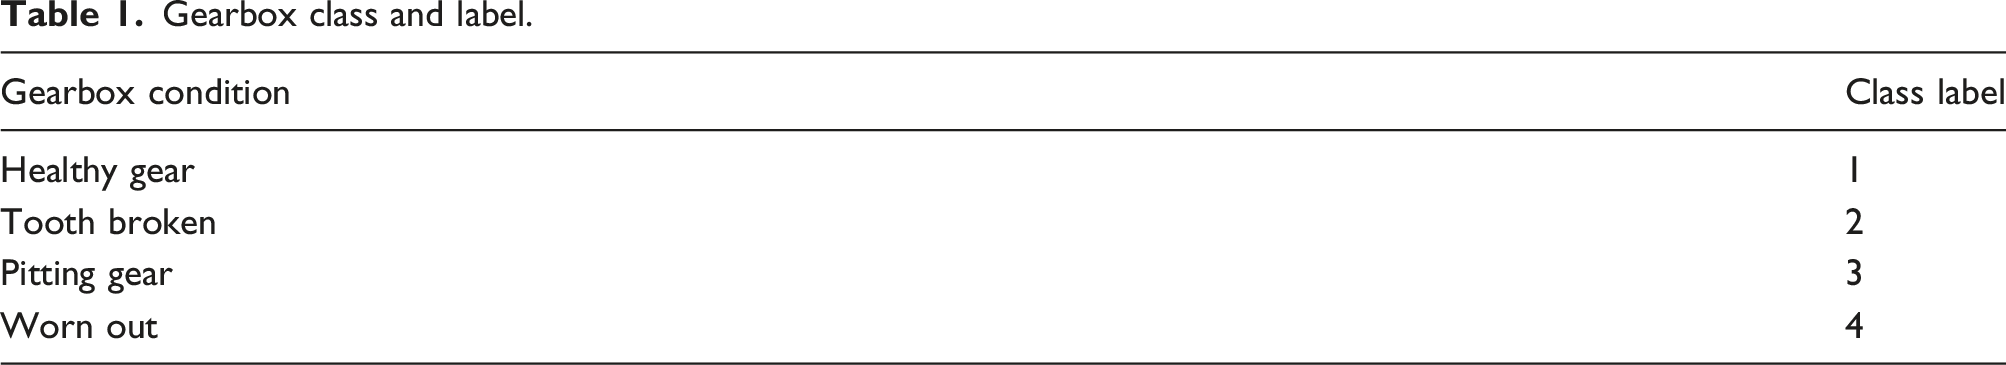
The raw vibration signals from the piezoelectric accelerometer are taken under Normal, Tooth breakage, Worn-out and Tooth crack condition labels as shown in Table 1. ANN architecture model. Gearbox class and label.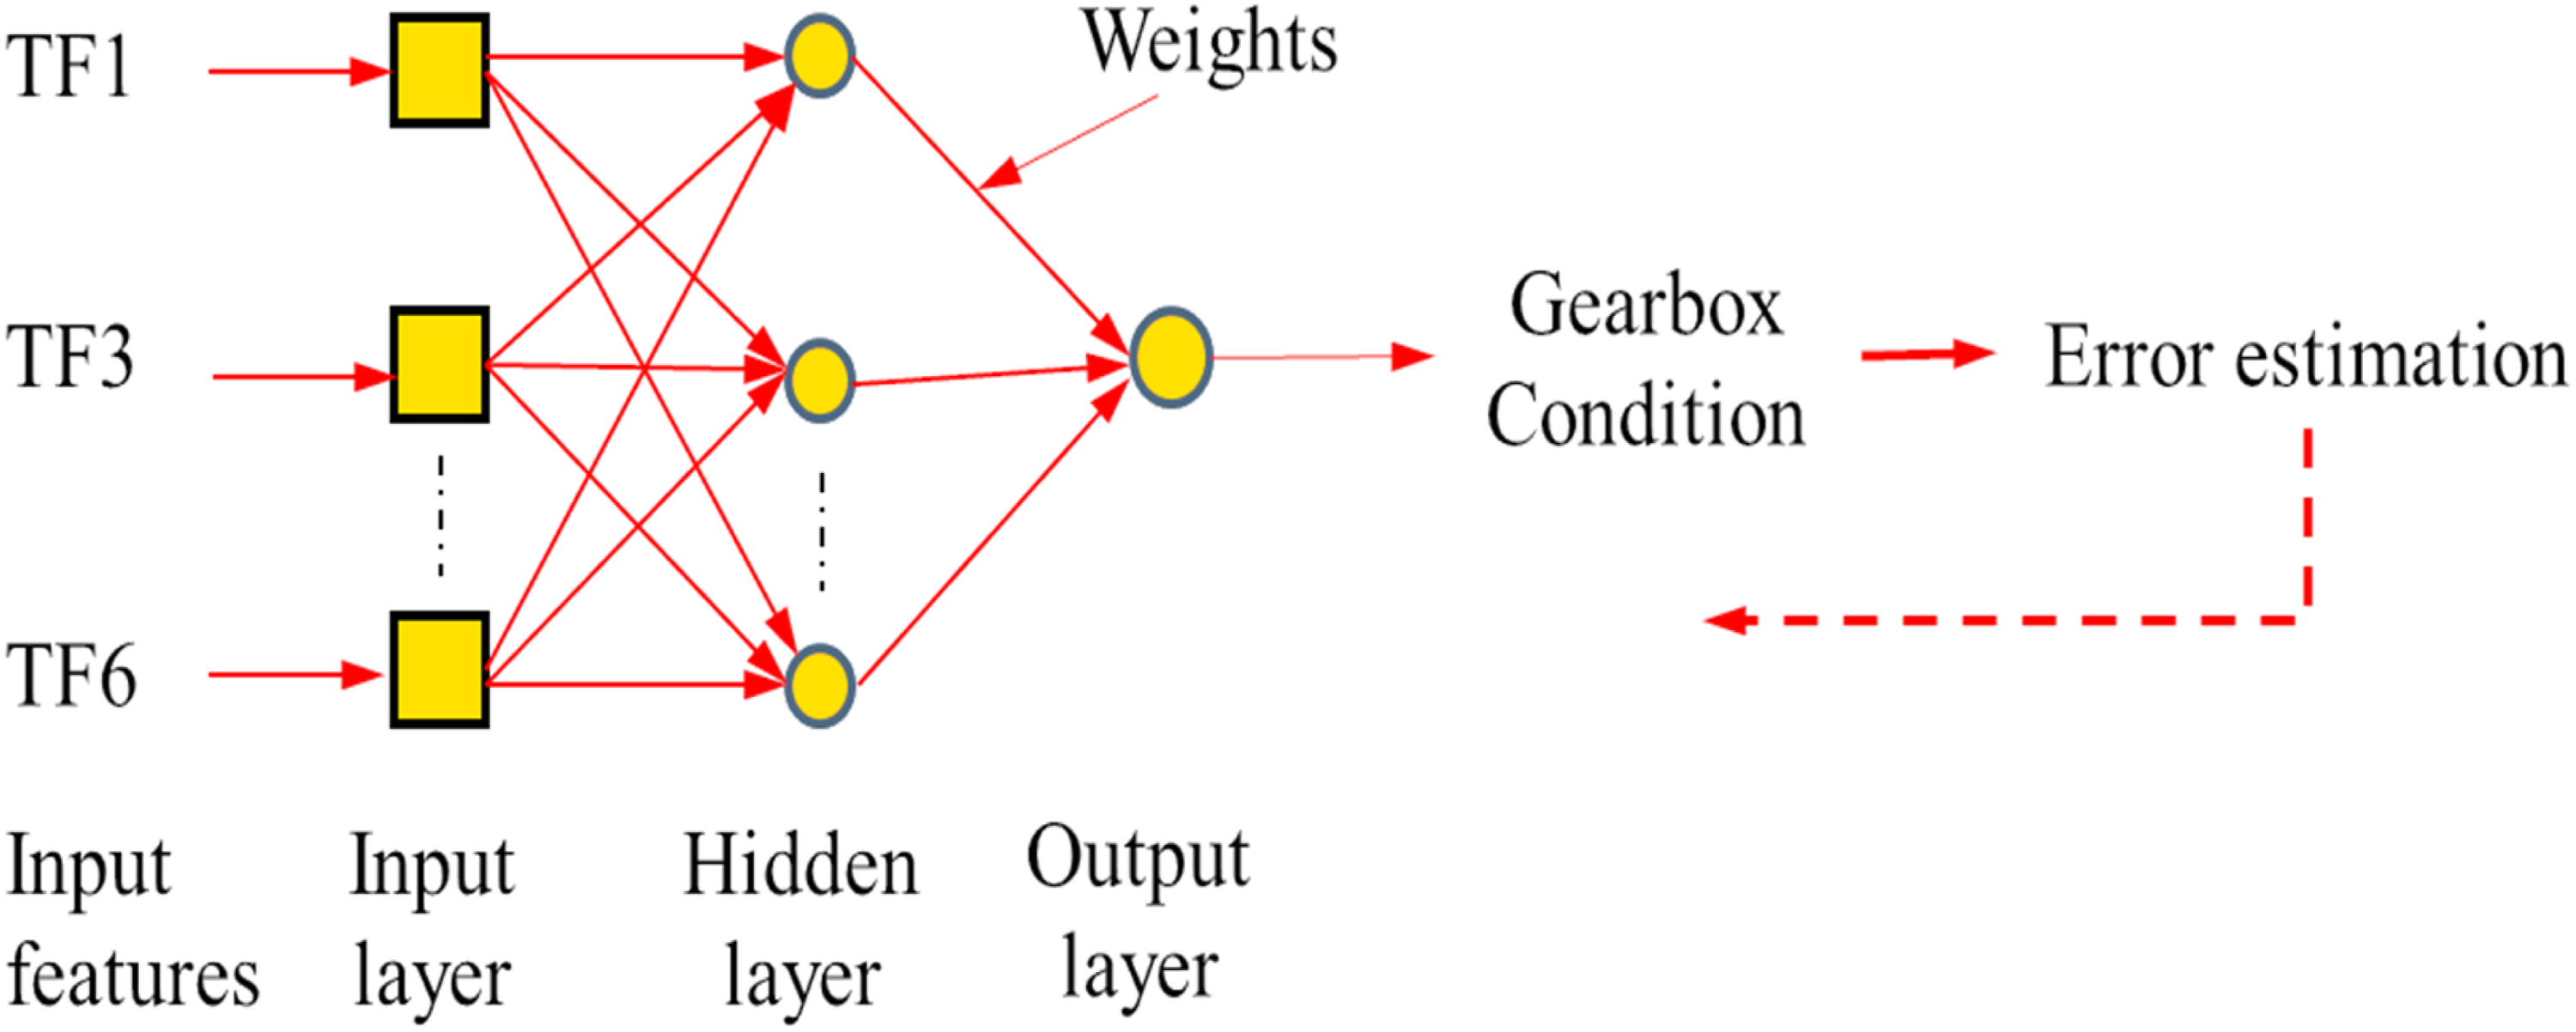
Empirical mode decomposition (EMD)
EMD is the process of pre-processing and breaking down any complex experiment dataset into a limited number of segments. EMD merely breaks down a non-stationary signal into a few IMFs. A function that meets the next two requirements is called an IMF.
29
The mode mixing is a well-known limitation of standard EMD that its discussion is essential for a comprehensive methodological presentation.Mode mixing refers to the phenomenon where a single IMF may contain oscillations of widely disparate scales, or similar oscillations may appear across multiple IMFs. This issue can reduce the physical interpretability of IMFs and may affect the robustness of feature extraction, particularly in the presence of noise or closely spaced frequency components. In the present study, although standard EMD is employed, the impact of mode mixing is partially mitigated through controlled experimental conditions and subsequent feature extraction procedures. standard EMD was intentionally selected as a baseline decomposition technique due to its simplicity, computational efficiency, and well-established applicability for analyzing nonlinear and non-stationary vibration signals. • The number of extremes of the IMF and the number of zero crossings must either be equal to or, at most, vary from one. • The mean value of the envelope defined by the local maximum and of the envelope defined by the local minimum shall be zero at any point in the IMF.
This technique decomposes the vibrational signal x(t) into a finite number of IMFs, each representing the signal’s local physical characteristics.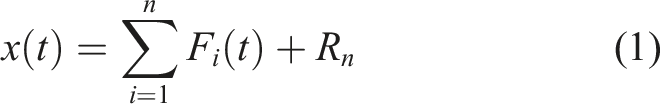
The step-wise definition of the algorithm is shown below 2 :
EMD algorithms
Step (1)
The upper and lower envelopes are collected from all the data points. The upper and lower envelope average is denoted as 
Step (2)
If
Step (3)
To be obtained 
The above steps 1 and 2 are repeated to obtain the second component
Decision tree
A decision tree is a flowchart-like structure in which nodes denote attributes, branches represent the outcomes of tests, and each leaf node characterises a classification. The pathway from roots to leaves symbolises the algorithm’s classification rule. A typical decision tree induced by ID3 or C4.5 comprises a number of branches, one root, a number of nodes, and a number of leaves, as shown in Figure 6. Information about the value of that attribute is provided by the existence of the attribute and its location in the tree. A decision tree is a technique for representing classification rules using a tree-based information structure. Most J48 algorithms (a WEKA C4.5 algorithm) are commonly used in decision-tree construction. For feature selection, a decision tree is used based on the following procedure: • The input to the algorithm is generated by a set of available features; the output is the Decision Tree. • There are leaf nodes representing class labels in the Decision Tree and other nodes aligned with the groups being graded. • The tree branches reflect any possible value of the function node they derive from. • By beginning at the root of the tree and going through it, the Decision Tree can be used to classify feature vectors until a leaf node that provides a classification of the case is found. • The most useful function for classification can be selected at each decision node in the Decision Tree using acceptable estimation criteria.
The framework used to define the best function provokes, as stated by Sugumaran et al., the principles of entropy reduction and data gain. 30
Information gain with entropy reduction
In order to evaluate the relation between outputs and inputs, information gain is employed. The expected decrease in entropy caused by separating the examples according to the given function is information gain. It evaluates how the training examples are differentiated according to their target classification by a given attribute.
Information gain (D, A) for attribute ‘A’ relative to a set of data Instances S is described as follows31,32: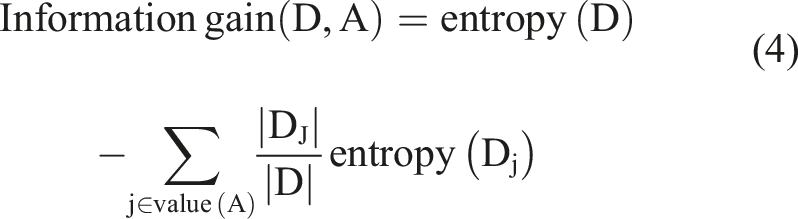
Entropy is provided by the interaction.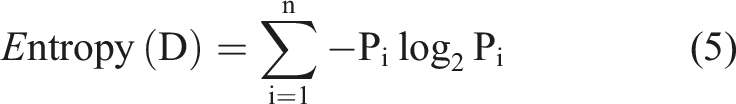
Features extraction
Statistical feature and mathematical expression.
Where Yn is the magnitude of the vibration signal at the n th data point, MAV refers to Mean Absolute Value is usually a time-domain statistical measure that shows the average of the vibration signal’s absolute values over a given time period and N is the total number of samples.
Results and discussions
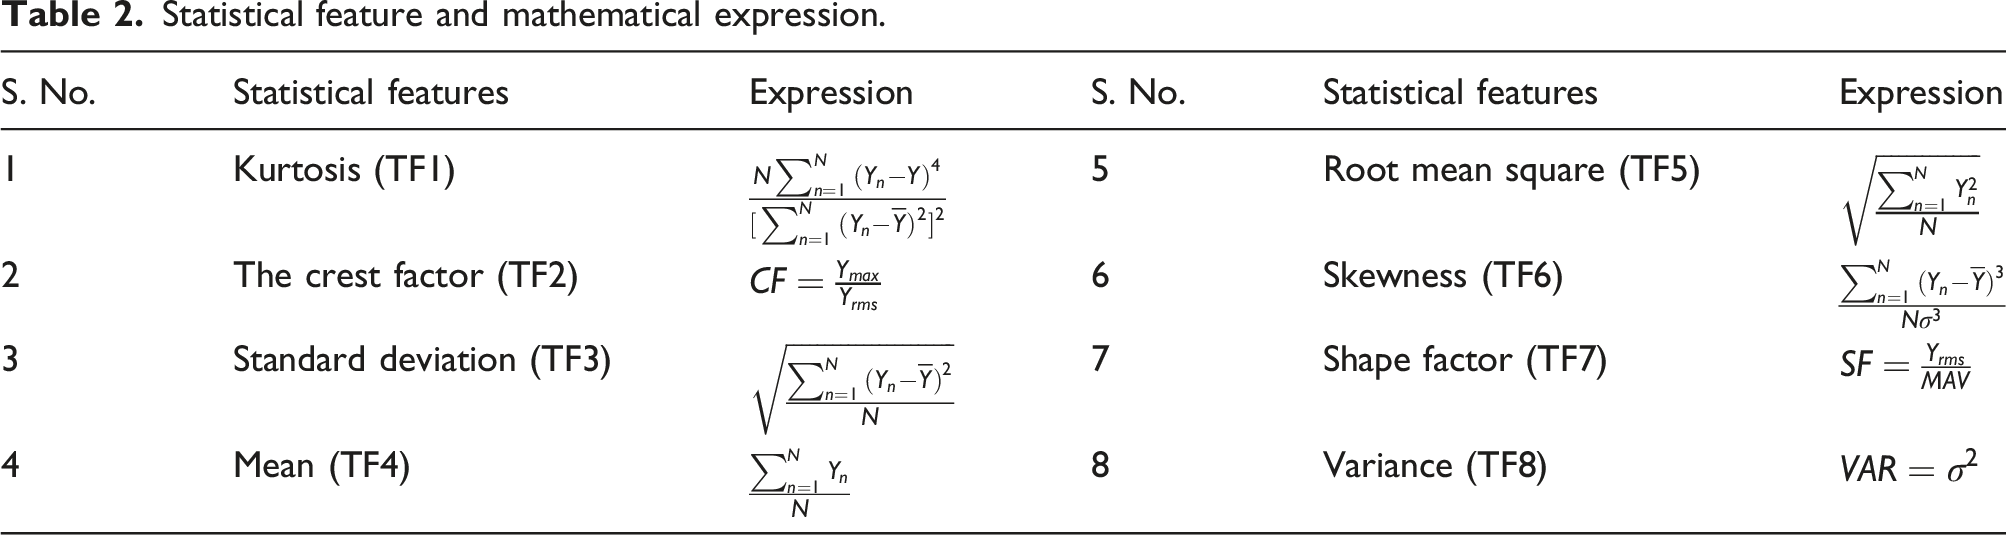
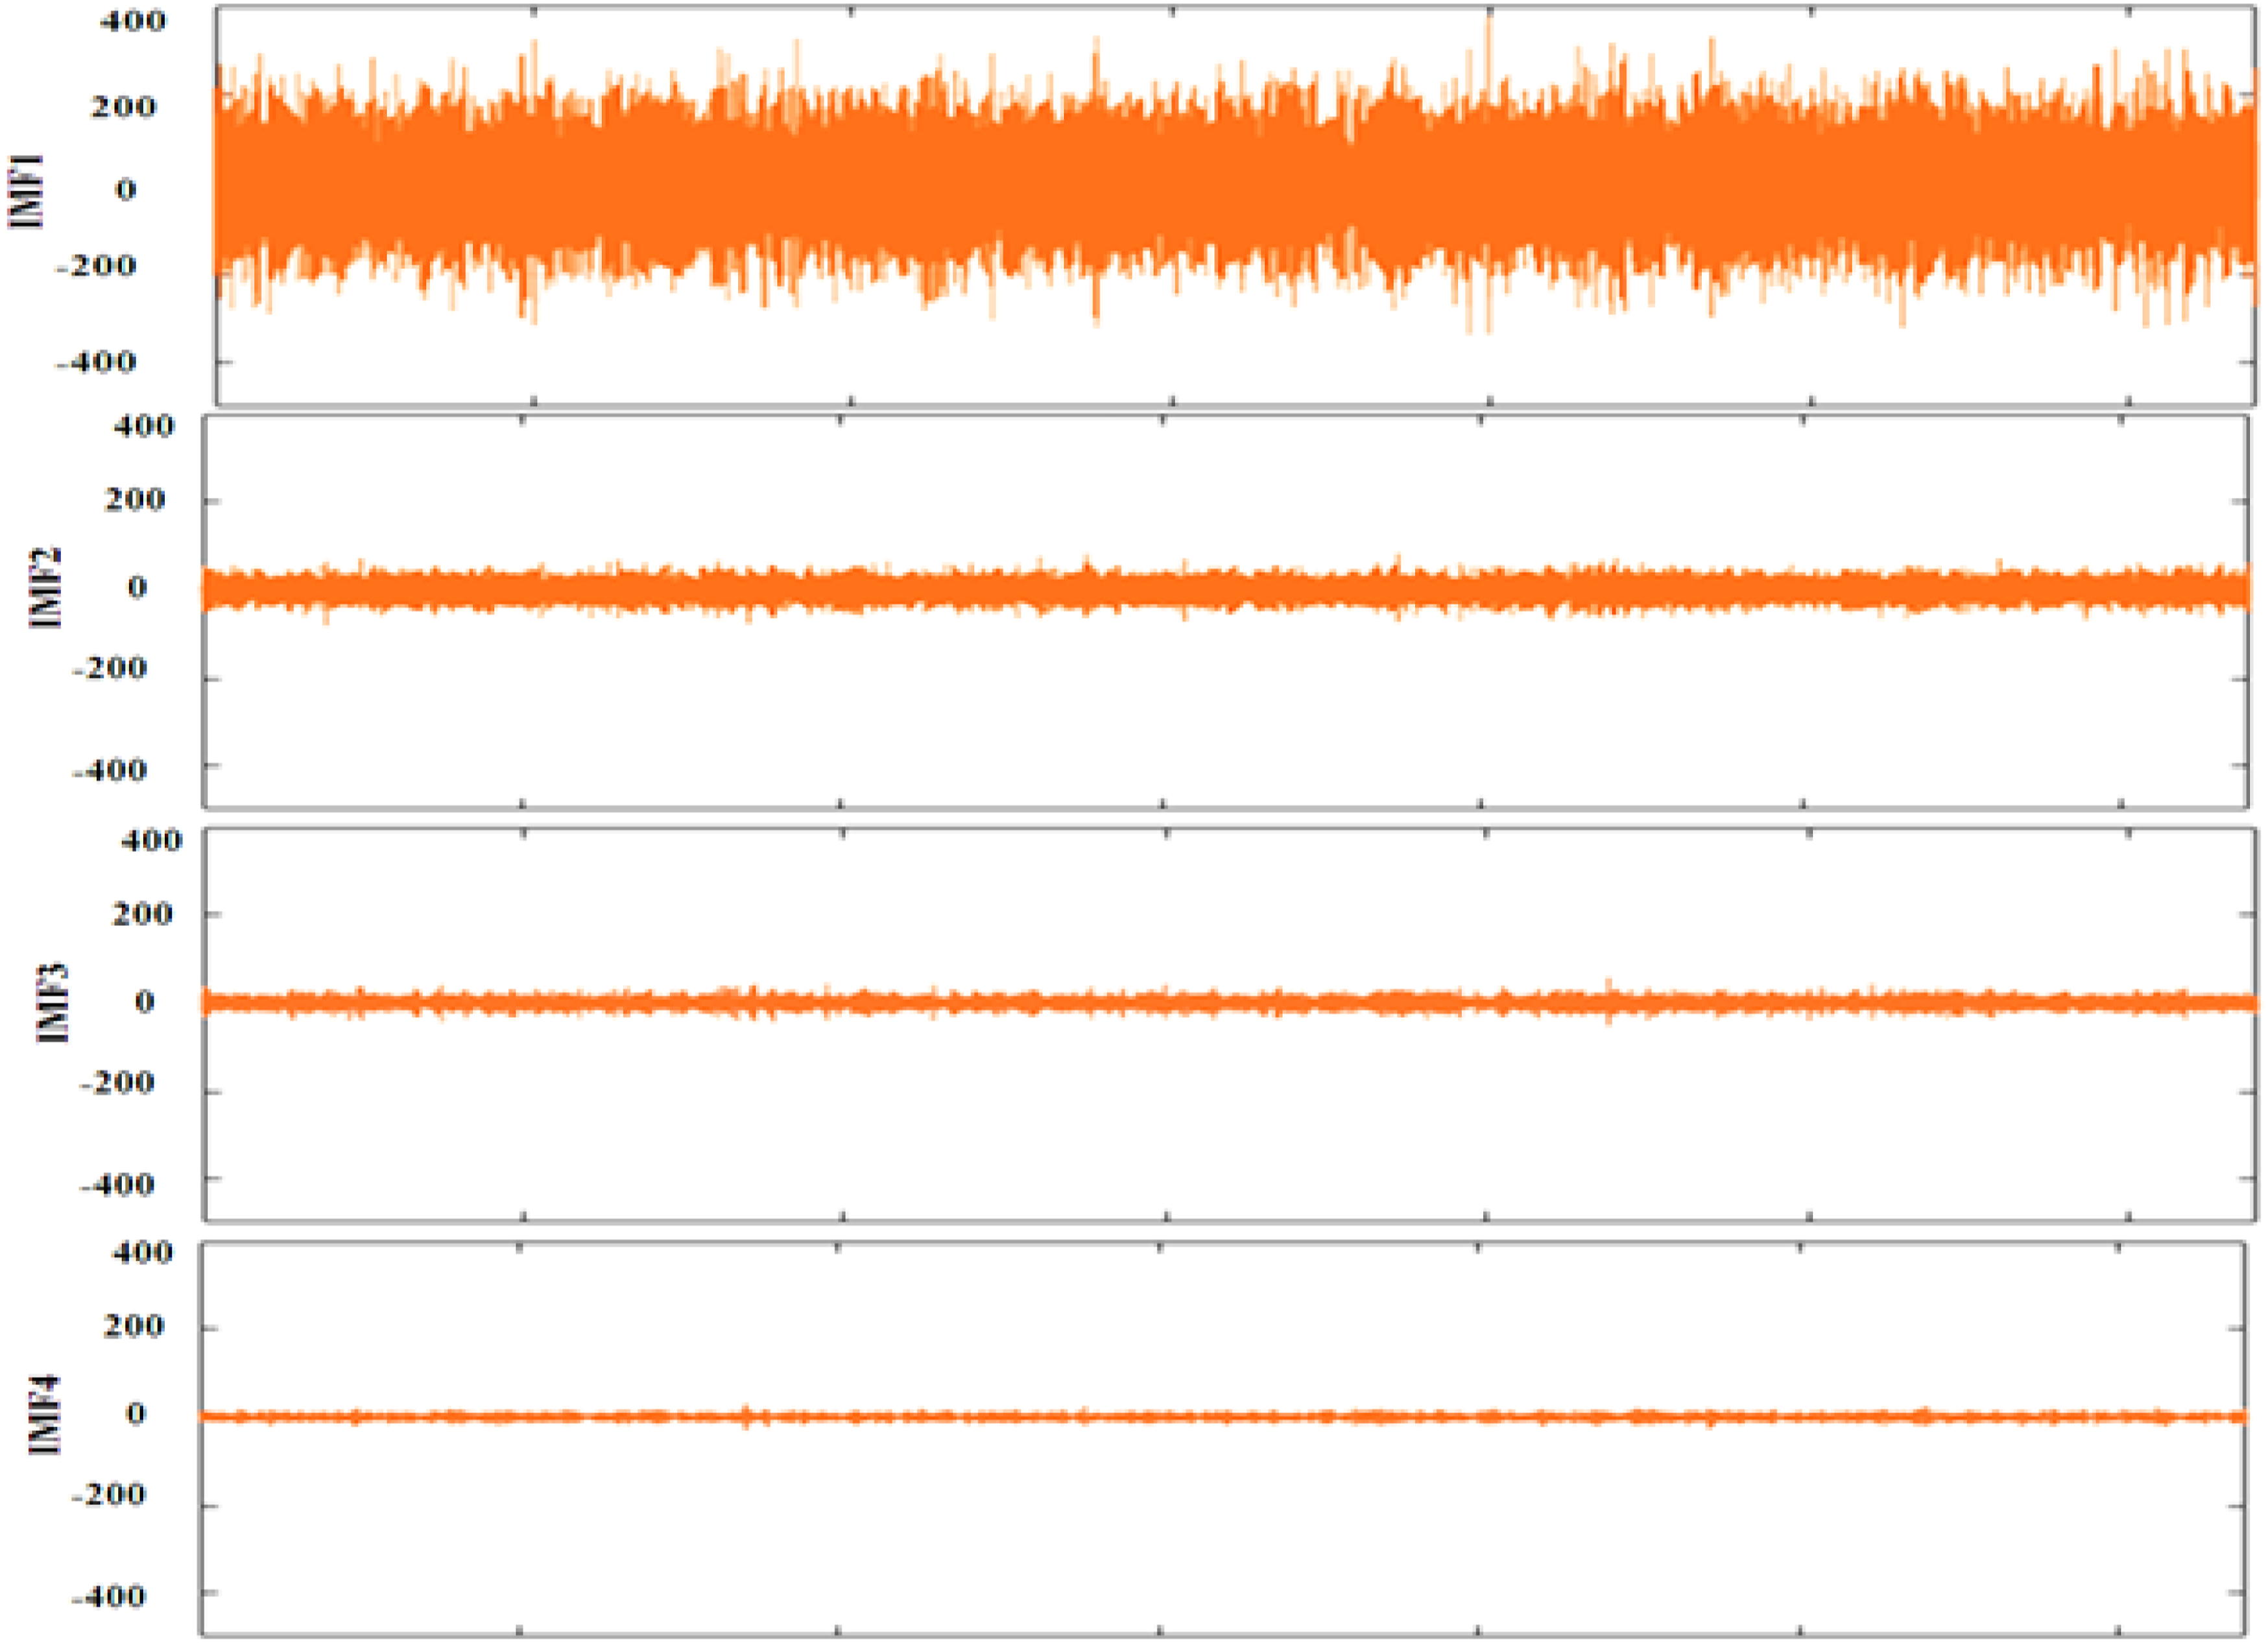
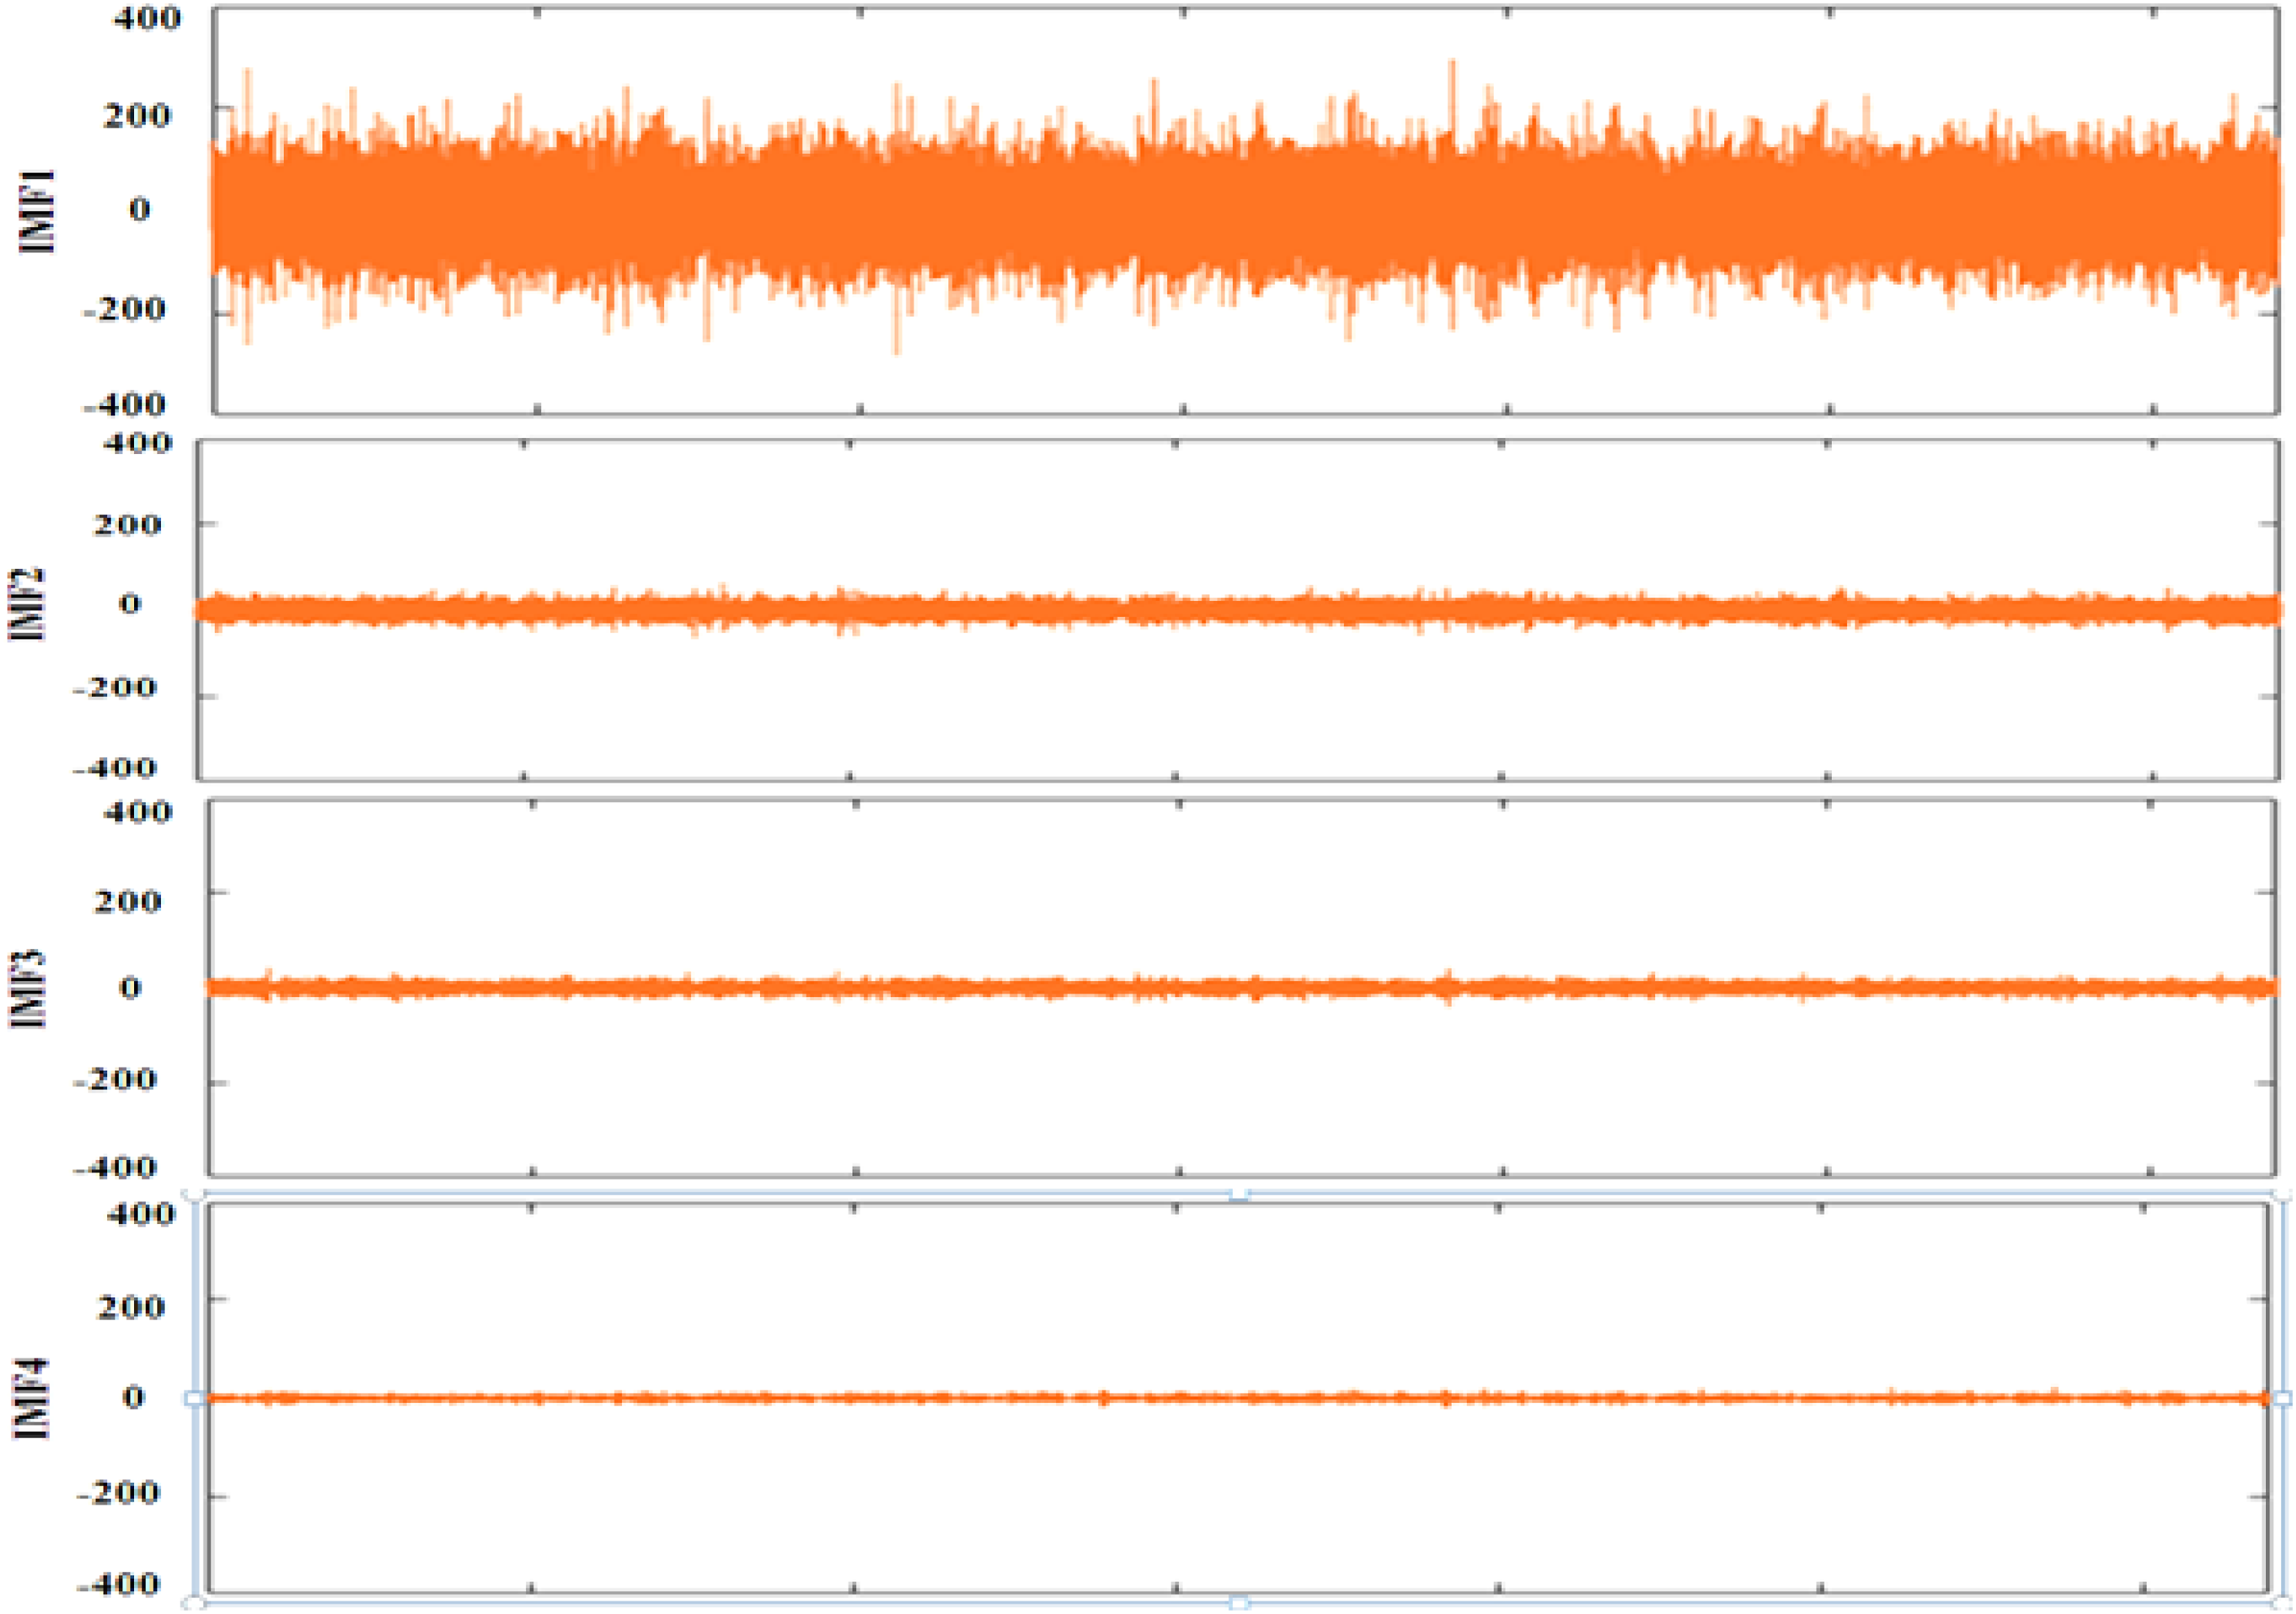
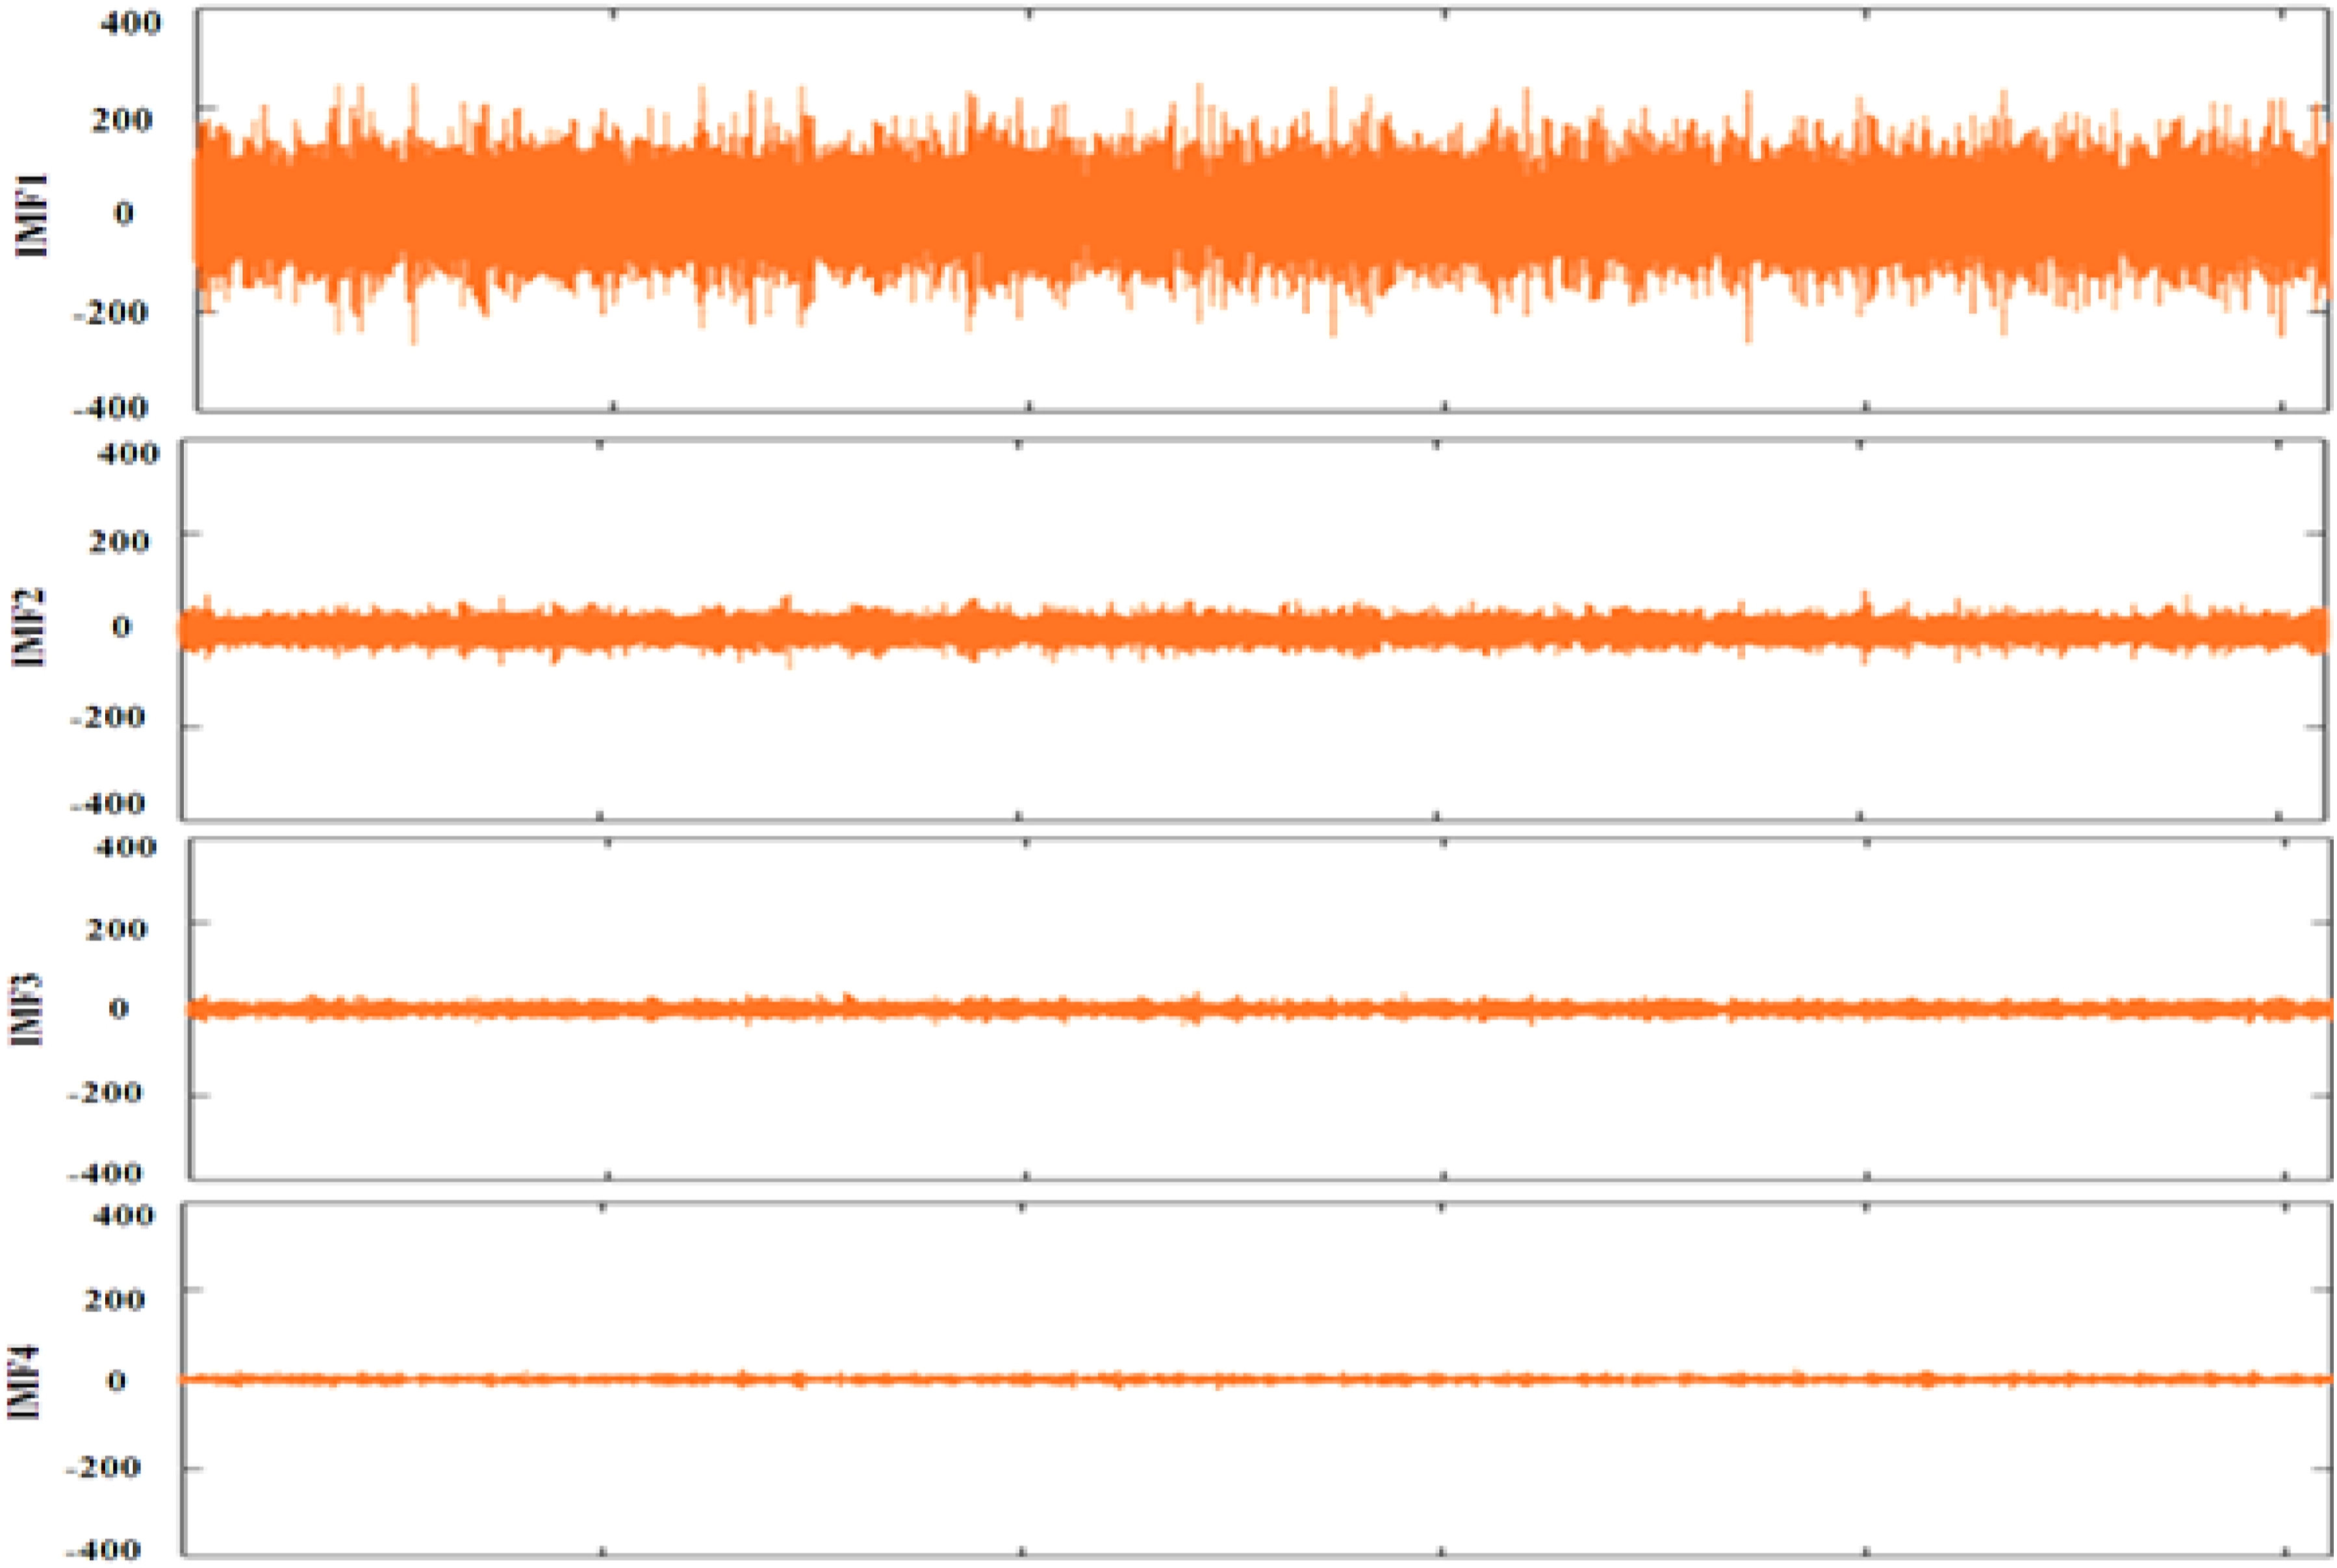
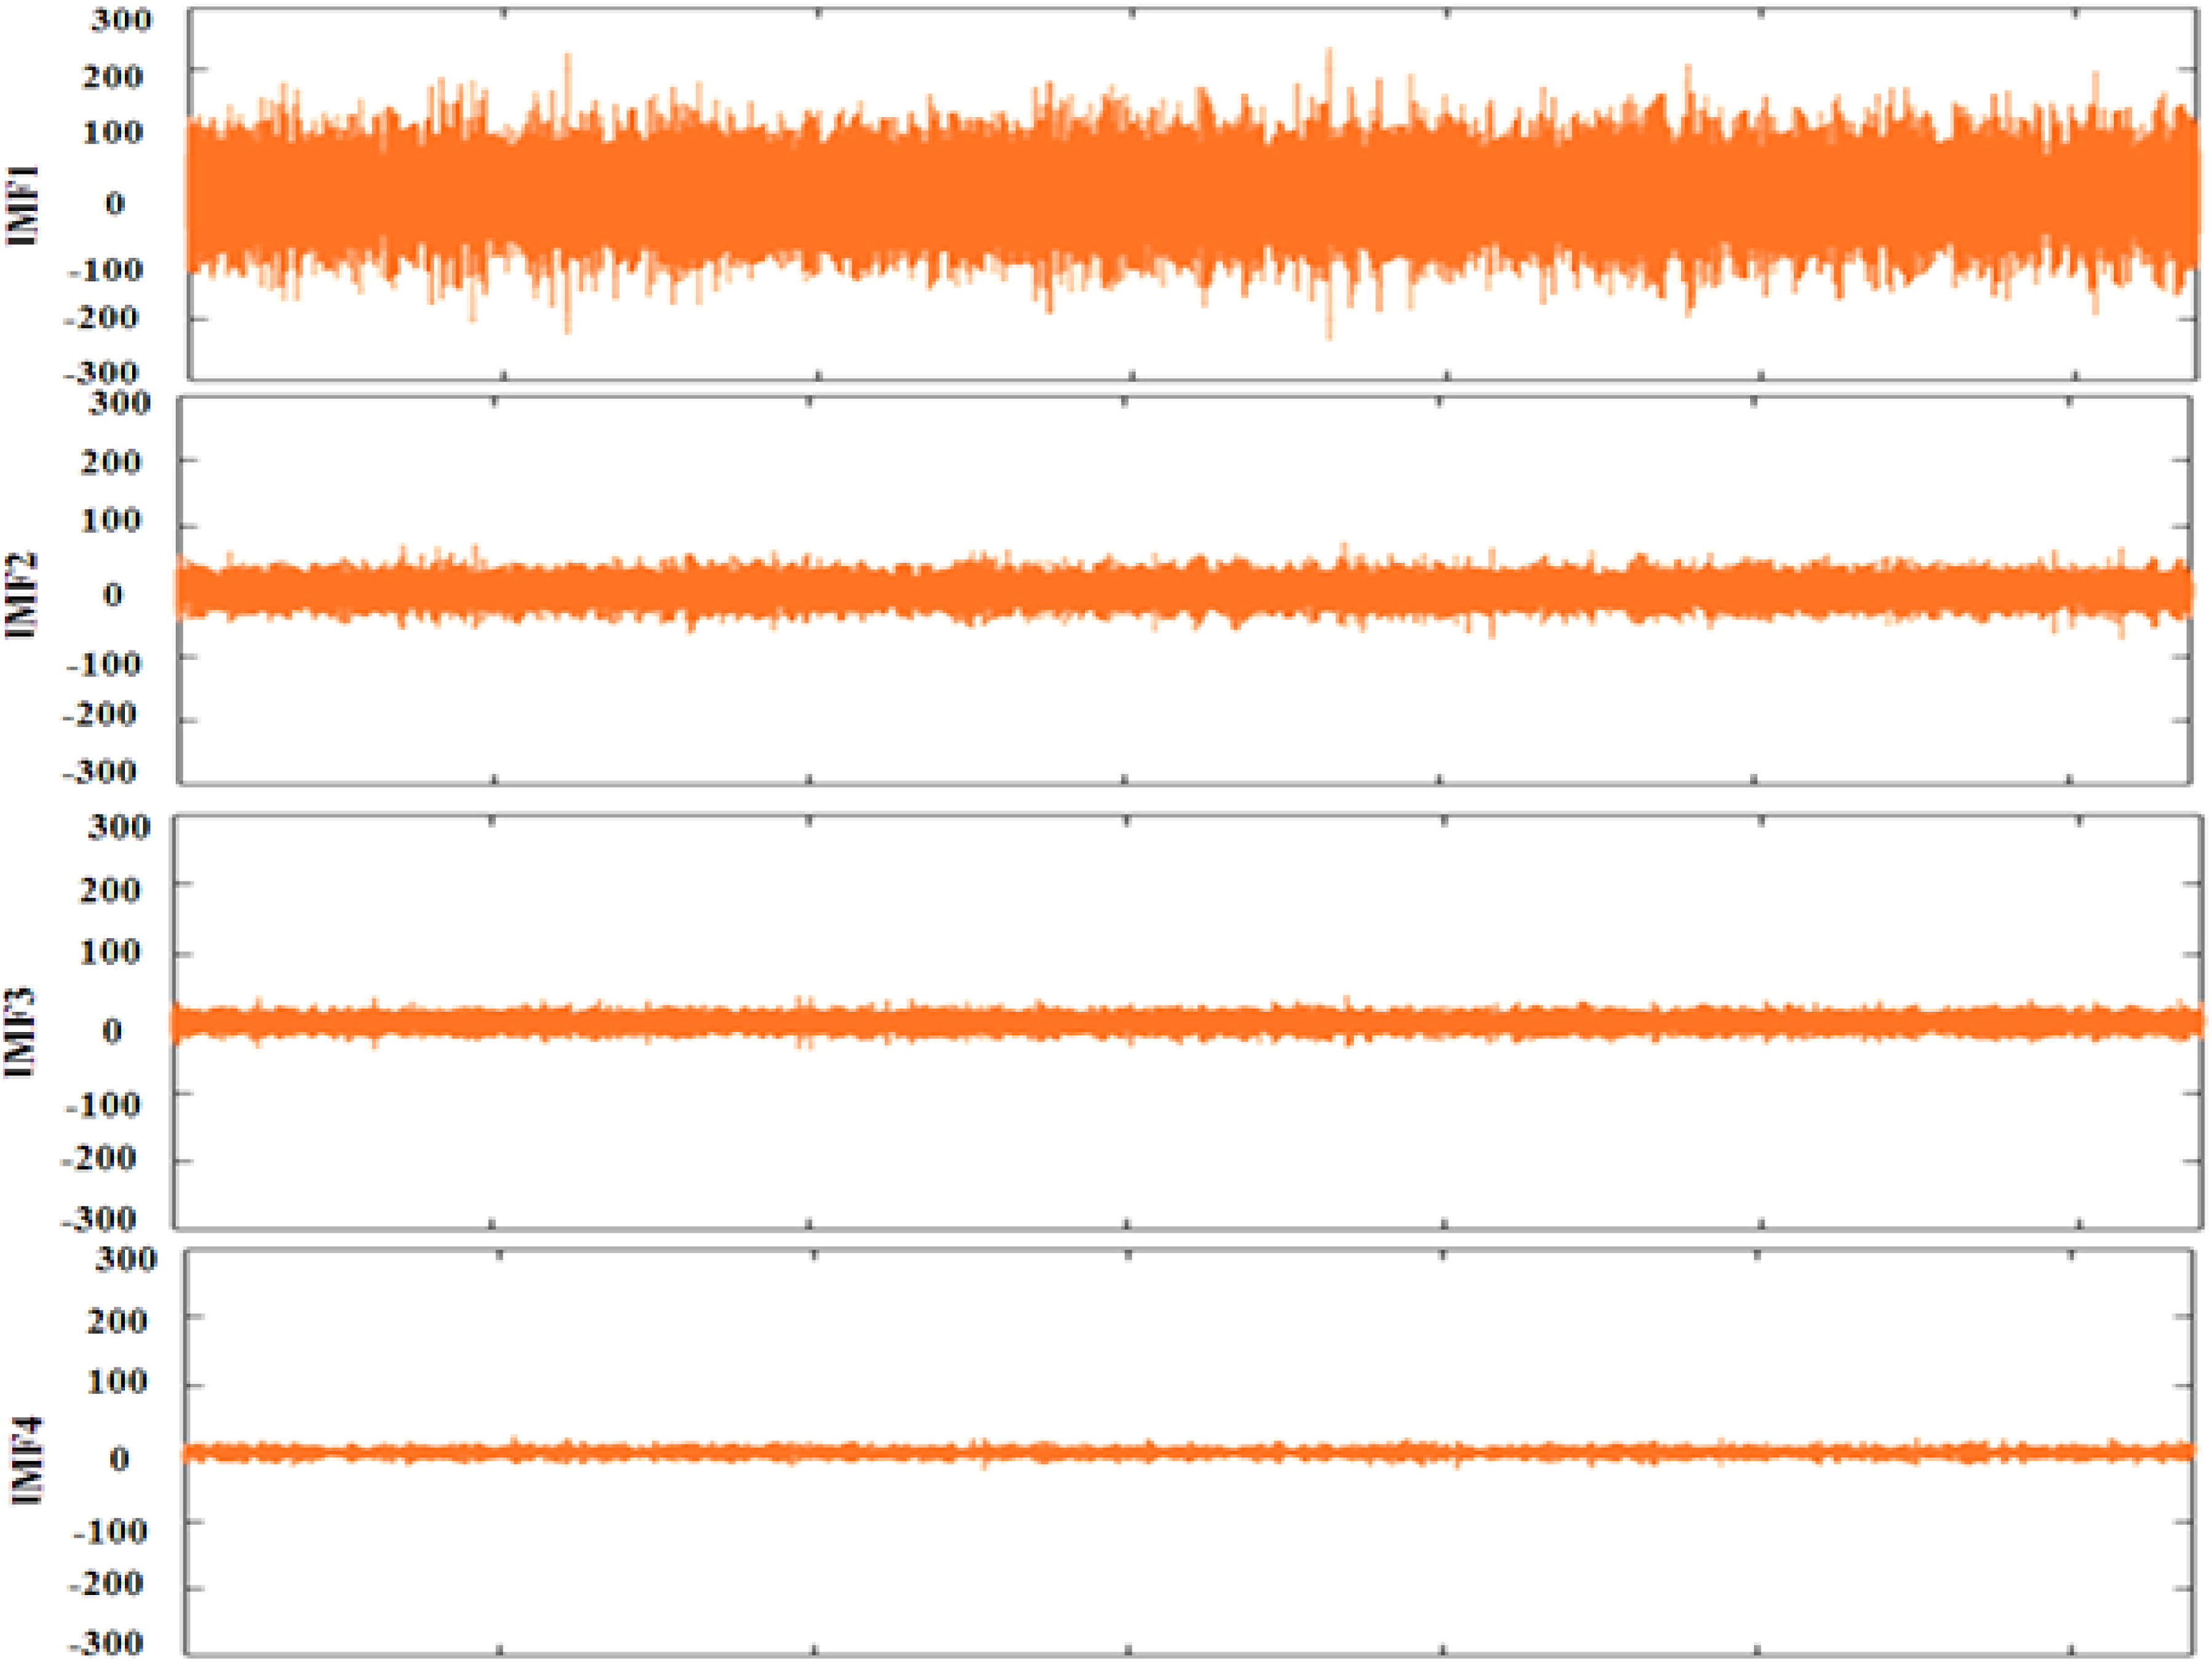
To examine the effects of several faults on vibration signals, measurements were taken under healthy and various simulated fault conditions. The samples are extracted at a motor speed of 750 r/min and a loading condition of 30 N, with a sampling frequency of 25.6 kHz. The results are categorised into feature extraction, feature selection and classification. In all, 30 samples were obtained for each of four engine-gearbox conditions. Therefore, a total of 120 samples were collected for further study, including normal and defective conditions. Upon preprocessing, the acquired vibration signal is decomposed into IMFs using the EMD. The first few IMFs typically capture the dominant dynamic characteristics and fault-related information, while higher-order IMFs often represent low-frequency trends, residual components, or noise. In the present work, a detailed analysis of the decomposed IMFs revealed that the first four IMFs contain the majority of the signal energy and exhibit clear fault-sensitive characteristics, such as amplitude variations and transient features associated with gear defects.The time-domain statistical feature plots for Normal gear, Tooth breakage, Tooth pitting, and Worn-out gears are shown in Figure 7. The EMD method decomposes the original signal, and the decomposition results are shown in Figures 8–11 under normal and faulty conditions. The greater the ratio of IMF energy to the original signal obtained by EMD, the greater the resemblance between the IMF and the original signal, and the more important the information it contains. After analysis and calculation, it is clear that the first four IMFs yielded the above-mentioned decomposition, and the original signal’s energy was relatively high. Different features were acquired from the IMFs, and significant features were obtained using the J-48 algorithm. Machine learning techniques are employed to identify the fault status of gearbox systems. Statistical features plot of Normal gear, Tooth breakage, Tooth pitting and Worn-out gears. The EMD plot of normal gear vibration signal. The EMD plot of tooth broken vibration signal. The EMD plot of pitting vibration signal. The EMD plot of worn-out vibration signal.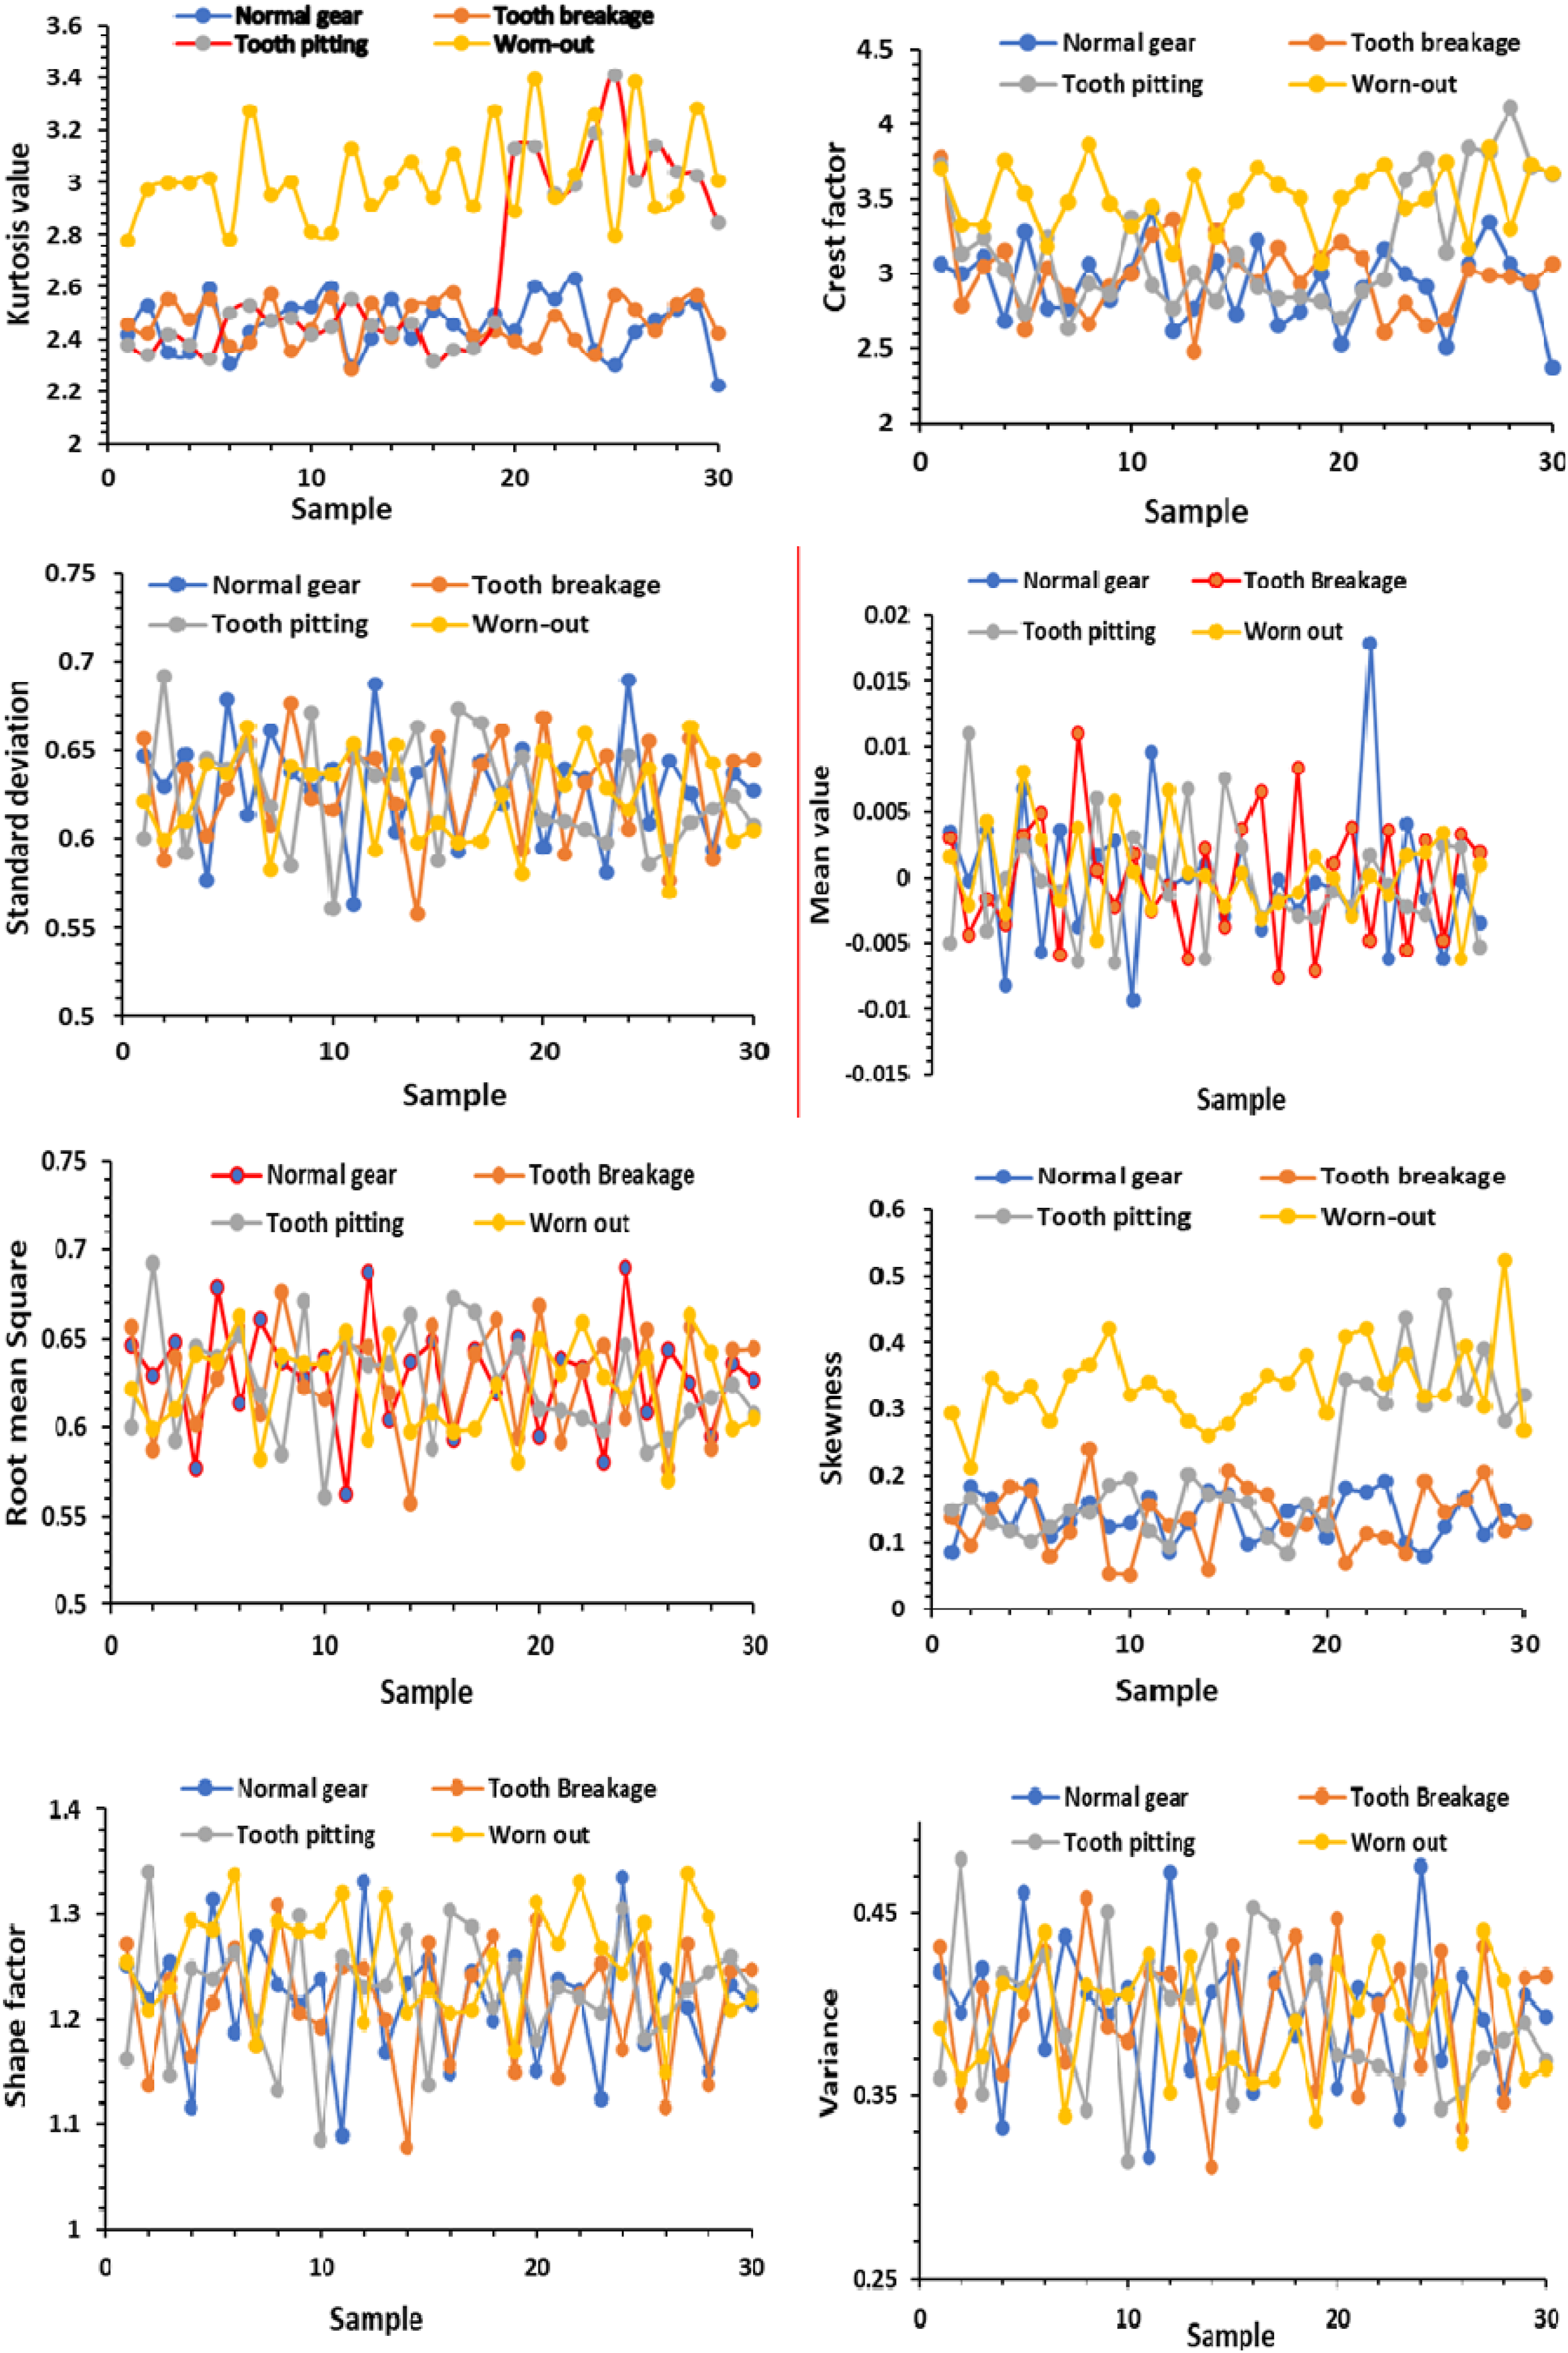
Feature extraction and selection
The EMD plot of normal gear vibration signals (Figure 8) shows the decomposition of the original signal into numerous IMFs using the EMD technique. This method is beneficial for evaluating non-stationary and nonlinear signals, as it divides them into simpler oscillatory components based on their local features. In regular gear operation, IMFs broadly capture the system’s natural vibrations, which are free of fault-related disruptions. Higher-frequency IMFs usually reflect system noise or high-frequency dynamics, whereas lower-frequency IMFs represent the overall system trend or energy. The plot shows a smooth, consistent signal breakdown, with no abrupt changes or abnormal patterns in the IMFs, suggesting the absence of defects. This EMD plot provides a baseline for comparing with defective conditions, allowing the detection of anomalies in vibration patterns caused by specific gear failures, such as tooth fracture, pitting, or wear. Unlike the ordinary gear vibration signal (Figure 9), the IMFs in this plot exhibit notable abnormalities and elevated amplitudes, particularly in the mid-to-low-frequency components, indicative of localised failures, such as tooth fracture. These inconsistencies result from the impact pressures created when the fractured tooth engages and disengages during operation, generating sudden shifts in the vibration pattern. Higher-frequency IMFs frequently capture noise or minor resonances, whereas lower-frequency IMFs reflect the primary energy and repeated patterns associated with the fault. This figure is helpful for diagnosing tooth breakage in gearbox systems, given the significant amplitude and frequency deviations from the normal situation. Pitting is a localised flaw caused by small cavities or material loss on the gear surface, resulting in periodic hits during gear meshing. These influences are seen in the EMD plot (Figure 10) as different patterns in the mid-to-high-frequency IMFs, which are frequently recurrent, high-amplitude oscillations. Lower-frequency IMFs capture the overall trend and energy distribution affected by the fault. The vibration signal shows more abnormalities and energy variations than in a typical situation due to uneven surface contact caused by pitting. This figure illustrates the pitted gear’s distinct frequency characteristics, providing vital insights for recognising and diagnosing this defect in gearbox systems. Gear wear, defined as the gradual loss of material on gear teeth due to extensive use, results in smoother but weaker tooth contact and changes in vibration patterns. The EMD plot (Figure 11) shows that the IMFs have significant amplitude variations in the lower-frequency components, indicating a steady breakdown of the gear’s structural integrity. Mid-to-high-frequency IMFs are less sharp than those under fault conditions, such as tooth breakage, because worn-out gears often produce more uniform but weaker vibrations. These modifications, together with a probable shift in energy distribution, suggest a worn-out condition. This plot provides critical information for recognising wear-related flaws and distinguishing them from more abrupt or localised defects, enabling more effective gearbox diagnosis and maintenance.
Eight features have been obtained from the IMFs of EMD signals (Kurtosis, Crest factor, Standard deviation, Mean, Root mean square, Skewness, Form factor and Variance). Extracted statistical features were normalized to ensure uniform scaling and to prevent features with larger numerical ranges from dominating the learning process. For each condition, 30 samples of the gearbox state were collected and labelled, as shown in Table 2. Each sample corresponds to features extracted from long time-series data, ensuring meaningful representation of signal characteristics. Usually, it is possible to compare the amplitude of the defective circumstances to that of the normal gearbox. However, it can only describe the defect and cannot identify the exact location of faults. Therefore, the J-48 algorithm is used to select significant features from the extracted features. The decision tree generated by the J-48 algorithm is illustrated in Figure 12, showing that the three best features for visually presented classification are Kurtosis (TF1), Standard deviation (TF3), and Skewness (TF6), in order of significance. The decision tree identified the most relevant features for gearbox condition classification. The essential features were chosen based on the data gain and entropy available in each EMD function. The decision tree is constructed on the basis of the attribute Kurtosis in such a way that when the value of the Kurtosis feature is greater than 0.2394, and the Standard deviation is greater than 0.6245, it is known as a ‘Tooth breakage’ condition. If the Kurtosis function value is greater than or equal to 0.2394, and if Skewness is greater than 0.07876, it is referred to as the ‘Normal Condition' state, etc. For gearbox condition classification, the selected feature matrix served as input to the machine learning algorithm. J-48 decision trees.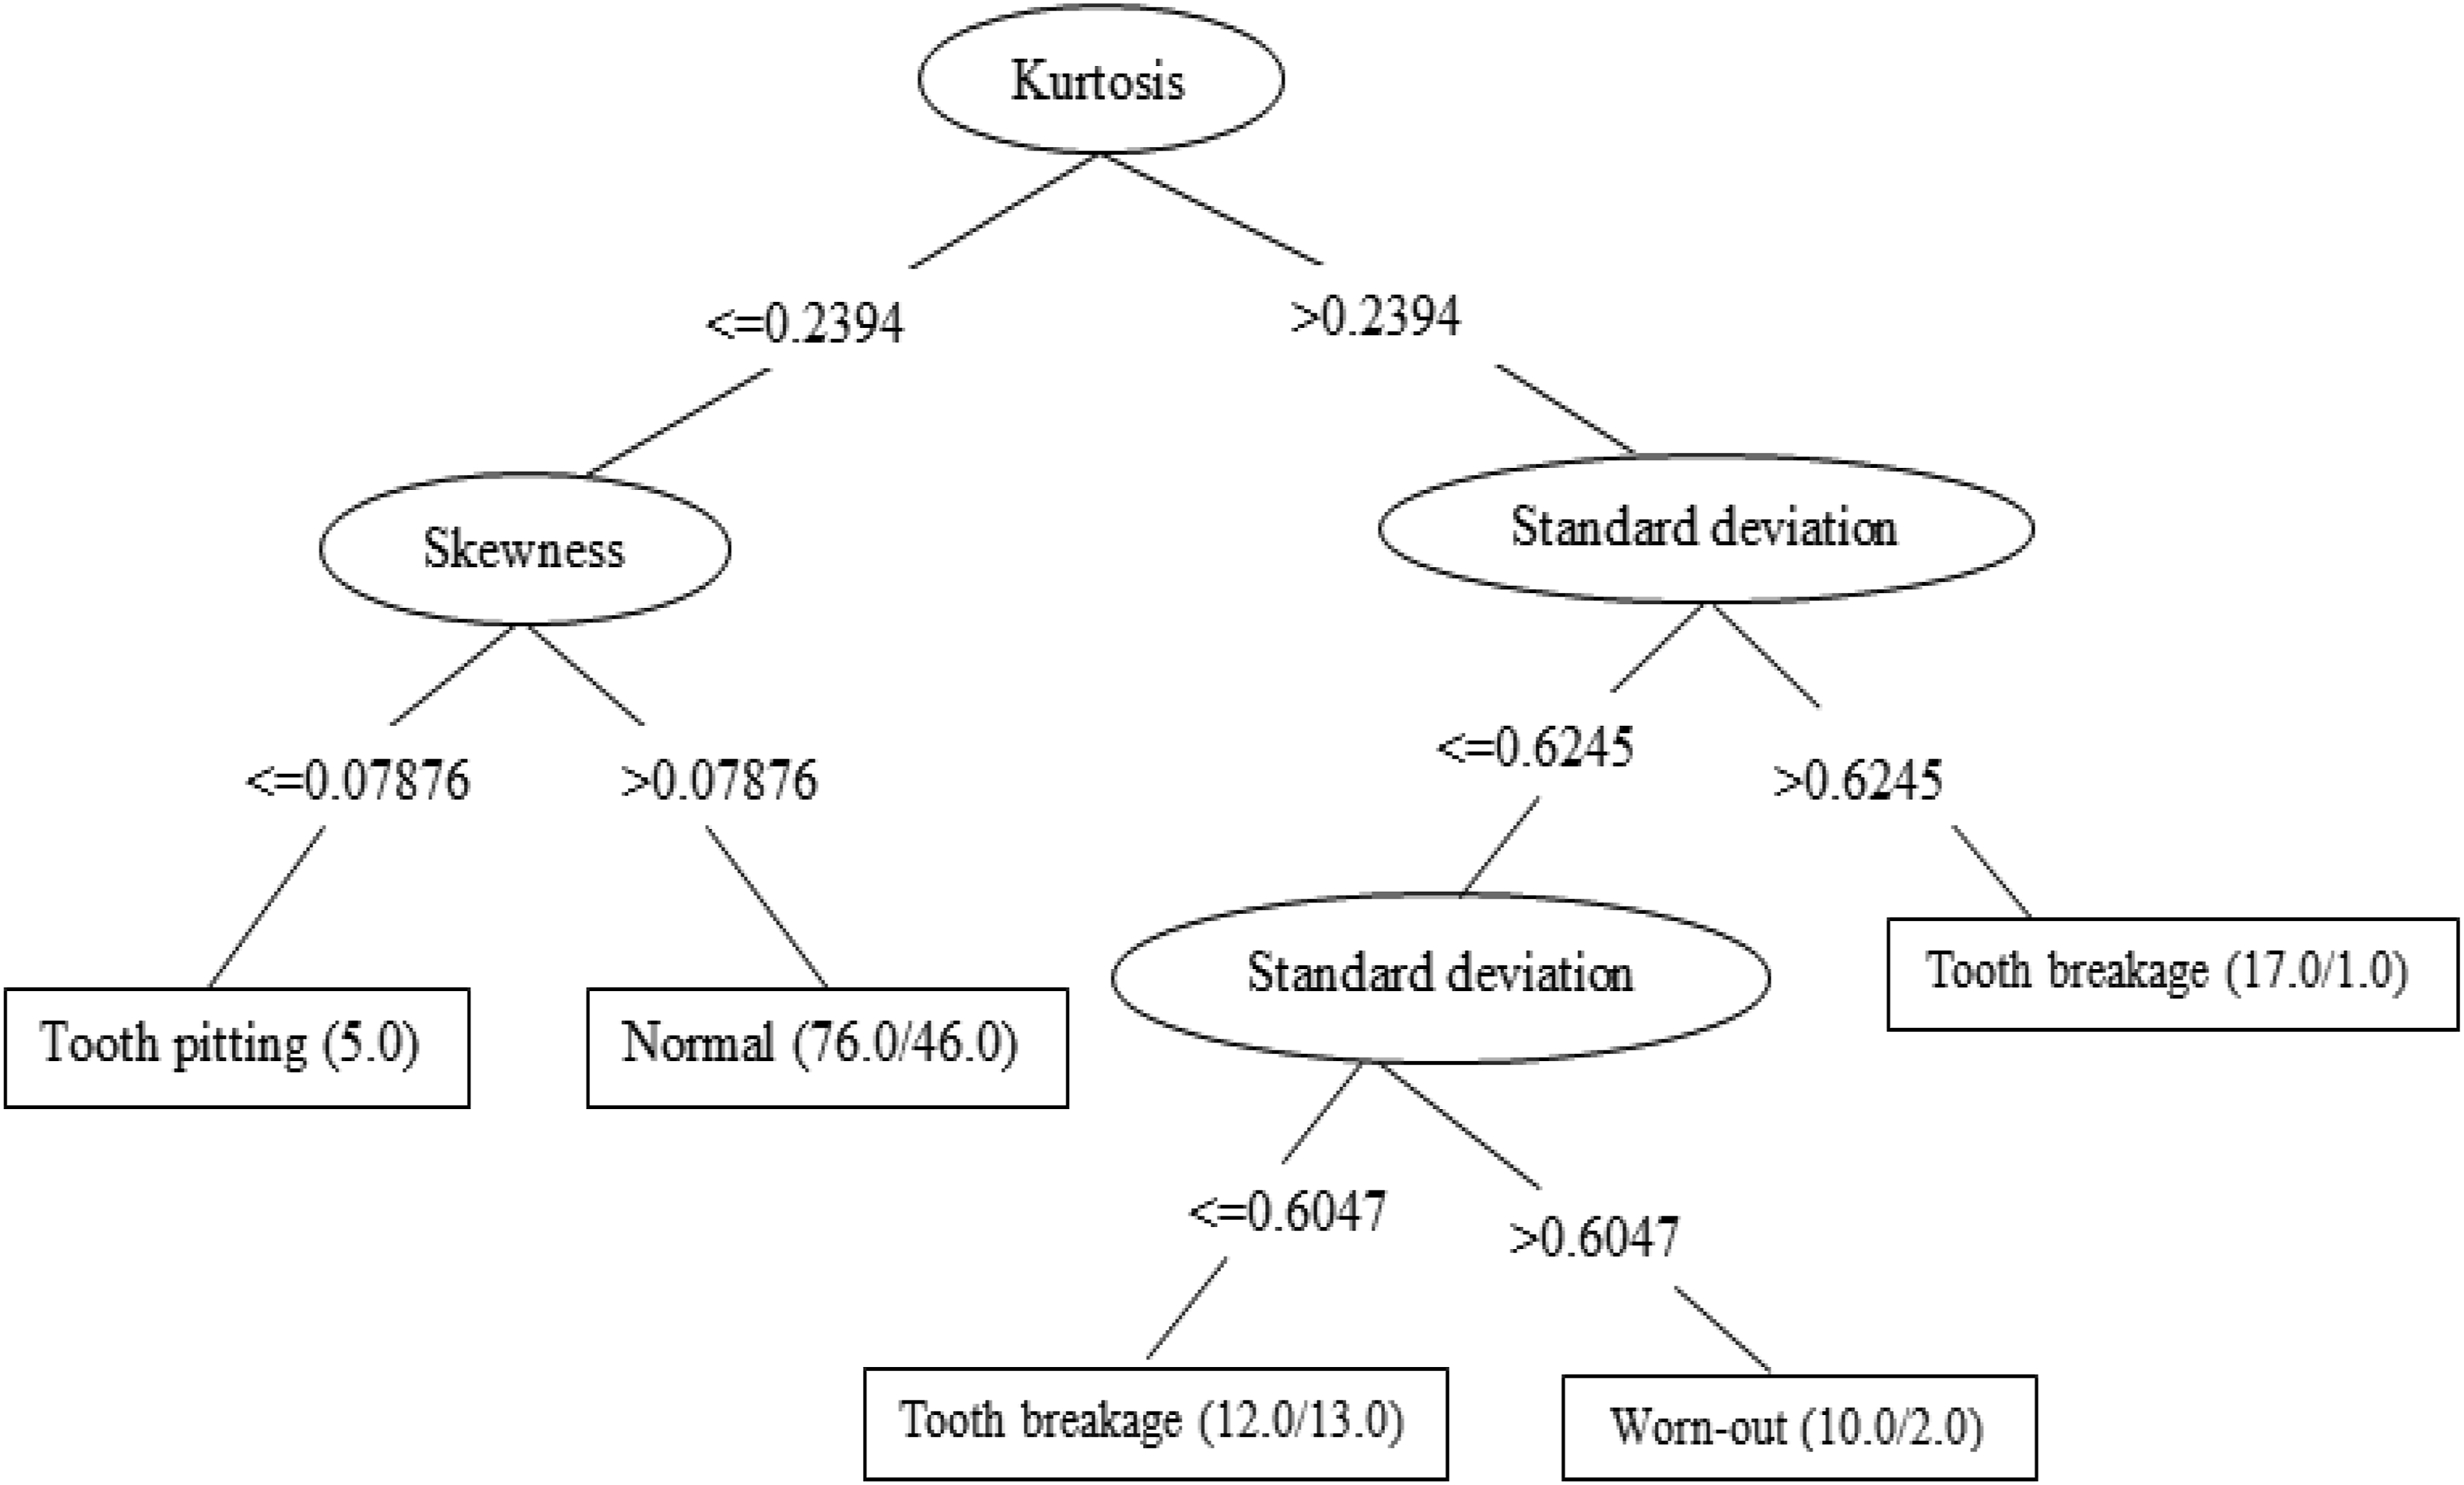
Classification using RF and ANN
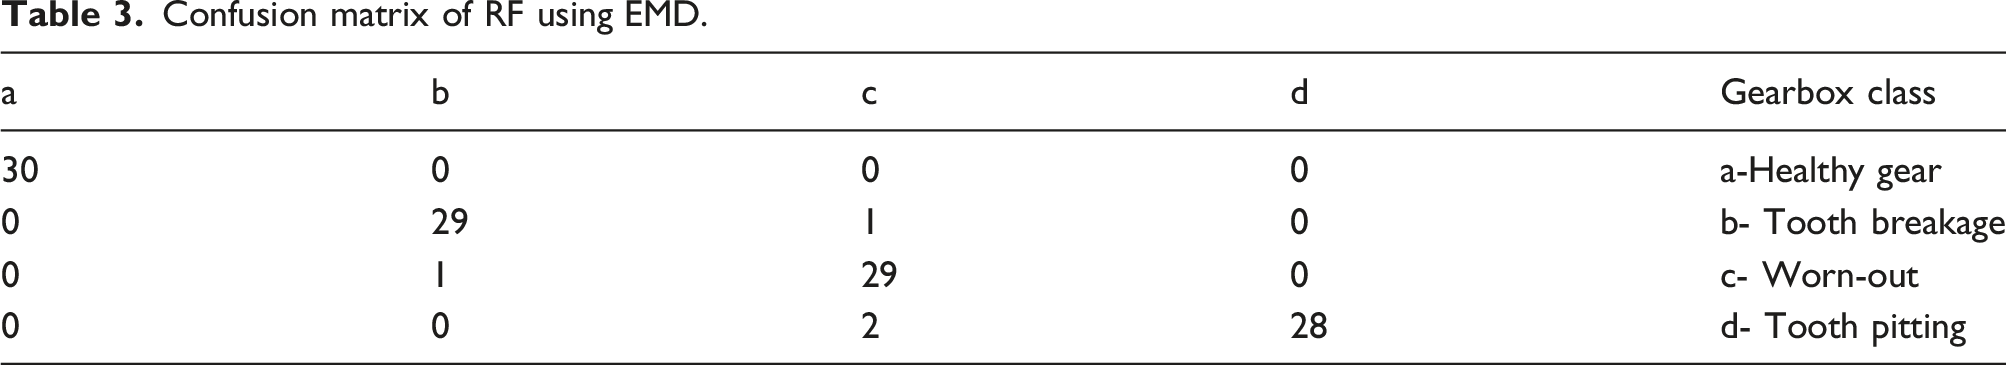
Confusion matrix of RF using EMD.
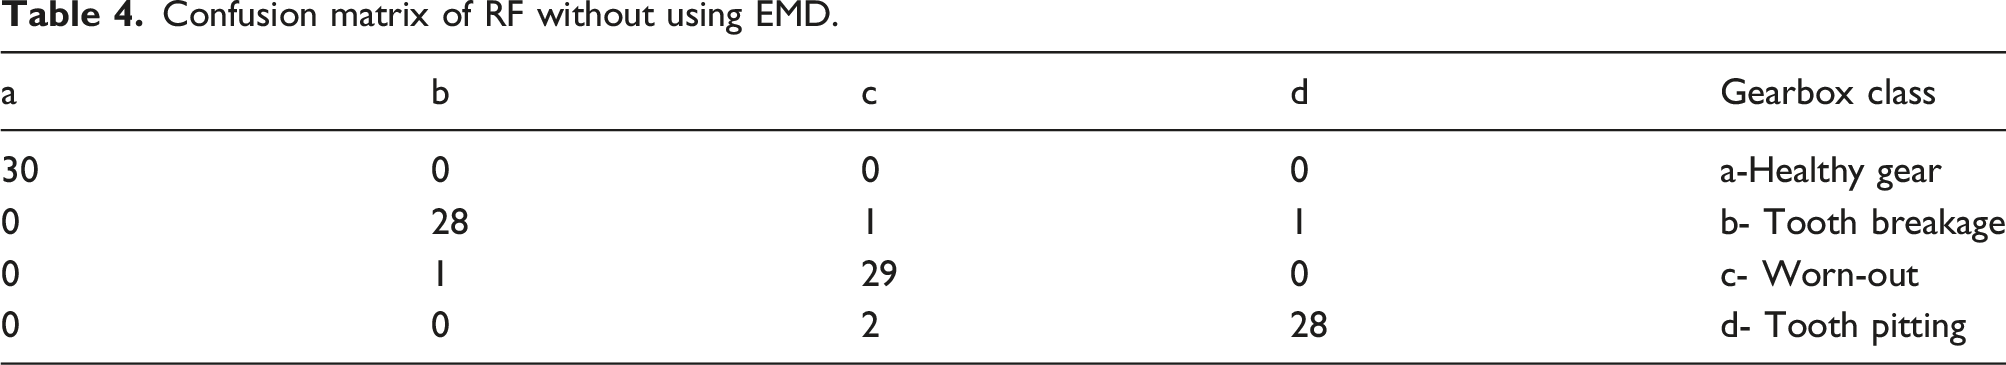
Confusion matrix of RF without using EMD.
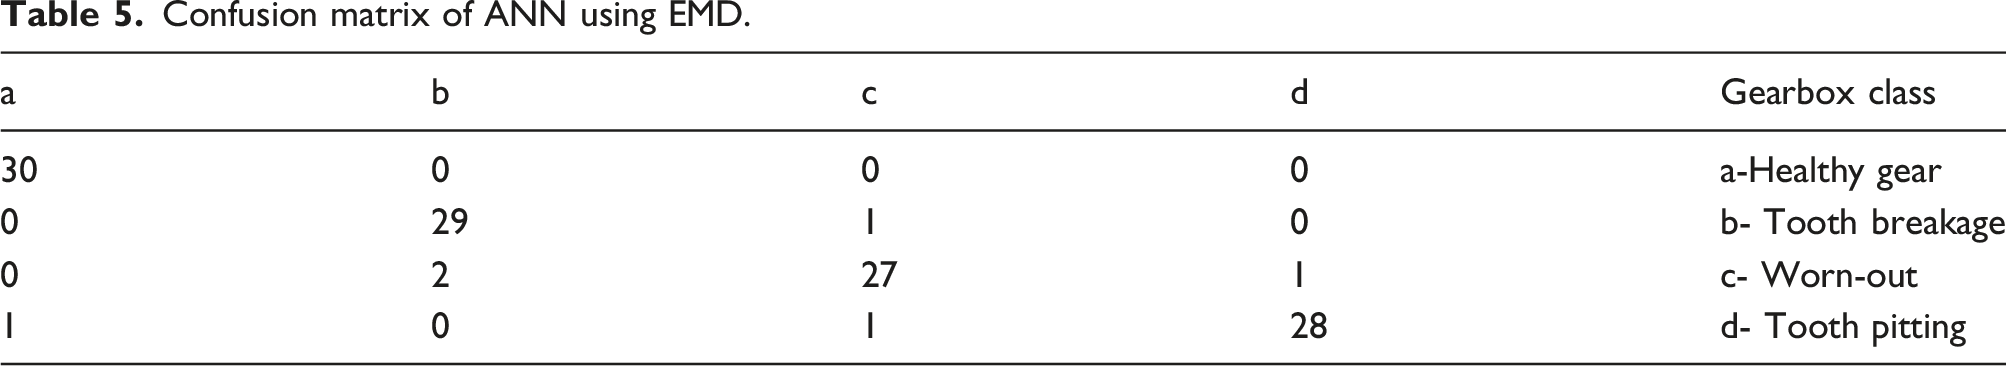
Confusion matrix of ANN using EMD.
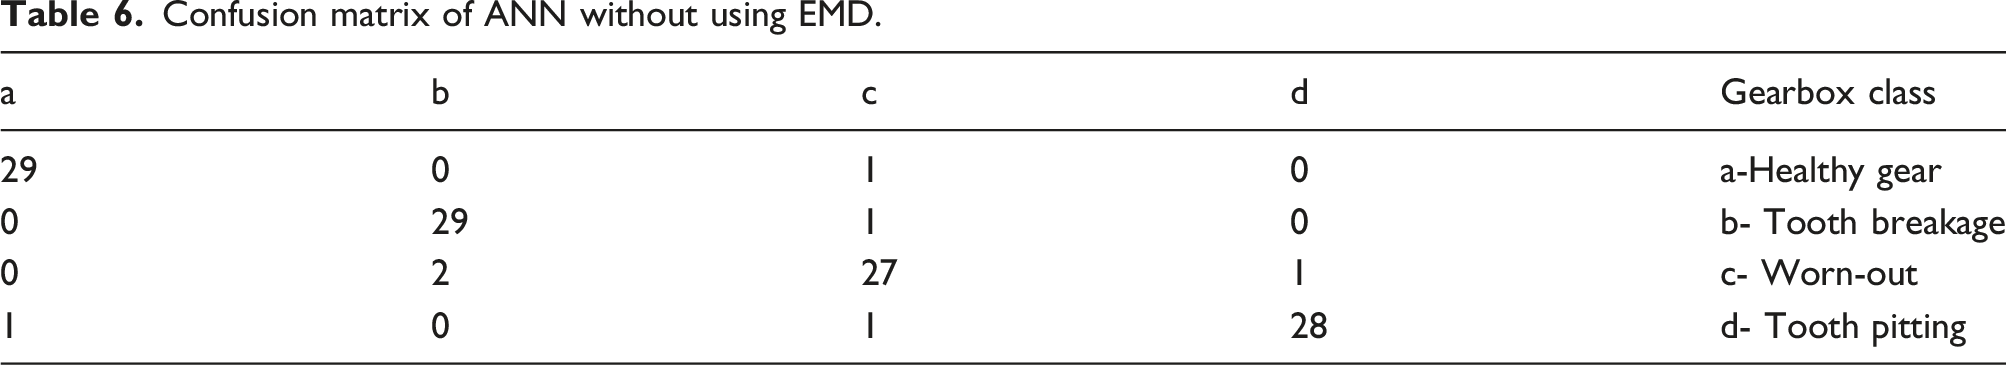
Confusion matrix of ANN without using EMD.
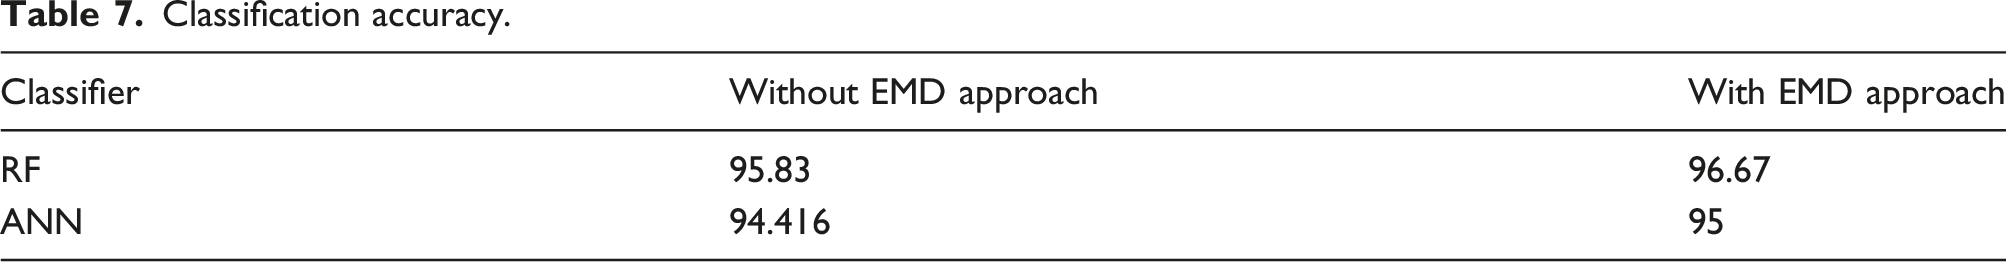
Classification accuracy.
When the RF classifier was used with the EMD technique (Table 3), it achieved excellent classification accuracy across all gearbox conditions. Of 120 samples, 116 were correctly categorised. The diagonal portion of the confusion matrix reflects correctly categorised samples: all 30 Healthy Gear samples were correctly identified, demonstrating the classifier’s ability to distinguish normal conditions with 100% accuracy. For Tooth Breakage, 29 samples were successfully classified, with only one incorrectly classified. Similarly, 29 Worn-Out Gear samples were correctly identified, while one was incorrectly categorised. For Tooth Pitting, 28 samples were successfully classified, with two misclassified. These findings demonstrate the efficacy of integrating RF and EMD for robust fault identification. Without the EMD technique (Table 4), the RF classifier’s performance fell slightly. While the Healthy Gear condition was still identified with 100% accuracy, the Tooth Breakage class showed more misclassification, with 28 correct identifications and 2 errors. Similarly, Worn-Out Gear maintained the same performance with 29 correct classifications, although Tooth Pitting had two misclassifications, as in the EMD-enabled example. This modest decrease in accuracy underscores the importance of EMD in enhancing the classifier’s ability to separate and detect discrete fault features effectively.
The introduction of EMD improved the ANN classifier’s performance (Table 5). Of the 120 samples, 114 were correctly categorised. Healthy Gear samples were classified with 100% accuracy, whereas Tooth Breakage had one misclassification. Worn-Out Gear had two misclassifications, whereas Tooth Pitting had one misclassified sample. The ability of ANN to accurately categorise 95% of samples with EMD integration demonstrates the value of this preprocessing step in enriching input data for fault identification. After EMD was eliminated (Table 6), the ANN classifier’s performance decreased slightly. Healthy Gear samples yielded 29 accurate diagnoses and one misclassification. Tooth Breakage remained accurate with 29 correct classifications, whereas Worn-Out Gear and Tooth Pitting each had two misclassifications. The total number of correctly identified samples fell to 113, resulting in somewhat worse overall accuracy than in the EMD-enabled case. The EMD technique improves classification accuracy by decomposing complex vibration signals into simpler, more understandable components known as IMFs. These IMFs effectively isolate fault-related variables, allowing classifiers to examine the underlying properties of each gearbox situation with more precision. EMD improves the quality of incoming data by separating noise from meaningful signal components, thereby aiding defect detection.
Table 7 shows the total classification accuracy of the RF and ANN classifiers, with and without EMD. For RF, accuracy increased from 95.83% without EMD to 96.67% with EMD, indicating the classifier’s improved ability to recognise subtle variations in vibration signals across fault conditions. The ANN accuracy increased from 94.41% to 95% when EMD was used. These findings show that EMD improves classification performance for both algorithms, albeit the benefit is more evident for RF.
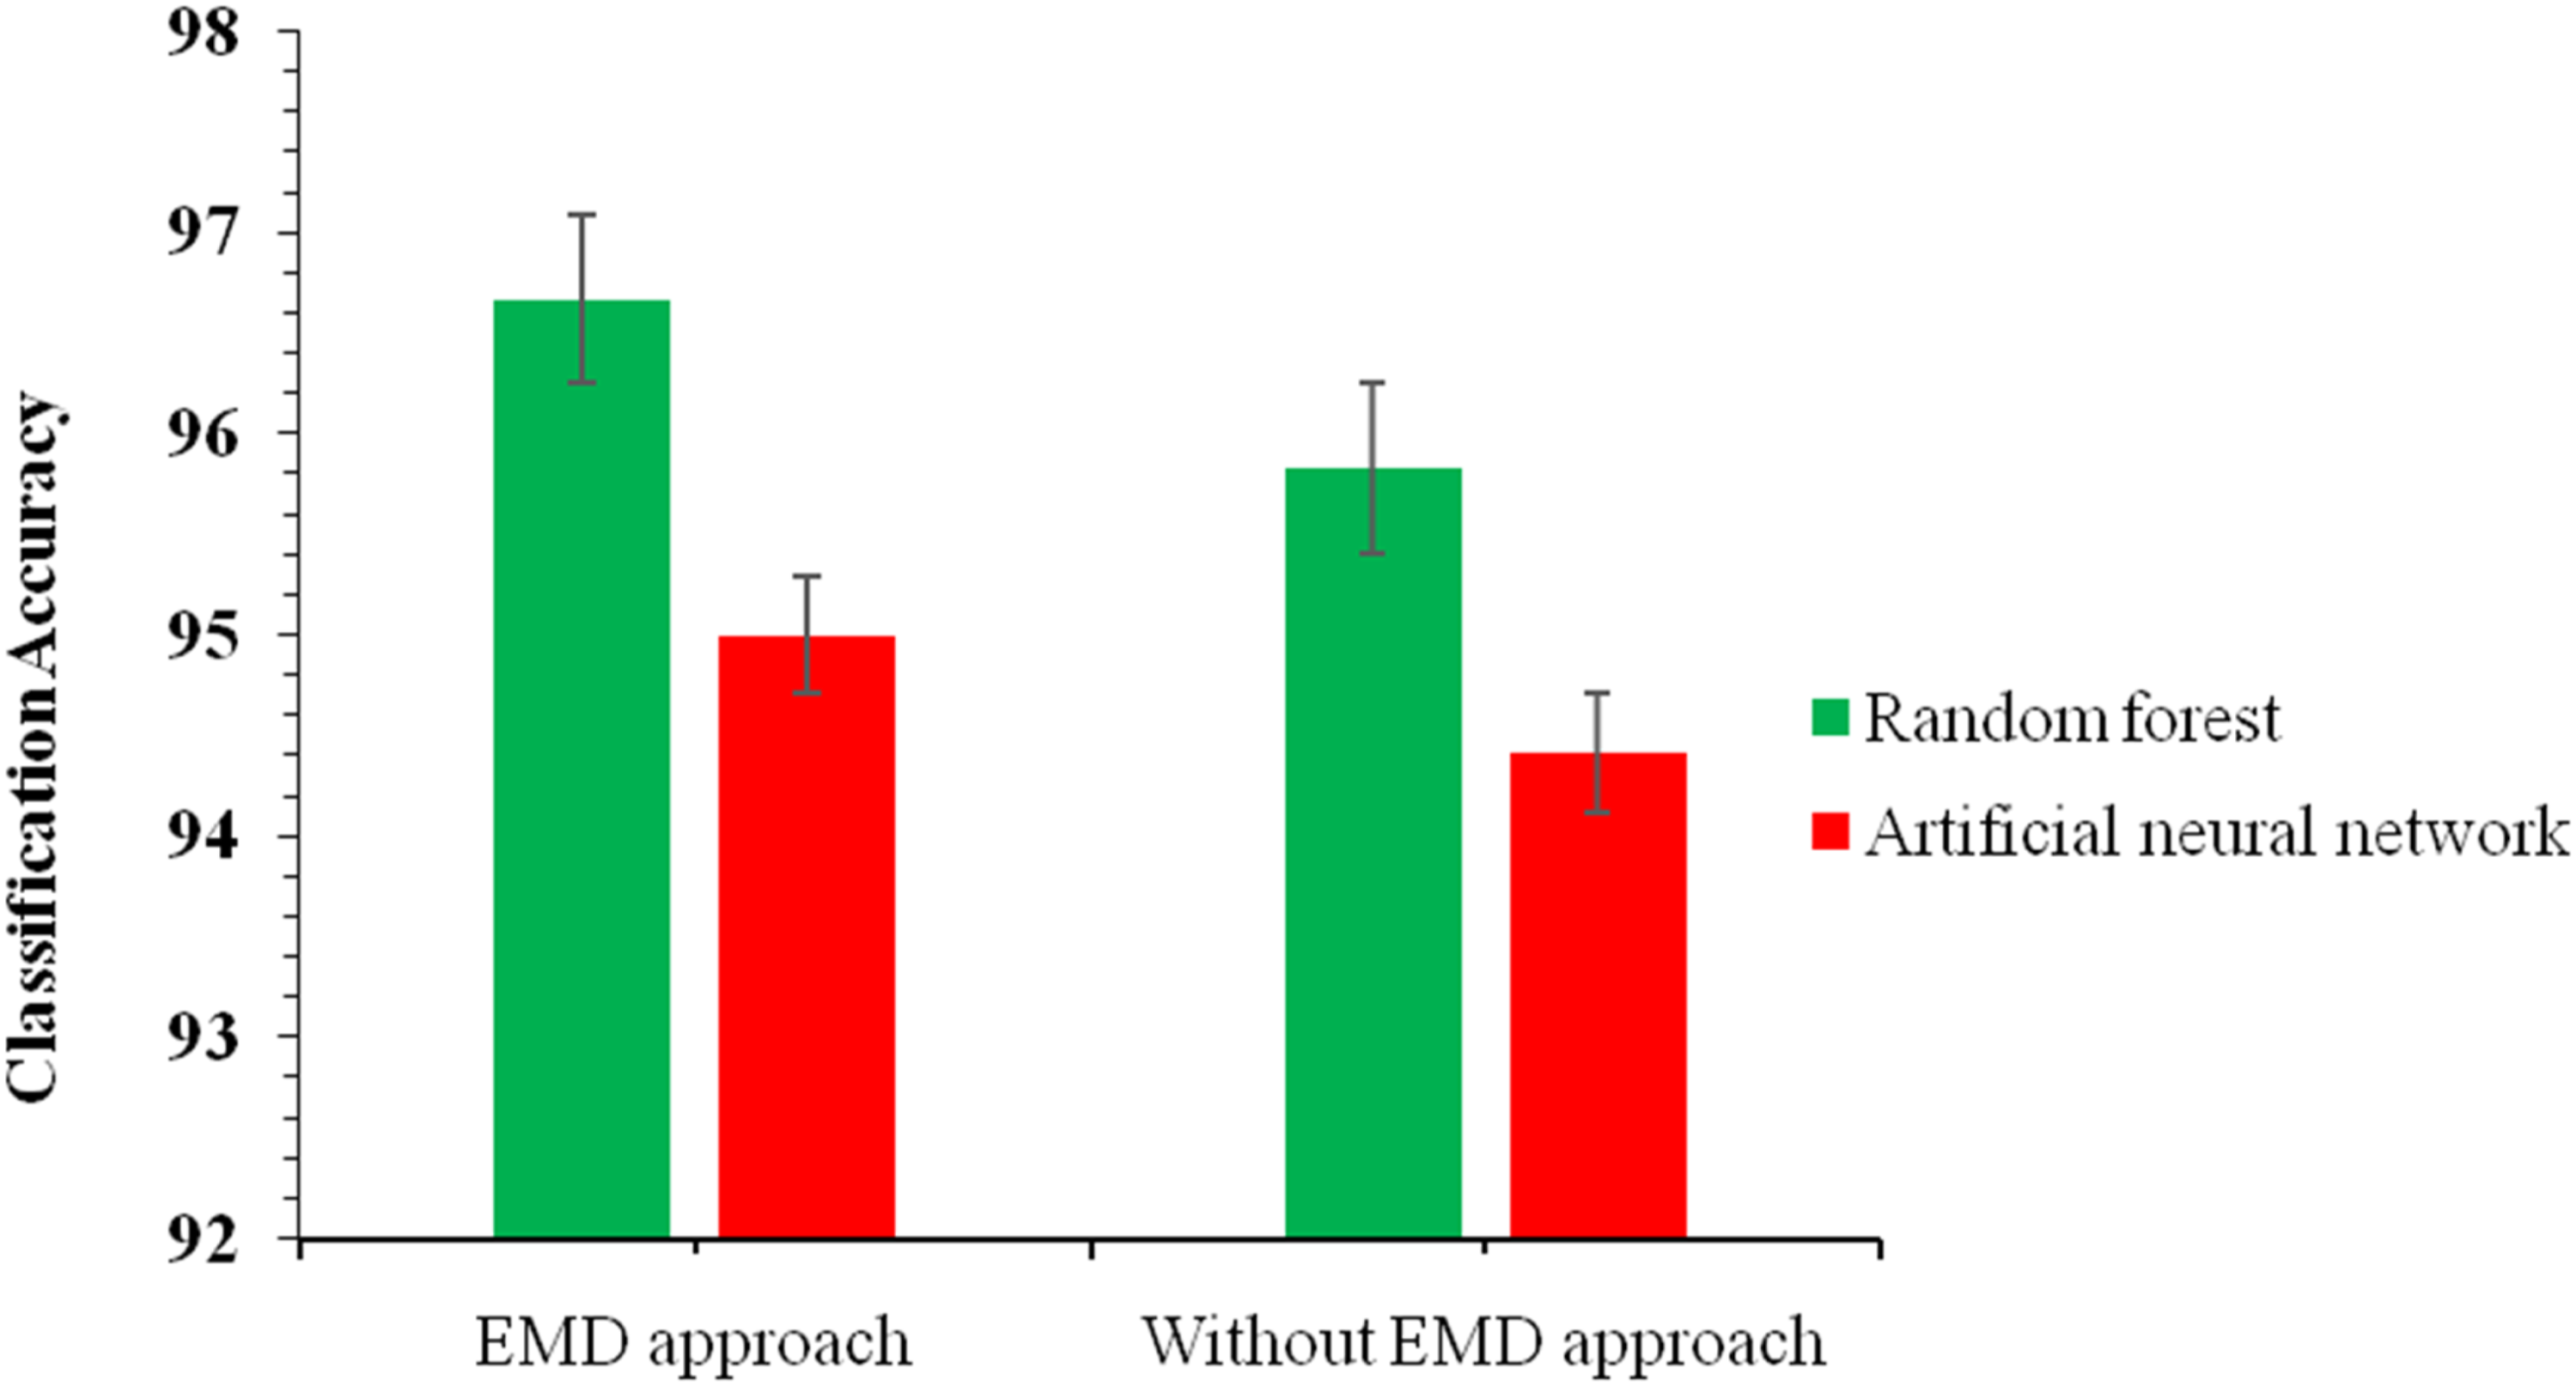
Figures 13 and 14 present additional performance indicators, including classification accuracy and Root Mean Square Error (RMSE), to demonstrate the effectiveness of the EMD technique. These statistics show that combining EMD and RF not only improves classification accuracy but also reduces RMSE relative to the ANN classifier. The decrease in RMSE demonstrates the precision of the EMD-enhanced RF model in forecasting the correct gearbox conditions, confirming its usefulness for fault-detecting applications. Classifier accuracy (%) of proposed mode RMS error value of proposed model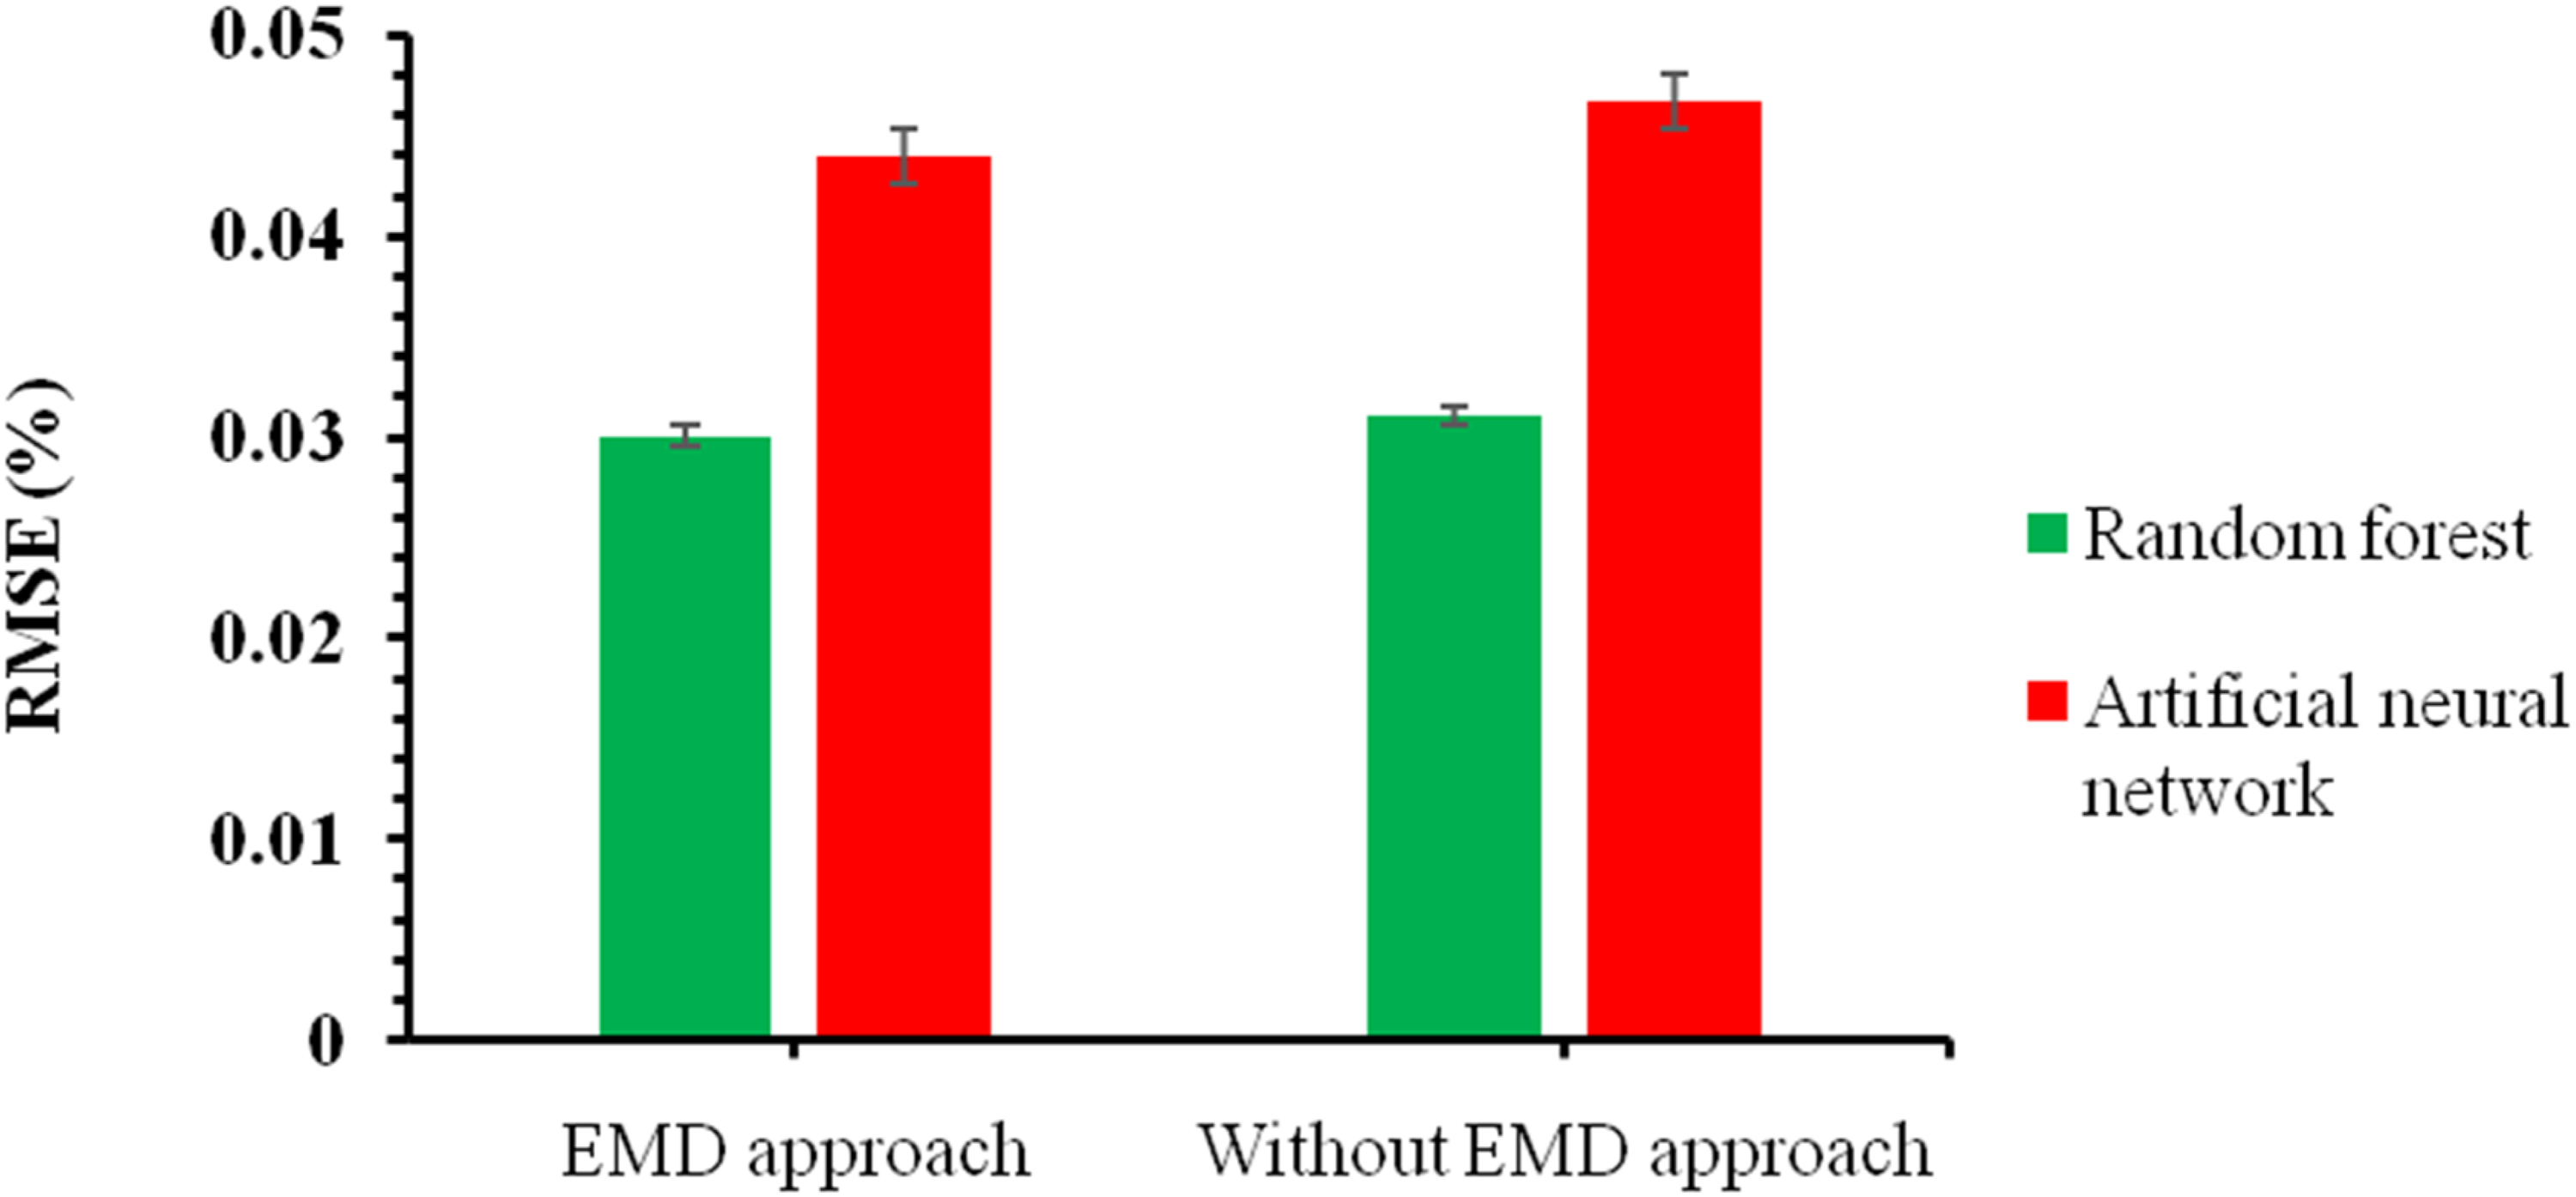
The comparison of RF and ANN classifiers shows that RF consistently outperforms ANN in both circumstances (with and without EMD). RF’s improved performance is due to its ensemble learning method, which combines multiple decision trees to enhance classification accuracy and robustness. The decision tree structure enables RF to capture complex feature correlations, making it especially useful for defect-detection tasks that involve subtle variations in signal properties. In comparison, while ANNs are successful, they may require considerable hyperparameter tuning and larger datasets to achieve equal performance.
The results in Tables 3–7 and Figures 13 and 14 show that the EMD strategy significantly improves the accuracy of machine learning classifiers for gearbox problem detection. EMD improves the input data by converting vibration signals into meaningful IMFs, enabling classifiers to distinguish between normal and abnormal conditions. The RF classifier, in particular, performs better, achieving 96.67% classification accuracy with EMD compared to 95.83% without it. Similarly, EMD improves ANN’s accuracy from 94.41% to 95%. The improvement in classification accuracy (∼1%) may appear marginal at first glance; however, from a practical perspective, even a small increase in classification accuracy can correspond to a meaningful reduction in misclassification of fault conditions. In the present study, the inclusion of EMD resulted in an increase in correctly classified samples. In real-world industrial scenarios, such improvements can significantly enhance early fault detection reliability, reducing the risk of undetected faults that may lead to severe equipment damage, unplanned downtime, or safety hazards. Therefore, even incremental gains in accuracy are highly valuable in condition monitoring systems.
Conclusions
The rapid development of industries necessitates the smooth functioning of rotating machine elements. Therefore, diagnosing faults in these elements preventively through advanced techniques is essential. This not only aids operators in troubleshooting but also helps investigate incipient gearbox faults, particularly when delays might compromise human safety, machine health, and industry profitability. Despite significant interest in this area, there has been limited attention to diagnosing bevel gears under multiple-fault conditions with loading. In this paper, a Machine fault simulator (MFS) was developed to diagnose bevel gearbox faults using machine learning and EMD-based feature extraction approaches from vibration signals. The study investigated and conducted a comparative analysis of gearboxes under both healthy and faulty conditions. Using EMD, the gearbox’s raw vibration signals were decomposed into IMFs to identify bevel gearbox faults in the time-frequency domain. ML algorithms combined with EMD were used for automated gear fault identification. The proposed method successfully detected several gearbox faults, including tooth breaking, worn-out teeth, and tooth pitting.
Based on experimental results, the following important conclusions are drawn: • EMD plots highlight the importance of the planned methodology by eliminating background noise and reducing the effects of speed fluctuations, hence representing important information. • Important features were offered by the J-48 decision tree algorithm for additional performance enhancement. • Compared to algorithms without EMD, the combined application of ML and EMD produced higher classification accuracy. • When diagnosing defects in the chosen gearbox, the RF method with EMD performed better than the ANN, reaching a classification accuracy of 96.67% as opposed to 95.83%. • RF with EMD also showed higher accuracy than ANN, according to the root mean square error (RMSE).
The improvement in results implies that RF-aided EMD algorithms can be used in future research to differentiate between other gear types, such as spur and helical gears, and other machine parts, such as bearings.
Footnotes
Acknowledgments
We are grateful to the Director MNNIT Allahabad, Prayagraj, Uttar Pradesh, India for providing necessary laboratory facilities. The Ministry of Education, Govt. of India, New Delhi, India, is acknowledged for providing financial assistance to Sheo Kumar throughout this tenure.
Author contributions
Declaration of conflicting interests
The authors declared no potential conflicts of interest with respect to the research, authorship, and/or publication of this article.
Funding
The authors received no financial support for the research, authorship, and/or publication of this article.