
Abstract
This study evaluates the production efficiency of start-ups and fast-growing medium-sized firms in advanced technology (AT) sectors and examines how the regional knowledge base contributes to reducing inefficiency. Using micro-level data for the period 2009–2016, we examine production efficiency across European regions (NUTS2), sectors (two-digit NACE) and firm-size groups by applying stochastic frontier analysis. Our findings suggest that firms’ fixed assets significantly affect production efficiency across firm types. Consequently, direct investments in these firms significantly shift the production possibility frontier of AT sectors throughout European regions. Among regional conditions, we included an indicator of the local knowledge base using the relatedness density measure on a sector-by-sector basis. This helped us evaluate how the combinatorial potential of regional technological capabilities influences firm performance. Our research reveals that regional conditions are particularly important for the performance of fast-growing medium-sized firms. This suggests that such firms may constitute a “missing middle” in regional innovation strategies, offering greater territorial returns than policies focusing solely on start-ups or large R&D firms. While start-ups can be efficient even in fragmented knowledge environments, medium-sized firms’ growth potential is constrained without access to a broader knowledge base. This indicates a structural challenge for place-based policy, enabling knowledge flows and institutional capacity in regions to support the production efficiency of fast-growing medium-sized firms.
Keywords
Introduction
In recent years, the European Union (EU) has continued to face challenges in achieving its full productive potential (European Commission, 2024; Glass and Kenjegalieva, 2024). The EU’s production efficiency remains below the global production frontier, with a 10–20% gap (Sanchez, 2021). Significant differences in productive performance and a wide technology gap also remain across European regions (Burger et al., 2021). In the context of intensifying global competition, the ability to develop more complex, technology-intensive products has become increasingly important for both economically advanced and lagging regions (Balland et al., 2019; Hartmann et al., 2021).
From a policy perspective, the European Commission (2009, 2015) has introduced initiatives to strengthen Europe’s innovation base and foster industrial transformation, including the Digital Single Market Strategy (COM(2015) 192 final), the Strategy for Key Enabling Technologies (COM/2009/0512 final) and smart specialisation strategies (S3 Platform). These initiatives underline the EU’s long-term commitment to enhancing regional innovation capacity and competitiveness. However, despite these sustained efforts, it remains unclear to what extent strengthening regional knowledge bases and industrial capabilities translates into improved firm-level performance across diverse regions, particularly in advanced technology (AT) sectors strategic for European well-being.
Regional and evolutionary economics emphasise that knowledge creation, learning and innovation processes are spatially embedded (Asheim, 2007; Jaffe et al., 1993; Lundvall, 1992). Regions with stronger knowledge bases and institutional capacities are expected to host more productive and innovative firms. However, empirical evidence across Europe remains mixed. Even in regions with extensive R&D infrastructure and patenting activity, firms differ considerably in the extent to which they benefit from local knowledge assets (Colombelli, 2016; Holm et al., 2020). This variation suggests that the structure and nature of regional knowledge, rather than its scale alone, may be decisive for firm efficiency.
Earlier studies of regional knowledge and firm performance, especially within the knowledge spillover theory of entrepreneurship and regional innovation systems research, have mainly relied on indicators such as R&D expenditure, the number of patents or human capital levels (Acs et al., 2009; Audretsch and Lehman, 2005; Fritsch and Slavtchev, 2011). While these measures capture the size or intensity of regional knowledge assets, they reveal little about their internal structure: how technologies are related and recombined to generate innovation (Colombelli, 2016). Building on evolutionary economic geography and economic complexity perspectives (Boschma et al., 2015; Hidalgo et al., 2009), this study considers the combinatorial view of regional knowledge, where opportunities for recombination and innovation depend on the relatedness among technologies within a region’s portfolio.
From this perspective, firm performance depends not only on internal resources and capabilities but also on the combinatorial opportunities provided by the regional knowledge base (in this article, we use terms regional knowledge base and local knowledge base interchangeably). Regions with a high degree of technological relatedness are more likely to facilitate knowledge spillovers, collaborative innovation and efficient production processes, while fragmented or less related knowledge bases may limit such effects, even in R&D-intensive environments (Boschma et al., 2015; Colombelli, 2016).
To capture these dynamics, this study integrates a variable describing the relatedness density (RD) of the regional knowledge base into firm-level efficiency analysis. This approach enables the assessment of whether regions with more technologically related knowledge bases provide greater efficiency gains for firms and whether these effects differ across firm types.
Additionally, firm-level heterogeneity may condition how firms benefit from regional knowledge environments. Start-ups, fast-growing medium-sized firms and large R&D performers differ in capabilities, innovation strategies and dependence on local networks (Colombelli, 2016; Luo et al., 2021; Teirlinck and Khoshnevis, 2022). While start-ups and entrepreneurial ecosystems have been widely analysed, less is known about how medium-sized firms engage with regional knowledge structures. Research on this group is often aggregated under the broader small- and medium-sized enterprises category (i.e. Hwang and Oh, 2023; Teirlinck and Khoshnevis, 2022), which tends to overlook distinctions between firm types. By incorporating this dimension, the article provides a more differentiated understanding of firm heterogeneity and how efficiency outcomes vary across firm types within regional contexts.
To the best of our knowledge, this is the first study to incorporate the evolutionary concept of technological relatedness into a stochastic frontier framework of firm efficiency, directly linking regional knowledge structures with firm-level productive performance. It thus bridges two strands of research that have developed largely separately, particularly the literature on production efficiency and productivity analysis (Coelli et al., 2005; Farrell, 1957; Kumbhakar et al., 2012) and on regional diversification and relatedness (Boschma et al., 2015; Hidalgo et al., 2009).
Theoretically, the article extends evolutionary and regional economics perspectives by positioning RD as a determinant of productive efficiency. Rather than treating productivity differences as purely internal to firms, it highlights how external knowledge structures embedded in regions help reduce inefficiency. Empirically, it applies an integrated approach linking firm-level efficiency evaluation with regional measures of technological relatedness, providing new evidence on how regional knowledge bases affect firms of different types.
The empirical analysis focuses on five economic sectors at the NACE two-digit level that are important from an EU regional innovation policy perspective: (1) pharmaceuticals, (2) chemicals, (3) machinery, (4) automotive and (5) computer, electronic and optical products. These sectors were selected based on the following criteria: (1) the sector was a smart specialisation area in various EU regions (S3 Platform), (2) ATs were developed in that sector and (3) new knowledge was typically patented in that sector. To evaluate firm-level production efficiency in these industries, the analysis applies a stochastic frontier analysis (SFA) for the period 2009–2016, with separate estimations by sector and firm type to capture heterogeneity across regional contexts.
The remainder of this article is organised as follows. The next section discusses the related literature; the third section describes the data, methodological approach and model; the fourth section presents empirical results and the fifth section concludes the study.
Literature review
The production efficiency of firms reflects their ability to transform their inputs into outputs relative to the most productive, or attainable, frontier (Coelli et al., 2005; Farrell, 1957). According to the efficiency and productivity literature (Kumbhakar et al., 2012; Sickles and Zelenyuk, 2019), efficiency differences depend on how effectively firms use internal resources. Factors such as capital intensity, human capital, firm size, management quality and innovation capacity influence how efficiently firms transform inputs into outputs.
From a theoretical perspective, these factors originate from the neoclassical growth framework (Solow, 1956), in which efficiency differences reflect variations in technology and factor use. Technological progress, treated as exogenous, shifts the production frontier outwards and explains differences in output not accounted for by capital and labour alone. Later, endogenous growth theory (Howitt and Aghion, 1998; Romer, 1986) demonstrated that technological progress can arise within the economic system, linking productivity growth to investment in knowledge, R&D and human capital. In this view, efficiency represents not only optimal input allocation but also firms’ capacity to generate, absorb and apply knowledge, which is central to models of cumulative innovation and learning.
Building on these theoretical foundations, more recent approaches in regional and evolutionary economics have shifted attention towards the micro-foundations of productivity growth, recognising that technological progress is spatially and institutionally embedded (Balland et al., 2019; Boschma et al., 2015; Lundvall, 1992; Nelson and Winter, 1982). In technology-intensive industries, production efficiency depends not only on resource allocation but also on knowledge dynamics. Such industries are characterised by high R&D intensity, intangible assets and scientific labour, where efficiency relies on firms’ capacity to innovate under uncertainty and manage high innovation costs (Camisón-Haba et al., 2019; Dzemydaitė and Naruševičius, 2023). Consequently, efficiency can be viewed as influenced by internal factors related to firms’ resource endowment and productive capacity and external factors, such as access to regional knowledge, collaboration networks and institutional quality.
From a regional economics perspective, firm efficiency is conditioned by the characteristics of the surrounding innovation system (Asheim et al., 2019; Fritsch and Slavtchev, 2011). Firms do not operate in isolation but benefit from agglomeration economies and the knowledge spillovers among co-located actors. Spatial proximity facilitates interactive learning, informal knowledge exchange and the diffusion of tacit knowledge, reducing search costs and uncertainty in innovation processes (Fritsch and Slavtchev, 2011; Jaffe et al., 1993). By improving access to complementary capabilities and lowering coordination and experimentation costs, such spillovers may allow firms to operate closer to the production frontier.
Building on these insights, several regional factors have been identified as particularly relevant for firm-level efficiency, including agglomeration and market size, which create shared labour and input markets and reduce transaction costs (Amara, 2023; Broekel, 2015; Marshall, 1920), with agglomeration benefits varying between diversified and specialised regional contexts and across stages of firm development (Duranton and Puga, 2001); institutional and human-capital conditions, which enable learning, collaboration and technology diffusion (Capello and Lenzi, 2015); and the regional stock of knowledge, specifically, the regional knowledge base, which provides more opportunities for innovation and firm performance (Acs et al., 2009; Audretsch, 1995). Among these factors, the regional knowledge base merits further discussion. The knowledge spillover theory of entrepreneurship, conceptualised by Audretsch (1995), Audretsch and Lehman (2005) and Acs et al. (2009), implied a relationship between knowledge spillovers and new firm formation, stating that a larger local knowledge base could provide more entrepreneurial opportunities. This literature typically captured the extent of local knowledge using measures such as R&D investments, human capital characteristics, research activities by universities and research centres and intensity of patents (Acs et al., 2009; Bishop, 2012; Bonaccorsi et al., 2014). However, these variables reflect the size of the local knowledge base rather than its structure or nature (Colombelli, 2016).
A second branch of research challenges the assumption that technological knowledge is homogeneous, instead emphasising its heterogeneous and combinatorial nature. According to the recombinant knowledge approach, new knowledge emerges through the combination of related technologies within a region (Boschma et al., 2015; Hidalgo and Hausmann, 2009). In this view, a local knowledge base can be represented as a network of interconnected technologies, where the degree of relatedness reflects opportunities for recombination and capability upgrading. Regions with a broader and more coherent network of related technologies provide a richer environment for firms to integrate complementary knowledge into new products and processes.
While new technologies build on prior knowledge, regions differ in how their knowledge is structured. Regions characterised by technologically related activities tend to form dense networks of complementary capabilities that facilitate knowledge recombination (Boschma et al., 2015). In contrast, regions with fragmented technological portfolios composed of weakly related or isolated activities offer fewer opportunities for such recombination. The related variety literature emphasises that the degree of technological relatedness within a regional knowledge base shapes the potential for combining existing capabilities into new products and processes (Boschma et al., 2015; Colombelli, 2016). Empirical studies using RD as a proxy for the regional knowledge base confirm that such relatedness enhances total factor productivity and supports innovation and diversification processes (Cieślik et al., 2025; Laffi and Boschma, 2022; Dzemydaitė et al., 2025). In this study, the local knowledge base is measured through RD, capturing the combinatorial potential of regional technological capabilities. The expectation is that firms located in regions with higher RD benefit from a more favourable environment for innovation and technological upgrading, which reduces inefficiency. To the best of our knowledge, the recombinant knowledge and relatedness frameworks have not yet been sufficiently applied to studies of production efficiency, particularly in assessing how the regional knowledge base contributes to firms’ productive performance.
However, the strength of this influence is likely to differ across firm types. Start-ups often rely on local entrepreneurial ecosystems and are sensitive to immediate knowledge and financial resources (Colombelli, 2016; Luo et al., 2021). Fast-growing medium-sized firms benefit from diversified regional networks that support scale-up and capability accumulation (Teirlinck and Khoshnevis, 2022). Large R&D-intensive firms, while possessing greater absorptive capacity, often operate within global knowledge networks and depend less on local structures (Holm et al., 2020). This differentiation reflects the interaction between internal and external efficiency mechanisms.
Accordingly, firm performance may be influenced not only by the local knowledge base and its structure but also by access to external knowledge flows. The cluster literature emphasises that external pipelines connecting firms to distant knowledge sources may provide complementary capabilities that are not available locally, thereby introducing new technological opportunities (Bathelt et al., 2004). Recent contributions to the relatedness literature suggest that interregional linkages with regions having complementary technological capabilities can facilitate diversification and technological upgrading (Balland and Boschma, 2021). However, firms differ in their ability to access such external pipelines, as the establishment and maintenance of external linkages require substantial time and resources. Larger firms typically maintain broader international networks that facilitate access to external knowledge sources, whereas smaller firms are often more dependent on locally available knowledge structures. Combining these elements, the conceptual framework assumes that production efficiency depends on firm-level resource endowment and productive capacity, regional knowledge structures and the heterogeneous influence of regional conditions across different firm types. This perspective highlights that efficiency reflects not only how firms use their own resources but also how regional conditions contribute to reducing inefficiency and supporting productive performance. Building on these insights, the following hypotheses are proposed:
Methods and data
Data
This study uses harmonised firm-level, regional and patent data covering the EU, Norway and Switzerland over the period 2009–2016. Firm-level information was derived from two Research Infrastructure for Science and Innovation Policy Studies (RISIS) Core Facility databases: VICO (for start-ups) and Cheetah (for fast-growing medium-sized firms). Regional indicators were obtained from Eurostat, and patent data were taken from the RISIS Patent database (Table A1 in Appendix A).
Firm-level data
The VICO database includes 29,974 early-stage, venture-capital-backed firms in 27 EU countries, the United Kingdom and Israel for the period 1998–2014 (RISIS VICO dataset documentation, Tenca, n.d.). To identify companies, investors and investment deals, VICO relies on three main sources: Thomson One Private Equity, Zephyr and Crunchbase.
The Cheetah database covers 42,369 firms classified as medium-sized and fast-growing, defined by the OECD threshold of average annual employment or turnover growth above 20% over 3 years. A medium-sized firm is defined by combining the Eurostat small medium enterprises (SME) criteria with the French entreprise de taille intermédiaire definition. Fast-growing medium-sized firms are identified as those that experienced rapid growth in employment or turnover in at least one of the periods 2008–2011, 2009–2012 or 2010–2013 (RISIS Cheetah dataset documentation, Guerini, n.d.). The main data source for medium-sized firms is the Orbis database. Firms with missing turnover information were removed during the RISIS data construction stage. Missing employment values were imputed by RISIS developers using predicted values based on firm turnover, age, industry, country and year fixed effects.
Regional and patent-based data
Patent data were drawn from the RISIS Patent database, which includes all priority patents applied for in all national or regional patent offices. Patents were geocoded according to the inventors’ addresses, which represent the geographical locations where the invention was developed. These inventor-based locations are then assigned to NUTS2 regions, capturing the spatial distribution of local inventive activity underlying the regional knowledge base. Regional indicators were extracted from Eurostat to capture the economic and innovation environment of European NUTS2 regions.
Mapping and sample construction
All RISIS firm-level databases provide harmonised indicators such as firms’ assets, employment and value added. Each firm was geographically assigned to a NUTS2 region according to its registered address, enabling the firm-level data to be linked to regional characteristics. This approach is more appropriate for start-ups and medium-sized firms than for large R&D firms, as activities of these firms are typically concentrated within a limited number of locations. Accordingly, the econometric analysis focuses on start-ups and medium-sized firms, while large firms are used only for contextual comparison.
Firms were also assigned to economic sectors according to their main NACE Rev. 2 activity codes. For start-ups (VICO) and fast-growing medium-sized firms (Cheetah), these codes were taken from the original firm-level sources and harmonised within the RISIS infrastructure. The RISIS facilities provided geocoded data with NUTS2-level regional identifiers and NACE Rev. 2 sector codes, which we applied directly in the analysis.
All procedures related to data construction and treatment of missing information are documented in the official RISIS database manuals; we used the harmonised data as provided. Because firms are observed for different numbers of years, the resulting panel is unbalanced. As the firm data originate from the RISIS Core Facility, the analysis is limited to the information available within these databases.
Tables D1–D5 in Appendix D provide descriptive statistics for the main variables and sample. As expected, the average number of employees increases with the firm size. Start-ups show the highest capital intensity, with the largest fixed assets per employee across all economic sectors. Medium-sized firms are the least capital-intensive group, with lower fixed assets, except in the chemical sector, and lower productivity levels than start-ups and large firms. In comparison, large R&D corporate performers have the highest employment levels and productivity. At the regional level, indicators such as RD, R&D expenditure, population density and industrial diversity reveal substantial variation across NUTS2 regions, reflecting uneven development conditions in Europe.
Selection of economic sectors
Economic sectors were selected according to the policy interest and nature of patenting activities regarding new knowledge, based on the following criteria. Firstly, this study included economic sectors contributing to the development of ATs. The Advanced Technologies for Industry (ATI) project, launched by the EU to monitor technological trends and provide current data on ATs, identified 16 technologies (key enabling and digital) expected to substantially transform business and society (Izsak et al., 2020). Based on the ATI project’s data on patenting activities across ATs that could be attributed to economic sectors via the applicant firms, we identified six economic sectors where new knowledge in ATs was patented: medical devices, pharmaceuticals, automotive, chemicals, machinery and electronic sectors. The share of AT patents in these sectors varied between approximately 1% and 17% (Table 1).
Economic sectors and their role in AT and smart specialisation strategies.
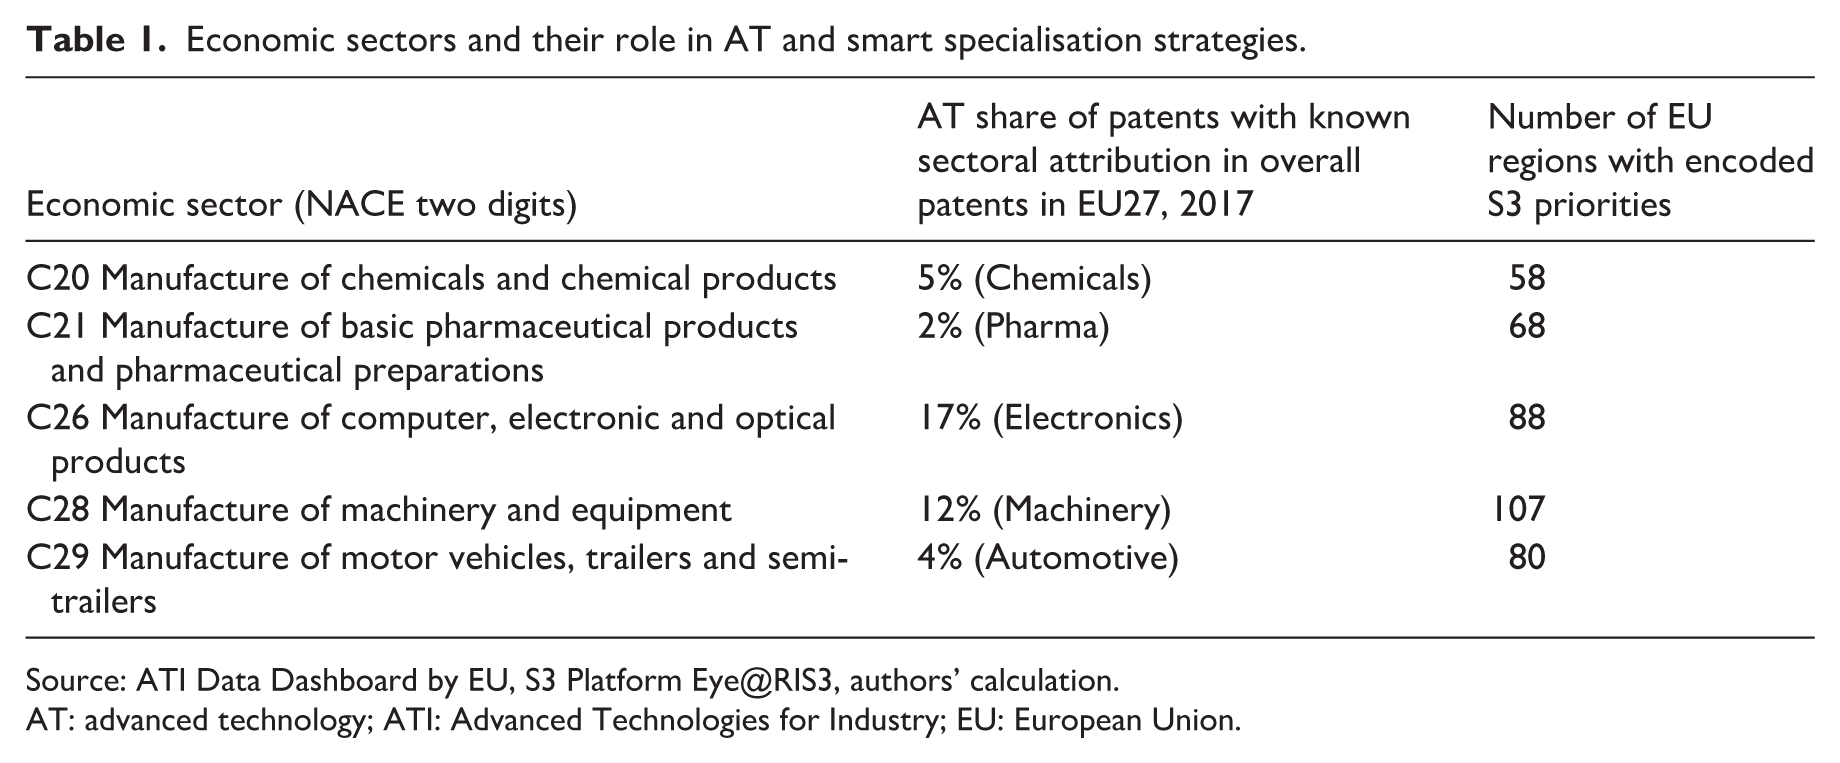
Source: ATI Data Dashboard by EU, S3 Platform Eye@RIS3, authors’ calculation.
AT: advanced technology; ATI: Advanced Technologies for Industry; EU: European Union.
We then associated the general sector names from the ATI project with NACE Rev. 2 two-digit classifications. It was difficult to associate medical devices with a single NACE division, as related activities are distributed across several sectors (mainly C32.5 and C26.6). Therefore, we included five economic sectors (NACE two-digit) in the analysis. Activities related to medical devices were partly covered under C26 (Manufacture of computers, electronic and optical products).
The second step in evaluating the importance of these sectors involved assessing their role in regional smart specialisation priorities. Evidence from the S3 Platform indicates that these sectors have high policy relevance across Europe, with 58–107 regions identifying them as priority areas (Table 1).
An approach to production efficiency modelling
Production efficiency modelling stems from the seminal work by Farrell (1957), whose initial idea was to examine how far a firm or sector could increase its outputs without increasing inputs by improving its efficiency. Over the past few decades, parametric and non-parametric approaches have been widely applied in efficiency studies, both having advantages and limitations (Sickles and Zelenyuk, 2019). Parametric models, such as the SFA, enable the estimation of production elasticities and identification of factors influencing inefficiency while controlling for statistical noise. External conditions and their influence on firm-level performance can also be incorporated into this type of analysis (Mandl et al., 2008). Conversely, non-parametric methods do not provide insights into the elasticities of explanatory variables and are limited in their ability to capture time dynamics and slacks (Sickles and Zelenyuk, 2019).
Given that our data combine firm-level and regional information over several years, we employ a panel SFA model to analyse production efficiency. This approach is well-suited to the research context, as it captures changes in efficiency over time and enables the estimation of production elasticities and inefficiency determinants within a single framework (Battese and Coelli, 1995; Sickles and Zelenyuk, 2019). SFA was selected for its ability to capture firm-level inefficiency and shifts in the available frontier technologies (Mandl et al., 2008; Sickles and Zelenyuk, 2019). Moreover, stochastic frontier modelling is a common technique for measuring technical efficiency in regional studies (Glass and Kenjegalieva, 2024).
A key assumption of SFA is that all firms in a given industry share the same production technology. Because our sample involves different sectors, we estimated frontiers separately by sector rather than using one pooled model. In SFA, the estimated frontier represents the best-practice production technology under a given input–output structure. If sectors differ technologically, estimating a common frontier assumes a single production benchmark across industries, which may bias efficiency comparisons. For example, the pharmaceutical sector is characterised by long R&D cycles and strict regulation, whereas the electronics sector operates under short product life cycles, reflecting distinct production processes. Sector-specific estimation, therefore, improves precision by allowing each industry’s technology and inefficiency parameters to vary (Coelli et al., 2005; Kumbhakar et al., 2012).
The model and variables
We apply a one-step estimation procedure rather than the two-step approach, as this enables inefficiency factors to be estimated jointly with the production frontier, avoiding potential bias arising from the correlation between inefficiency effects and the error term (Battese and Coelli, 1995). We assume a translog production function with inefficiency terms following a half-normal distribution, consistent with standard applications in firm-level efficiency studies (Battese and Coelli, 1995; Mandl et al., 2008; Sickles and Zelenyuk, 2019). This approach provides consistent estimates of how firm-level characteristics and regional conditions affect production efficiency.
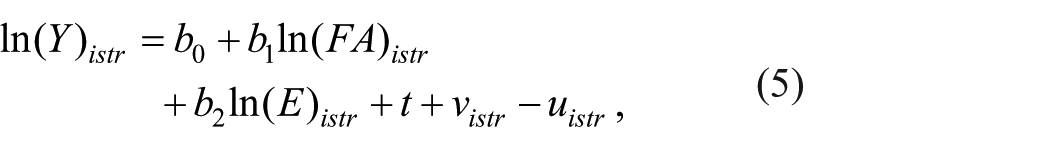
The SFA model follows the one-step estimation specification introduced by Battese and Coelli (1995). The model for firm i operating in sector s, region r and year t is specified as:

where Yisrt is the firm’s production output, Xisrt is a vector of inputs and visrt is a random error term distributed as

where
The dependent variable was value added per employee, which reflects firm-level productivity. Per employee values are considered to standardise data and eliminate firm-size effects (Crépon et al., 1998; Kumbhakar et al., 2012). Firm-level inputs include fixed assets per employee (FA), approximating capital intensity and the number of employees (E), which captures scale effects in production (Kumbhakar et al., 2012). These variables were taken from the RISIS databases and expressed in logarithmic form.
Fixed assets consist of both tangible and intangible components. A tangible asset represents physical capital used in production, such as machinery, equipment and buildings (International Accounting Standard 16). An intangible asset, by contrast, is a non-monetary asset without physical substance, including items such as patented technologies, trademarks, licences, software and trade secrets (International Accounting Standard 38). Intangible assets constitute an important component of firm performance because they represent the accumulated results of past knowledge investments and innovation efforts and therefore form a stock of knowledge capital used in current production.
However, not all intangible assets, understood as knowledge-based capital, are fully captured in official financial reports (Corrado et al., 2022). Due to inconsistencies in accounting practices, internally generated intangibles are often excluded from official financial reports. Productivity studies, such as those conducted under the EUKLEMS and INTANProd projects, have sought to address these limitations by providing a measurement of intangible assets (Bontadini et al., 2023). However, these data are not available at the micro level for our sample. Therefore, our analysis is constrained to the intangible assets reported in firms’ official financial accounts.
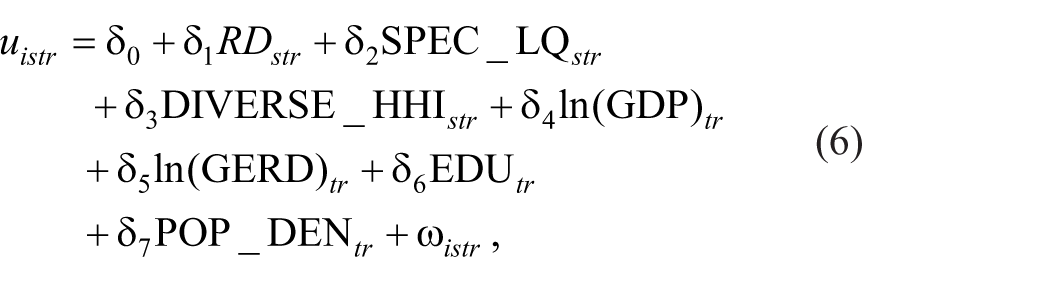
Some studies measure innovation activity using R&D expenditures or patent counts. Such indicators, however, are not consistently available in the harmonised microdata used in this study. We therefore rely on accounting-based measures of intangible assets reported in firms’ financial statements, which provide a proxy for the accumulated stock of knowledge capital resulting from past R&D and innovation investments and are treated here as productive inputs in the estimation of the production frontier. As these assets reflect accumulated firm-level investments rather than current innovation outputs, they represent knowledge capital used in production. An inefficiency term uisrt is modelled as a function of regional characteristics that may impact firms’ capacity to transform inputs into outputs. These regional-level indicators include the local knowledge base in a particular economic sector (RD) besides the other contextual conditions.
The local knowledge base (RD) was evaluated using a proximity approach originally developed by Hidalgo et al. (2007) to measure product space and later widely used in studies of technology space and industry diversification. Patent data were used as a proxy for knowledge creation and inventions (Boschma et al., 2015). First, the RD was calculated for each technological domain at the NUTS2 regional level following Boschma et al. (2015) using the EconGeo package in R (Balland, 2017). An indicator relevant to economic sectors rather than specific technologies was obtained by aggregating these technology-level values to the industry level by weighting each technology’s RD based on its share of patents within the corresponding sector. The weights were derived from patenting data for large R&D-performing firms, which enabled patents to be matched to firms and firms to their NACE sectors. A higher RD indicator in a region reflects a stronger local knowledge base and greater potential for knowledge recombination. Appendix C details the evaluation of RD.
Besides RD, we included regional variables that are commonly employed in regional and innovation studies to capture key contextual conditions influencing firms’ productive efficiency (Amara, 2023; Broekel, 2015; Ketels and Protsiv, 2021). Population density (POP_DEN) proxies urbanisation economies and agglomeration effects (Broekel, 2015; Marshall, 1920). The gross domestic product per capita (GDP) reveals the size of the local market and regional demand conditions that shape firms’ scale opportunities. The society’s tertiary education (EDU), considering the quality of human capital and total intramural expenditure on R&D (GERD), capture the knowledge-generation capacity of regions, which is central to regional innovation systems (Asheim et al., 2019; Fritsch and Slavtchev, 2011).
Potential effects of a region’s industrial agglomeration were accounted for by estimating the location coefficient of employees in a particular economic sector (SPEC_LQ). This indicator reflects sectoral specialisation and firms’ exposure to Marshall–Arrow–Romer (MAR) localisation externalities and was calculated as:

where

Together, these regional variables reveal key structural features of local environments that may influence firms’ productive efficiency.
Assuming a log-linear relationship, the empirical SFA model specification could then be summarised as:
where Yistr = value added per employee at firm i in industry s at time period t in region r (i = 1 . . . N, s = 1 . . . N and t = 1 . . . Ti), FA = fixed assets per employee,
1
E = number of employees; t = time trend for Hicks-neural technical change; visrt = random noise
where the random variable
Estimation results
Tables 2 and 3 present the estimation results for equations (3) and (4), whose parameters were estimated simultaneously. The analysis was performed separately for start-ups and fast-growing medium-sized firms across five economic sectors.
Model parameters and efficiency estimates for start-ups.
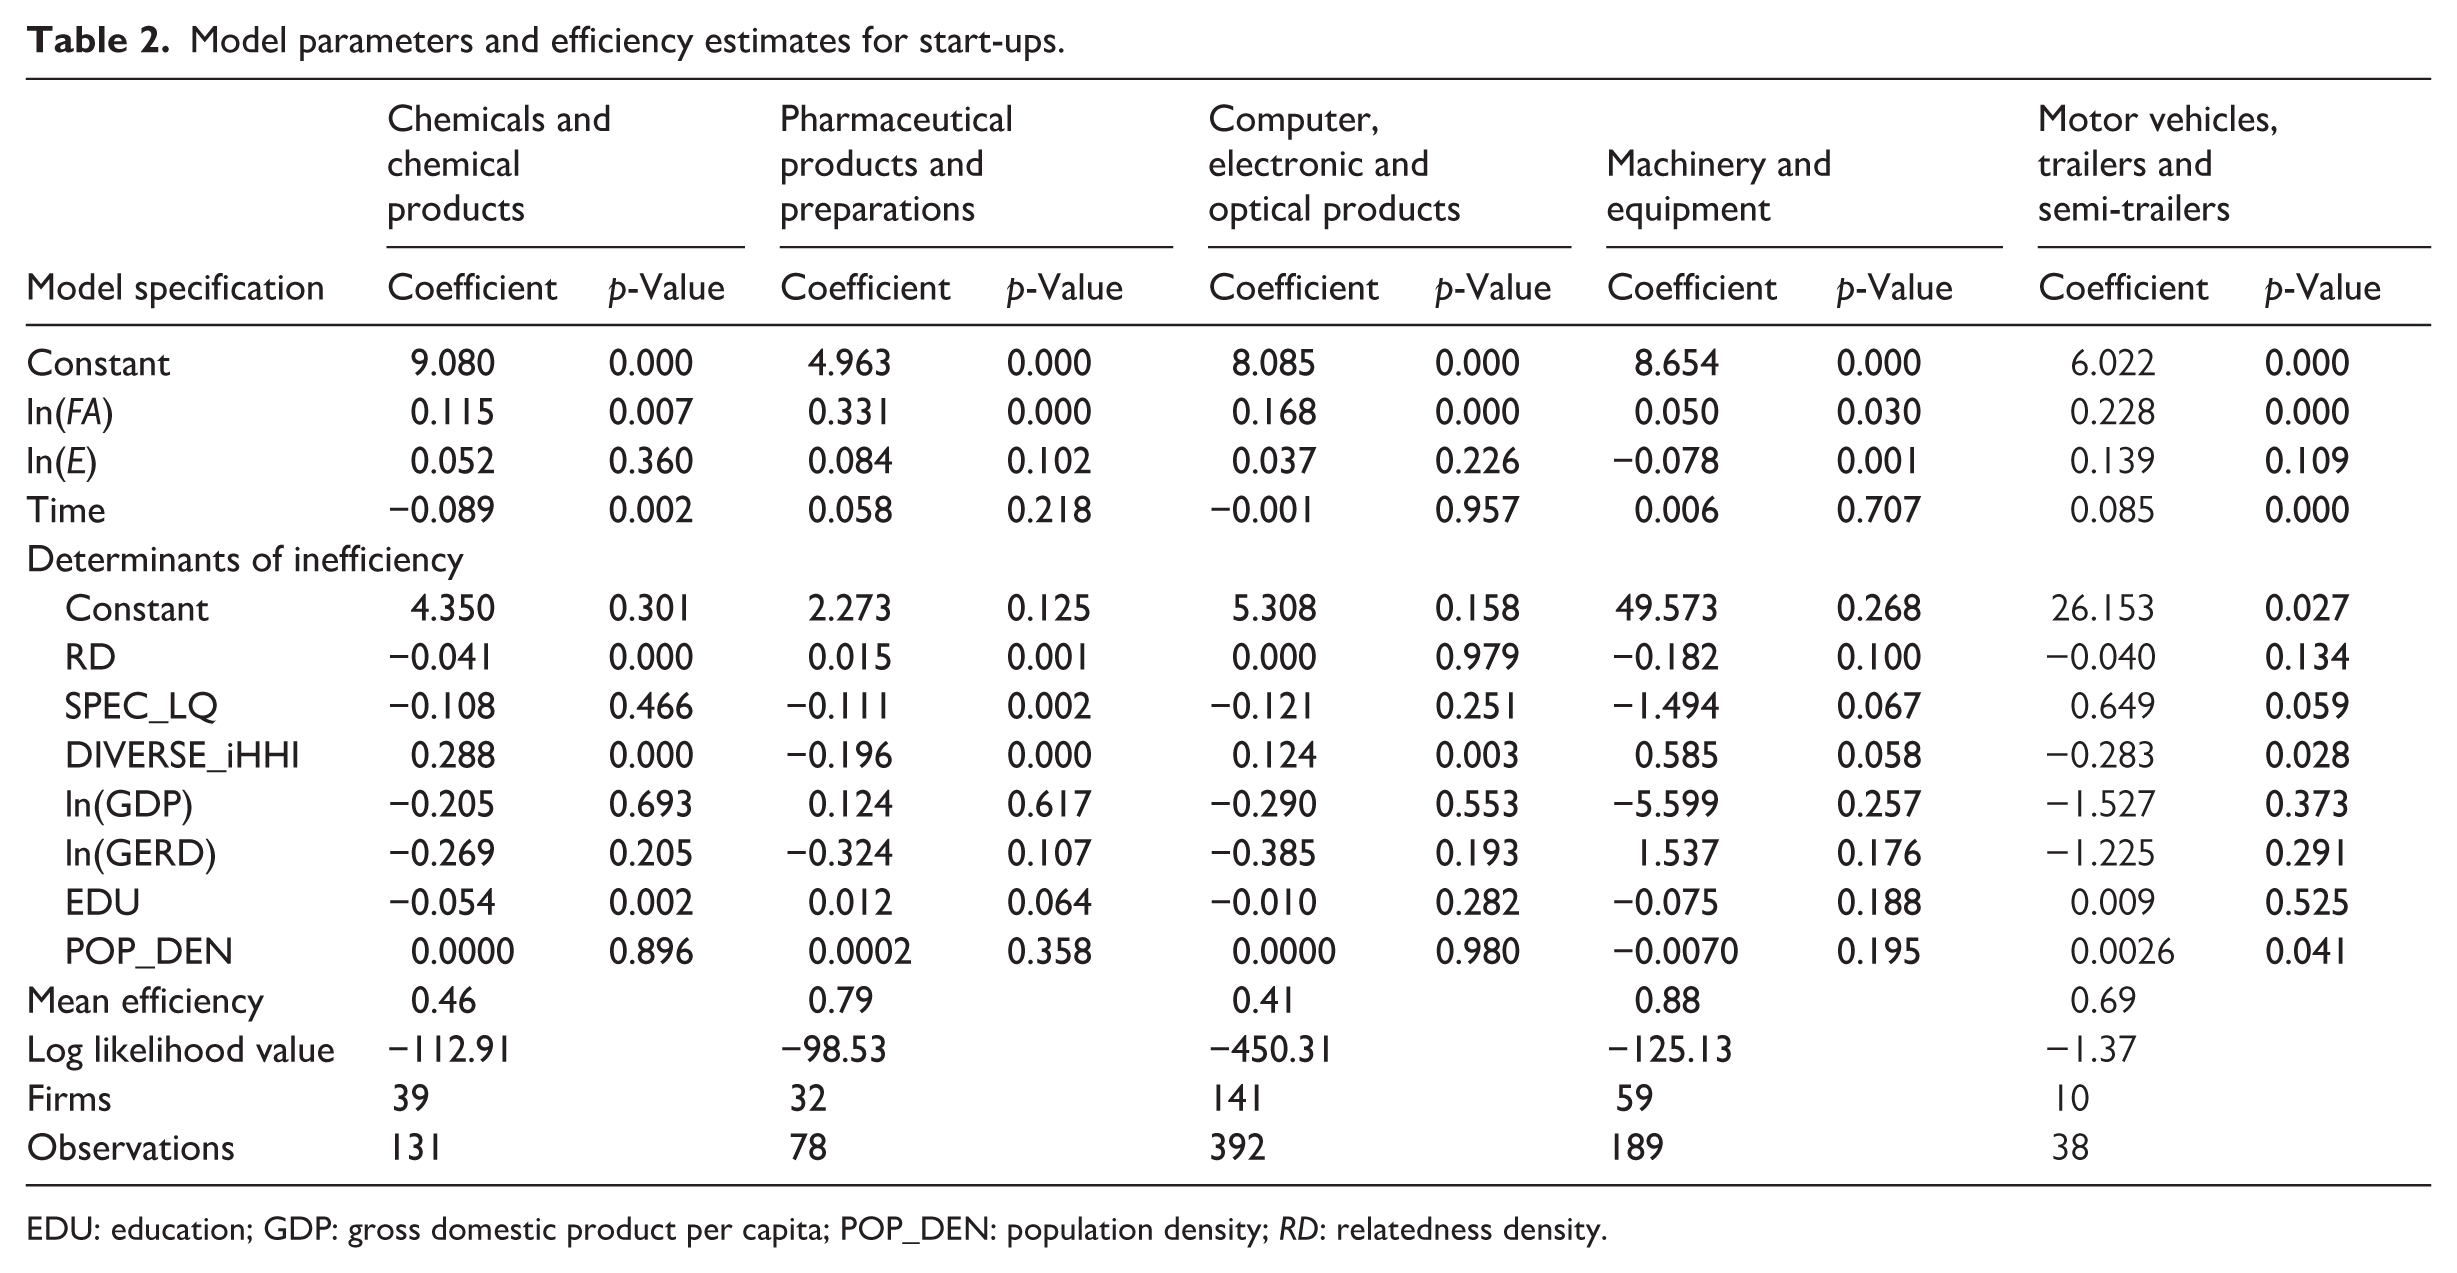
EDU: education; GDP: gross domestic product per capita; POP_DEN: population density; RD: relatedness density.
Model parameters and efficiency estimates for fast-growing medium-sized firms.
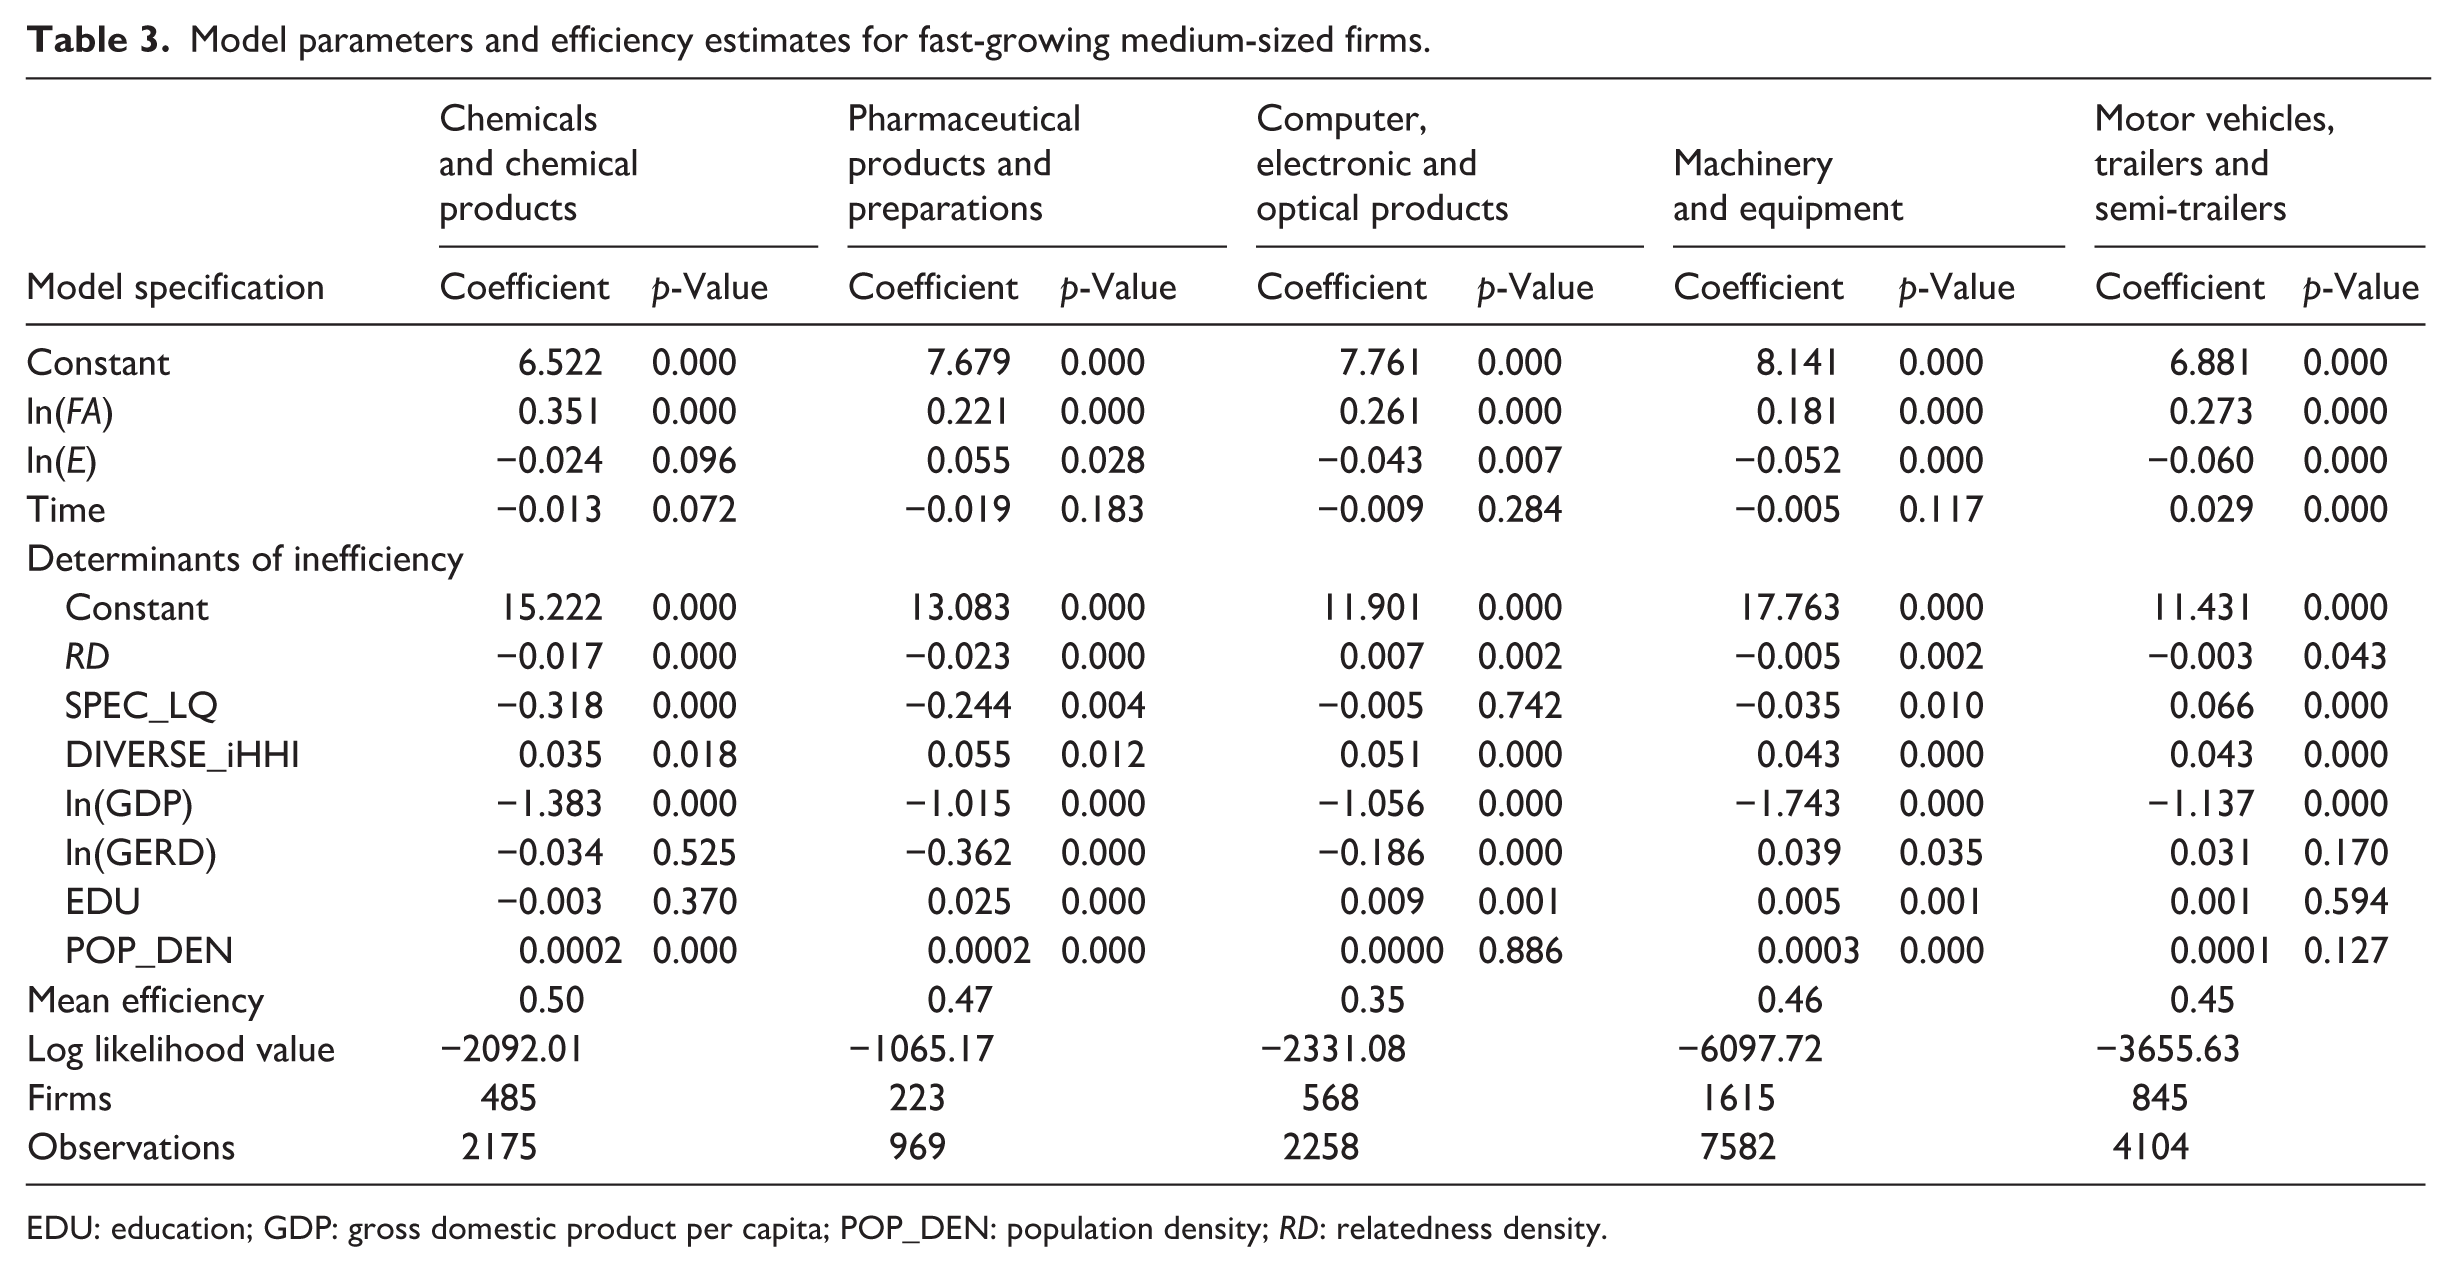
EDU: education; GDP: gross domestic product per capita; POP_DEN: population density; RD: relatedness density.
Across both firm categories, fixed assets per employee showed a positive and statistically significant effect on output efficiency, supporting that capital intensity shifts the production frontier outwards. In medium-sized firms (Table 3), the magnitude of the coefficients ranged from 0.18 to 0.35. Start-ups (Table 2) had lower elasticities for FA in most of the sectors analysed (0.05–0.33), highlighting that while capital investment is beneficial, the scale of operations and nature of start-ups may limit the impact relative to larger firms. Additionally, start-up firms may employ intangible assets not accounted for in official reports (Corrado et al., 2022). Overall, this pattern indicates increasing efficiency gains from physical capital accumulation as firms grow in scale and technological maturity.
The mean efficiency score, the average of firm-specific estimates of technical efficiency 2 within a specific firm size and economic sector, further reflects differences between firm types. The mean efficiency score was 0.41–0.88 for start-ups and 0.35–0.5 for medium-sized firms, indicating substantial efficiency gaps across firms.
The coefficient of the number of employees (E) showed mixed results. In medium-sized firms (Table 3), negative elasticities (−0.06 to −0.02) suggest decreasing returns to scale or underuse of labour. Conversely, for start-ups, the coefficients were small and mainly insignificant, implying that efficiency variations are driven more by technological and managerial factors than by labour scale (Brand et al., 2021).
The determinants of inefficiency show the importance of regional and structural factors. For fast-growing medium-sized firms, the coefficient of RD was negative and significant in many sectors (e.g. chemicals −0.017, pharmaceutical products −0.023 and machinery −0.005). This result indicates that firms located in regions with richer interconnections among technologies achieve lower inefficiency; that is, firms tend to be more efficient in these regions.
The coefficients for specialisation and diversity show that local industrial structures shape firm efficiency differently across sizes. For medium-sized firms, SPEC_LQ had negative and significant coefficients (e.g. −0.32 for chemicals), implying that local technological specialisation enhances efficiency through MAR externalities. Conversely, start-ups benefited from a diversified environment in the pharmaceutical and automotive sectors, supporting the concept that new firms profit from cross-sectoral knowledge recombination (Jacobs’ externalities).
This pattern is consistent with Duranton and Puga’s (2001) nursery-city model. Their framework suggests that new products, and thus young firms, emerge in diversified, multi-industry cities where they could borrow trying processes from different activities. As firms grow, they tend to relocate to more specialised locations that offer concentrated sector-specific know-how and lower production costs.
The regional GDP significantly reduced inefficiency in fast-growing medium-sized firms in all sectors (−1.0 to −1.7), while GERD was significant only in the pharmaceutical and computer sectors. This result indicates that local market size and demand have a more positive influence on efficiency than R&D intensity. Education and population density mainly had weaker or insignificant effects.
Descriptive comparisons with large R&D firms indicate that these firms have higher efficiency scores and operate closer to the efficiency frontier (Table D4). This result indicates that in many cases, large firms are more capital-intensive than smaller firms and receive sufficient efficiency gains from asset accumulation (Kumbhakar et al., 2012; Moncada-Paternò-Castello, 2022). However, their weaker association with regional characteristics is consistent with their multi-establishment structures and reliance on global knowledge networks, as a substantial share of inventive activities of large firms is located outside the region in which the company is registered (Table B1 in Appendix B).
Overall, the empirical analysis supports that the local knowledge base enhances production efficiency, which is consistent with Hypothesis 1. The positive impact of RD on efficiency is particularly visible for fast-growing medium-sized firms and, to a lesser extent, start-ups, therefore also supporting Hypothesis 2. These findings highlight that regional knowledge recombination acts as an enabling condition for firm-level production efficiency, with its effects mediated by the firm size, technological intensity and structure of regional specialisation.
Discussion and conclusions
This article analysed the production efficiency of start-ups and fast-growing medium-sized firms in European regions, with a particular focus on the role of regional knowledge structures. By combining a stochastic frontier framework with measures of technological relatedness, the study extended productive efficiency analysis by drawing on evolutionary and regional economics. It thus examined how internal firm resources and external regional knowledge conditions jointly shaped firms’ performances in AT sectors.
Three main findings emerge from the analysis. First, firm-specific tangible and intangible fixed assets consistently shift the production frontier across all firm-size groups and sectors. Second, regional knowledge conditions, particularly the structure of the local knowledge base and market size, significantly reduce inefficiency for fast-growing medium-sized firms. Third, start-ups depend mainly on internal technological capabilities. The patterns observed for start-ups are consistent with existing empirical evidence. Conversely, the pronounced and consistent sensitivity of medium-sized firms to regional knowledge structures represents the most distinctive contribution of this study.
These results highlight the structural role of fast-growing medium-sized firms in European regional development. While many EU regions have selected ATs as smart specialisation priorities, only a limited number host large global R&D leaders. The estimates show that medium-sized firms in several regions operate close to the production efficiency frontier, indicating their potential to become future innovation leaders if supported by coherent regional knowledge environments. This support the existence of a “missing middle” in regional innovation systems, suggesting that medium-sized firms constitute an important transmission channel between local knowledge bases and regional productivity growth.
From a European competitiveness perspective, the findings imply that strengthening regional knowledge structures primarily benefits firms large enough to scale but still locally embedded. Start-ups may succeed in niche technological domains even in fragmented knowledge environments; however, their scaling into medium-sized firms increasingly depends on access to a broader and more coherent regional knowledge base. Conversely, large R&D corporate performers typically draw predominantly on global innovation networks. This asymmetry explains why regional policies often struggle to retain and scale successful start-ups into globally competitive firms.
Several policy implications follow. Regional and innovation policies could place greater emphasis on supporting fast-growing medium-sized firms, in addition to start-ups and large R&D players. The results suggest that policy effectiveness depends not only on expanding regional R&D intensity but also on strengthening the internal relatedness of regional technological portfolios to enhance knowledge recombination. Continued support for knowledge-based fixed asset investment remains important, given its robust frontier-shifting effect across all firm types in AT sectors. Together, these findings contribute to current debates on smart specialisation and cohesion policy in regions seeking to transcend the start-up phase.
The results also have managerial implications. Managers of start-ups should prioritise the accumulation of firm-specific technological and asset-based capabilities, as these dominate efficiency performance in the early stages. Managers of medium-sized firms may benefit substantially from active engagement with regional research organisations, universities and technologically related local firms to exploit local knowledge complementarities.
Finally, this study is subject to several limitations. The analysis relies on patent-based measures of knowledge that capture only codified innovation, while tacit and symbolic knowledge remains unobserved (Asheim, 2007; Asheim et al., 2017; Howells, 2012). Moreover, the empirical design focuses primarily on the regional knowledge base and therefore cannot directly observe the role of interregional knowledge linkages or firm-internal global networks that may complement local knowledge spillovers (Balland and Boschma, 2021; Bathelt et al., 2004). Additionally, the data cover the period 2009–2016, with RISIS data, and therefore do not fully reflect post-pandemic adjustments and digital transformation dynamics. Future research could integrate differentiated knowledge bases using mixed-method approaches to further deepen understanding of regional–firm productivity links.
Footnotes
Appendix A
Statistical data sources.
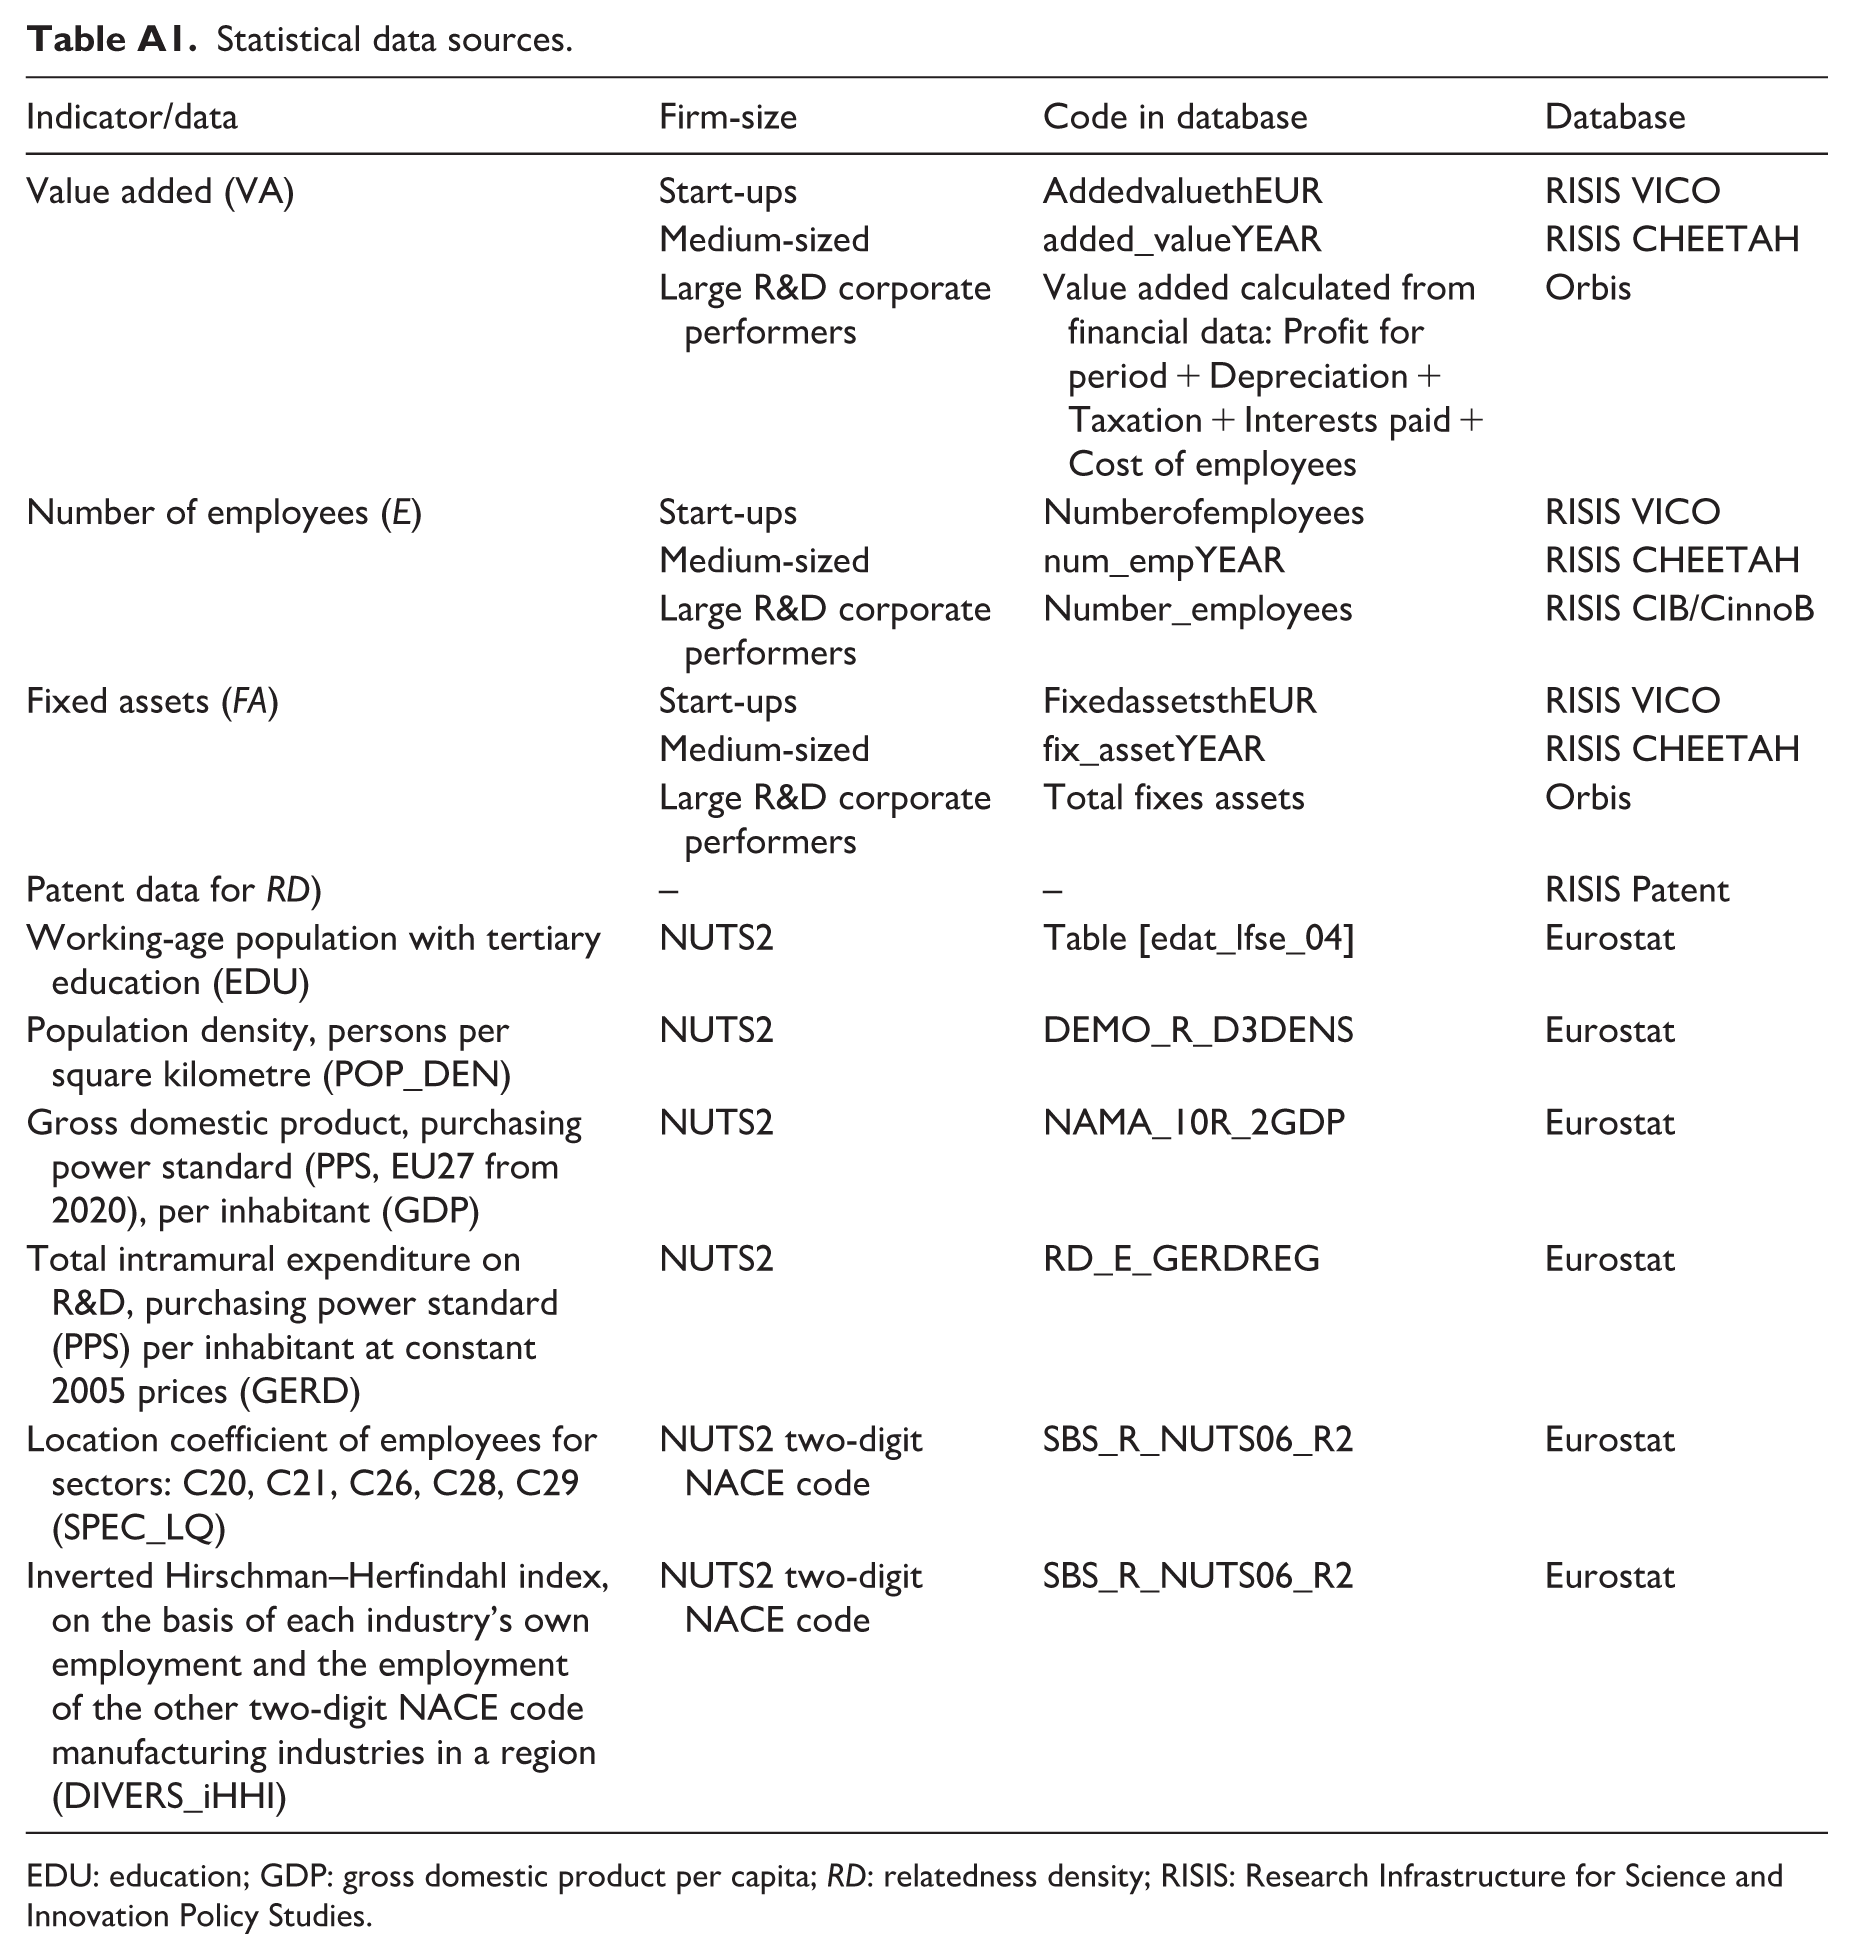
| Indicator/data | Firm-size | Code in database | Database |
|---|---|---|---|
| Value added (VA) | Start-ups | AddedvaluethEUR | RISIS VICO |
| Medium-sized | added_valueYEAR | RISIS CHEETAH | |
| Large R&D corporate performers | Value added calculated from financial data: Profit for period + Depreciation + Taxation + Interests paid + Cost of employees | Orbis | |
| Number of employees (E) | Start-ups | Numberofemployees | RISIS VICO |
| Medium-sized | num_empYEAR | RISIS CHEETAH | |
| Large R&D corporate performers | Number_employees | RISIS CIB/CinnoB | |
| Fixed assets (FA) | Start-ups | FixedassetsthEUR | RISIS VICO |
| Medium-sized | fix_assetYEAR | RISIS CHEETAH | |
| Large R&D corporate performers | Total fixes assets | Orbis | |
| Patent data for RD) | – | – | RISIS Patent |
| Working-age population with tertiary education (EDU) | NUTS2 | Table [edat_lfse_04] | Eurostat |
| Population density, persons per square kilometre (POP_DEN) | NUTS2 | DEMO_R_D3DENS | Eurostat |
| Gross domestic product, purchasing power standard (PPS, EU27 from 2020), per inhabitant (GDP) | NUTS2 | NAMA_10R_2GDP | Eurostat |
| Total intramural expenditure on R&D, purchasing power standard (PPS) per inhabitant at constant 2005 prices (GERD) | NUTS2 | RD_E_GERDREG | Eurostat |
| Location coefficient of employees for sectors: C20, C21, C26, C28, C29 (SPEC_LQ) | NUTS2 two-digit NACE code | SBS_R_NUTS06_R2 | Eurostat |
| Inverted Hirschman–Herfindahl index, on the basis of each industry’s own employment and the employment of the other two-digit NACE code manufacturing industries in a region (DIVERS_iHHI) | NUTS2 two-digit NACE code | SBS_R_NUTS06_R2 | Eurostat |
EDU: education; GDP: gross domestic product per capita; RD: relatedness density; RISIS: Research Infrastructure for Science and Innovation Policy Studies.
Appendix B
Location of inventories of large R&D corporate performers in European NUTS2 regions (EU, Norway and Switzerland) in 2000–2015.
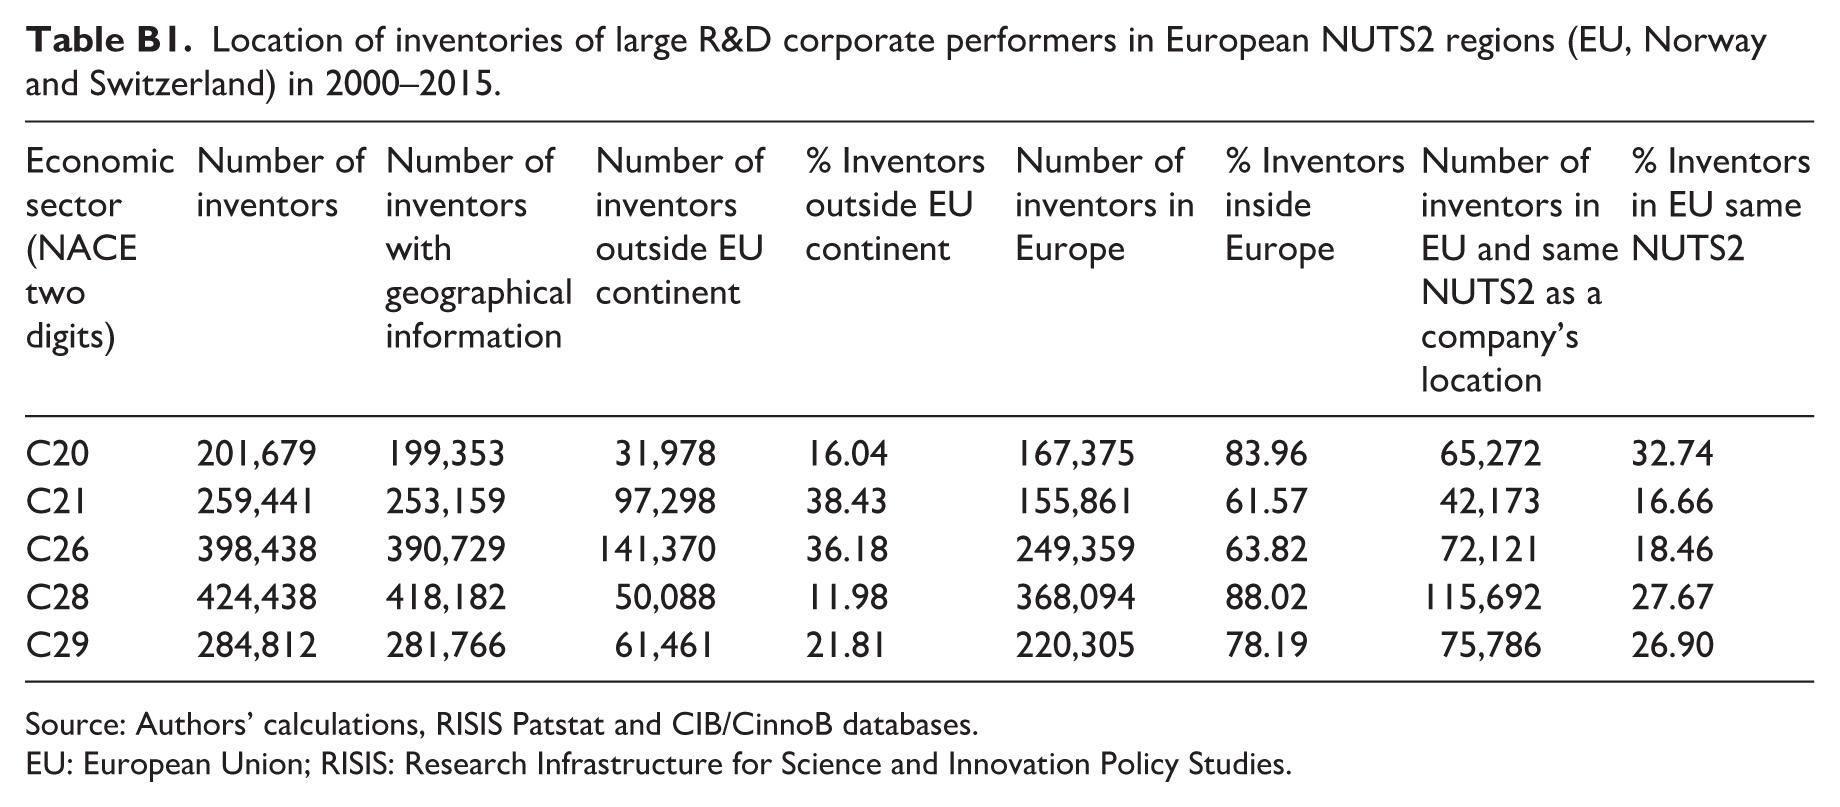
| Economic sector (NACE two digits) | Number of inventors | Number of inventors with geographical information | Number of inventors outside EU continent | % Inventors outside EU continent | Number of inventors in Europe | % Inventors inside Europe | Number of inventors in EU and same NUTS2 as a company’s location | % Inventors in EU same NUTS2 |
|---|---|---|---|---|---|---|---|---|
| C20 | 201,679 | 199,353 | 31,978 | 16.04 | 167,375 | 83.96 | 65,272 | 32.74 |
| C21 | 259,441 | 253,159 | 97,298 | 38.43 | 155,861 | 61.57 | 42,173 | 16.66 |
| C26 | 398,438 | 390,729 | 141,370 | 36.18 | 249,359 | 63.82 | 72,121 | 18.46 |
| C28 | 424,438 | 418,182 | 50,088 | 11.98 | 368,094 | 88.02 | 115,692 | 27.67 |
| C29 | 284,812 | 281,766 | 61,461 | 21.81 | 220,305 | 78.19 | 75,786 | 26.90 |
Source: Authors’ calculations, RISIS Patstat and CIB/CinnoB databases.
EU: European Union; RISIS: Research Infrastructure for Science and Innovation Policy Studies.
Appendix C
Appendix D
Model parameters and efficiency estimates for large R&D corporate performers.
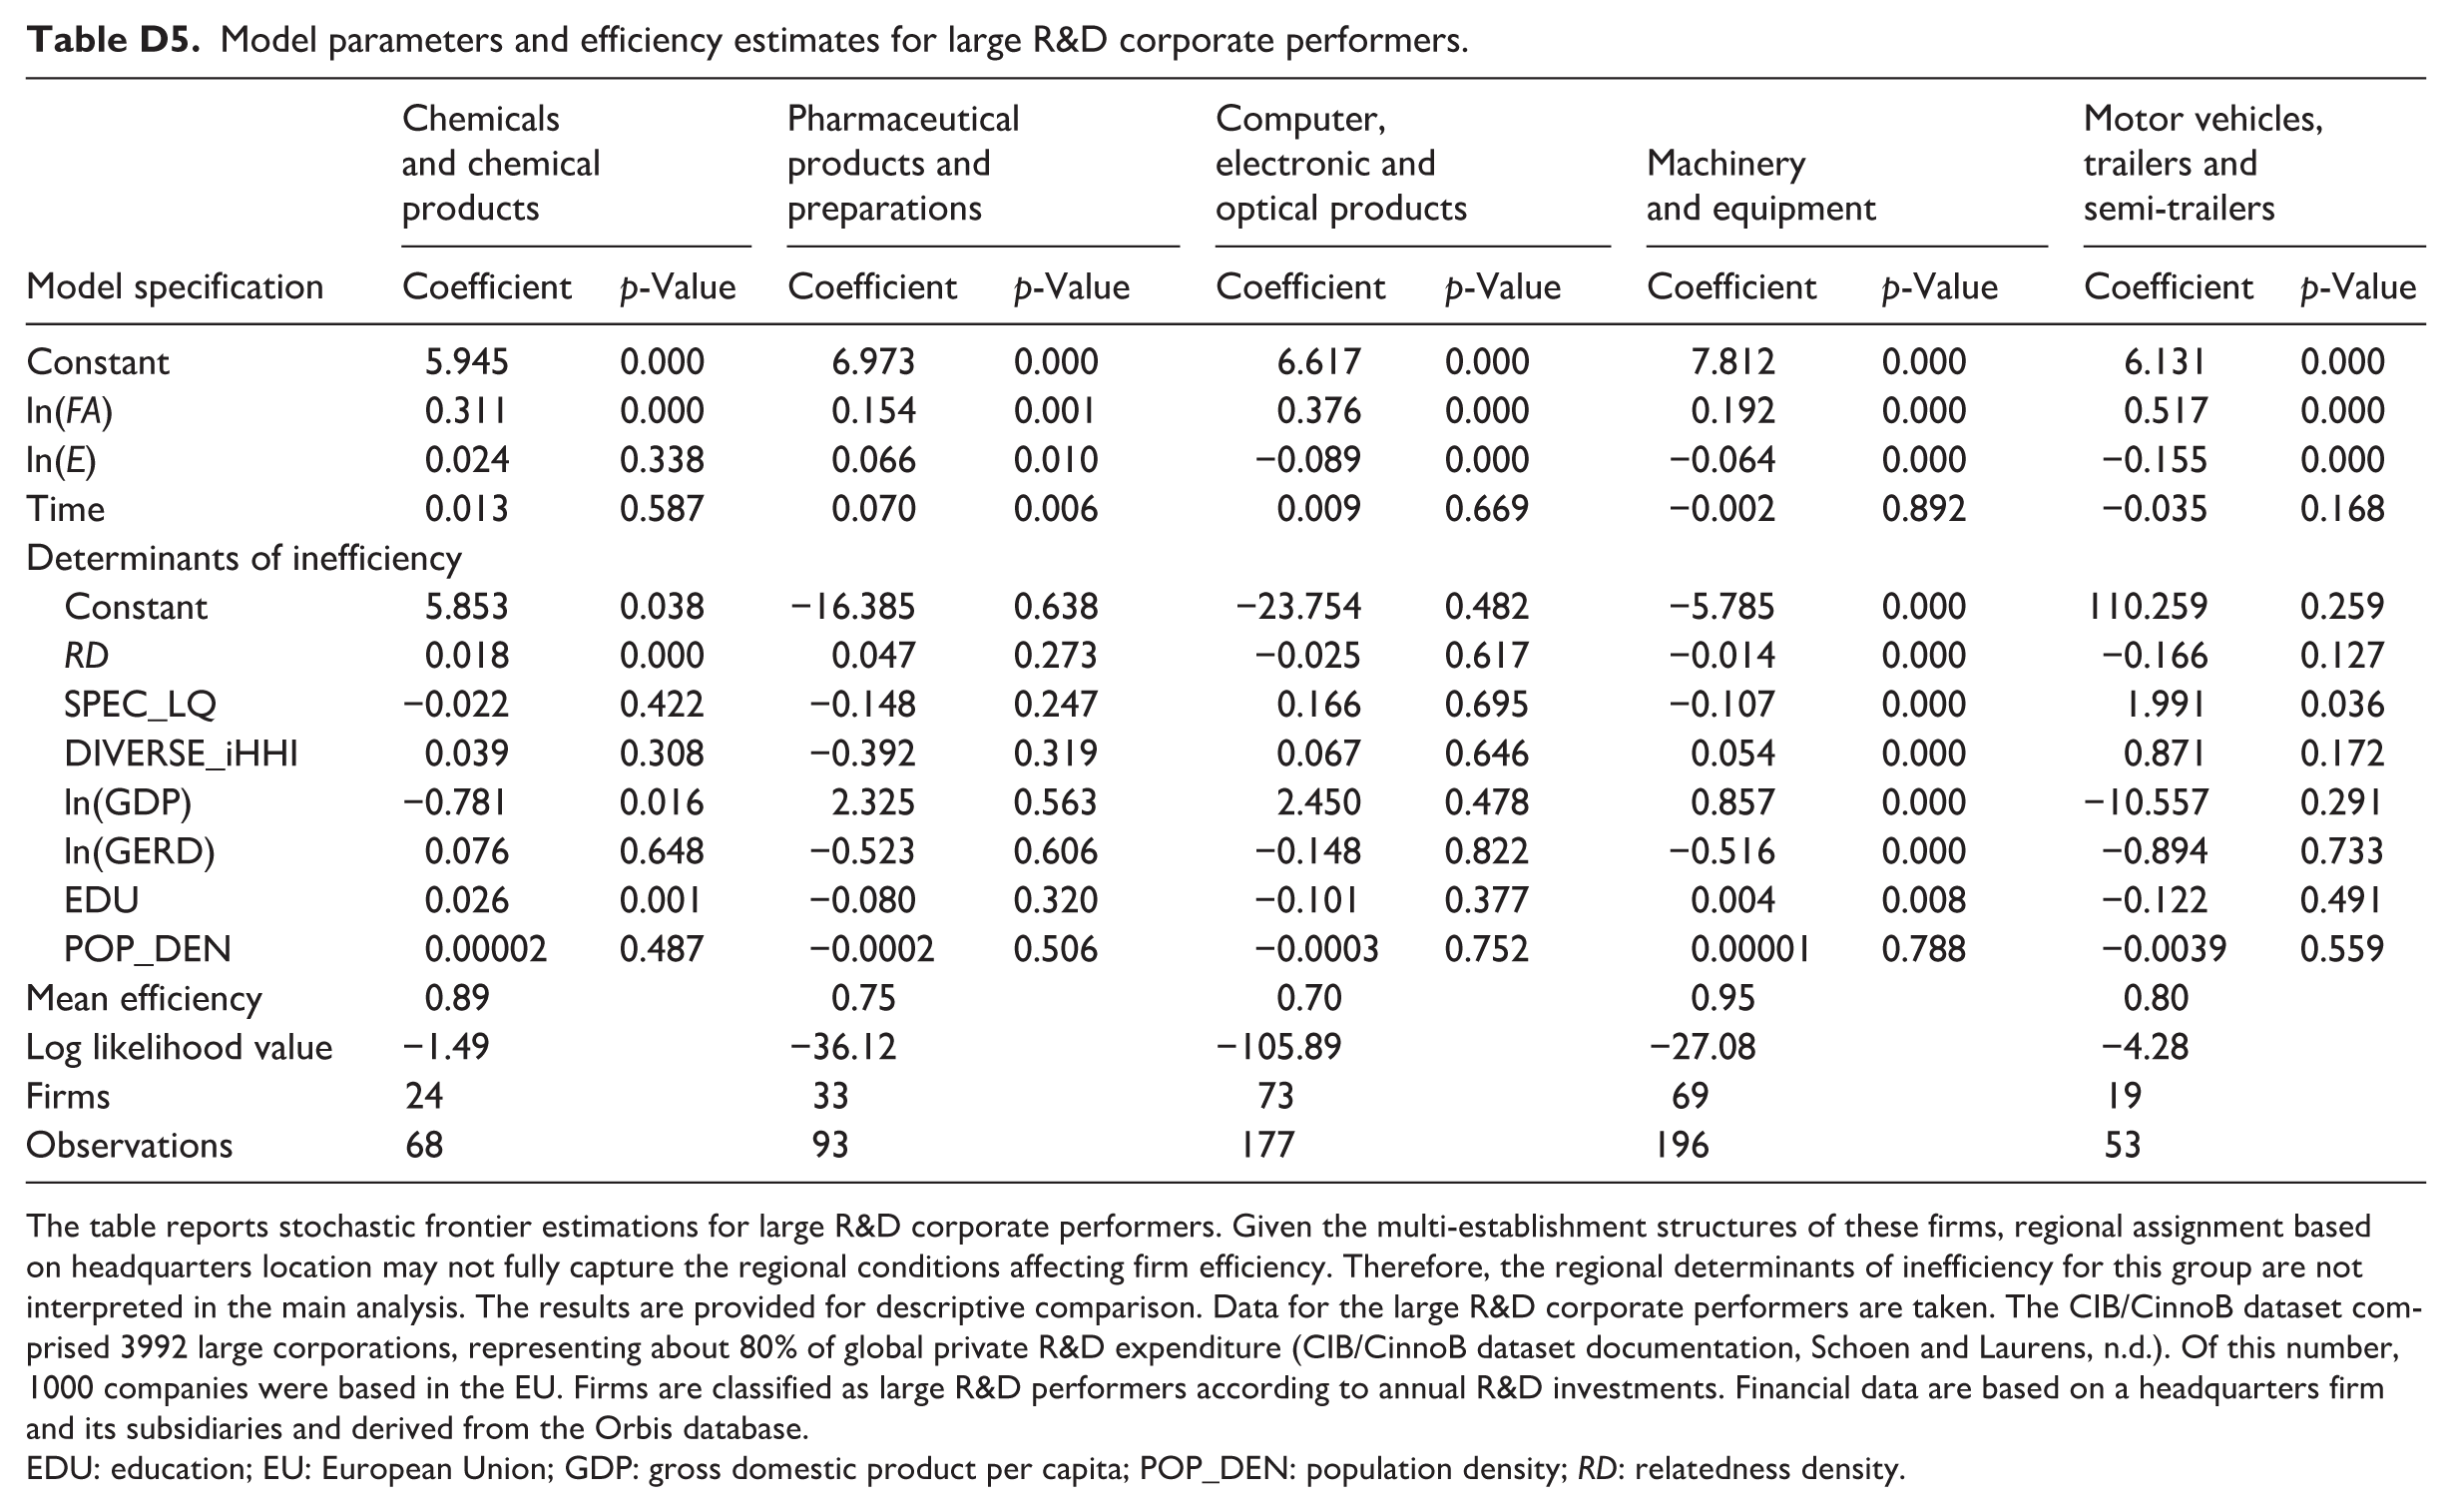
| Model specification | Chemicals and chemical products | Pharmaceutical products and preparations | Computer, electronic and optical products | Machinery and equipment | Motor vehicles, trailers and semi-trailers | |||||
|---|---|---|---|---|---|---|---|---|---|---|
| Coefficient | p-Value | Coefficient | p-Value | Coefficient | p-Value | Coefficient | p-Value | Coefficient | p-Value | |
| Constant | 5.945 | 0.000 | 6.973 | 0.000 | 6.617 | 0.000 | 7.812 | 0.000 | 6.131 | 0.000 |
| ln(FA) | 0.311 | 0.000 | 0.154 | 0.001 | 0.376 | 0.000 | 0.192 | 0.000 | 0.517 | 0.000 |
| ln(E) | 0.024 | 0.338 | 0.066 | 0.010 | −0.089 | 0.000 | −0.064 | 0.000 | −0.155 | 0.000 |
| Time | 0.013 | 0.587 | 0.070 | 0.006 | 0.009 | 0.669 | −0.002 | 0.892 | −0.035 | 0.168 |
| Determinants of inefficiency | ||||||||||
| Constant | 5.853 | 0.038 | −16.385 | 0.638 | −23.754 | 0.482 | −5.785 | 0.000 | 110.259 | 0.259 |
| RD | 0.018 | 0.000 | 0.047 | 0.273 | −0.025 | 0.617 | −0.014 | 0.000 | −0.166 | 0.127 |
| SPEC_LQ | −0.022 | 0.422 | −0.148 | 0.247 | 0.166 | 0.695 | −0.107 | 0.000 | 1.991 | 0.036 |
| DIVERSE_iHHI | 0.039 | 0.308 | −0.392 | 0.319 | 0.067 | 0.646 | 0.054 | 0.000 | 0.871 | 0.172 |
| ln(GDP) | −0.781 | 0.016 | 2.325 | 0.563 | 2.450 | 0.478 | 0.857 | 0.000 | −10.557 | 0.291 |
| ln(GERD) | 0.076 | 0.648 | −0.523 | 0.606 | −0.148 | 0.822 | −0.516 | 0.000 | −0.894 | 0.733 |
| EDU | 0.026 | 0.001 | −0.080 | 0.320 | −0.101 | 0.377 | 0.004 | 0.008 | −0.122 | 0.491 |
| POP_DEN | 0.00002 | 0.487 | −0.0002 | 0.506 | −0.0003 | 0.752 | 0.00001 | 0.788 | −0.0039 | 0.559 |
| Mean efficiency | 0.89 | 0.75 | 0.70 | 0.95 | 0.80 | |||||
| Log likelihood value | −1.49 | −36.12 | −105.89 | −27.08 | −4.28 | |||||
| Firms | 24 | 33 | 73 | 69 | 19 | |||||
| Observations | 68 | 93 | 177 | 196 | 53 | |||||
The table reports stochastic frontier estimations for large R&D corporate performers. Given the multi-establishment structures of these firms, regional assignment based on headquarters location may not fully capture the regional conditions affecting firm efficiency. Therefore, the regional determinants of inefficiency for this group are not interpreted in the main analysis. The results are provided for descriptive comparison. Data for the large R&D corporate performers are taken. The CIB/CinnoB dataset comprised 3992 large corporations, representing about 80% of global private R&D expenditure (CIB/CinnoB dataset documentation, Schoen and Laurens, n.d.). Of this number, 1000 companies were based in the EU. Firms are classified as large R&D performers according to annual R&D investments. Financial data are based on a headquarters firm and its subsidiaries and derived from the Orbis database.
EDU: education; EU: European Union; GDP: gross domestic product per capita; POP_DEN: population density; RD: relatedness density.
Acknowledgements
The data for this work was from the database of RISIS2 (Research Infrastructure for Innovation Policy Studies 2). RISIS2 was funded by the European Union’s Horizon 2020 Research and Innovation Programme under the grant number 824091. The authors are thankful to the managers of the RISIS2 datasets for providing data.
Funding
The authors disclosed receipt of the following financial support for the research, authorship, and/or publication of this article: This research project has received funding from European Social Fund project No 09.3.3-LMT-K-712-19-0090 under a grant agreement with the Research Council of Lithuania (LMTLT).
Declaration of conflicting interests
The authors declared no potential conflicts of interest with respect to the research, authorship, and/or publication of this article.