






Abstract
Objective
The study aimed to identify the most accurate protocol for measuring stride-count in post-stroke and healthy individuals, by comparing different wearable-sensors, their placement and data processing against a gold-standard instrumented treadmill.
Methods
Eighteen post-stroke and 18 healthy adults walked at multiple speeds on an instrumented treadmill equipped with force plates. Participants wore six ActiGraph accelerometers (wrists, hips, ankles), and pressure insoles. Stride counts from each sensor configuration were estimated using a custom raw-acceleration peak-detection algorithm and the manufacturer's algorithm (ActiLife®). Accuracy and agreement with the gold standard were assessed across walking speeds and sensor locations using the concordance correlation coefficient (CCC) and linear mixed-effects model.
Results
Stride count accuracy was influenced by walking speed across all wearable configurations, improving with gait velocity. Pressure-sensing insoles demonstrated the highest accuracy and agreement with the gold standard in both groups across speeds (CCC = 0.999 for healthy subjects; 0.996 for post-stroke). The custom peak-detection algorithm applied to ankle-worn accelerometers provided accurate and robust stride estimates across speeds (CCC = 0.986 in healthy subjects; 0.990 post-stroke). In contrast, the manufacturer's algorithm consistently misestimated stride counts in both groups. No side-to-side differences were observed for any sensor placement.
Conclusion
Pressure insoles and our custom raw-acceleration algorithm applied to ankle-worn accelerometers yielded the highest stride-count accuracy across walking speeds in both populations.
Trial registry name and URL
ClinicalTrails.gov (Registration ID: NCT06943014)
Introduction
Physical inactivity and sedentarity represent a major global public health concern (Bueno-Antequera & Munguía-Izquierdo, 2023). Physical activity refers to any muscle-driven movement resulting in energy expenditure above 1.5 metabolic equivalents. Sedentary behavior is defined as any waking activity with low energy expenditure (≤1.5 metabolic equivalents), such as sitting or lying down (Peters et al., 2021). In 2022, the World Health Organization (WHO) reported that approximately one third of the global population did not meet physical activity recommendations, defined as 150–300 min of moderate-intensity or 75 min of vigorous-intensity physical activity per week (Strain et al., 2024). These guidelines apply to both healthy individuals and those with chronic conditions. However, individuals with chronic diseases are approximately twice as likely to be physically inactive compared with healthy populations (Johnson, 2020). This disparity is particularly pronounced in conditions associated with motor impairments, such as post-stroke populations, among whom nearly 50% of individuals are physically inactive, and therefore do not meet the WHO recommendations (Johnson, 2020). Following a stroke, patients often experience motor and cognitive impairments that limit their functional capacities. As a result, during rehabilitation and after returning home, post-stroke individuals engage in low physical activity and spend over 90% of their waking hours in sedentary behavior. High levels of sedentary behavior and insufficient physical activity in post-stroke individuals are particularly concerning. Indeed, physical activity plays a critical role in health, secondary stroke prevention, and the maintenance of regained functional capacities in people with disabilities (Govori et al., 2024; WHO, 2020).
Physical activity can be quantified using three main approaches (Fini et al., 2023). First, observational methods such as behavioral mapping allow the direct assessment of activity type and duration in real-life settings. However, this approach requires substantial time and human resources, thereby limiting its feasibility. Second, self-reported questionnaires are the most widely used method in both clinical and epidemiological research. Nevertheless, they present well-documented limitations, as individuals tend to overestimate their physical activity levels when compared with objective assessments (Hagströmer et al., 2007). Third, actimetry provides an objective way of quantifying physical activity through wearable devices such as accelerometers or instrumented insoles. Among the various metrics they capture, daily step count has emerged as an intuitive and clinically relevant indicator (Fini et al., 2017). Indeed, walking represents the most frequent and accessible form of physical activity in both healthy and post-stroke populations (Feigin et al., 2021). It is a primary rehabilitation goal after stroke, as it is essential for restoring autonomy and improving quality of life. Evidence indicates that maintaining approximately 6000 steps per day is associated with a markedly lower risk of recurrent vascular events in individuals with mild ischemic stroke (Kono et al., 2015). Therefore, accurate and reliable monitoring of daily step count is considered a key metric for assessing overall physical activity in neurorehabilitation.
Among the various methods of actimetry used to quantify physical activity and step count, accelerometer-based measurement is one of the most widely used. These sensors measure the acceleration of the body segments to which they are attached (Migueles et al., 2017). From these acceleration signals, metrics are derived such as activity counts, movement intensity, or step detection, which are then used to quantify physical activity and step count. Accelerometer-based protocols have been validated in healthy adults. Consequently, several studies have applied these protocols to assess physical activity and step counts in post-stroke populations (Barrett et al., 2018; English et al., 2016; Faria et al., 2019; Mattlage et al., 2015; Tanaka et al., 2023). However, methodologies that are validated and reliable in healthy populations cannot be directly extrapolated to individuals with lower-limb motor impairments, whose walking performance may involve slower, asymmetric and low-amplitude movements (Campos et al., 2018). Accelerometers tend to underestimate step counts among slow walkers (<0.8 m/s) and those with stance time asymmetry, which directly impacts their validity in this population (Campos et al., 2018; Storti et al., 2008). To overcome these limitations, other studies have proposed configurations specifically adapted to post-stroke individuals (Falck et al., 2019; Fonte et al., 2022; Moulaee Conradsson & Bezuidenhout, 2022; Serra et al., 2017). However, these approaches differ substantially in terms of number of sensors, placement (e.g., wrist, hip, or ankle; paretic or non-paretic limb), device brand, data acquisition and processing parameters. This current methodological heterogeneity has led to the absence of a standardized and validated accelerometer-based protocol to quantify physical activity and step count for post-stroke individuals.
Instrumented insoles represent another actimetry method and an interesting alternative for quantifying step counts in the post-stroke population. By measuring plantar pressure distribution, these devices allow the estimation of step count as well as gait parameters such as gait cycle duration, swing and stance durations, and foot-ground interaction events including heel strike and toe-off (Ngueleu et al., 2019; Prasanth et al., 2021). High accuracy for step counting has been demonstrated in healthy adults, whereas one recent study in chronic stroke individuals reported high reliability for detecting gait events and stance duration (Neumann et al., 2024; Ngueleu et al., 2019).
Consistent with previous work reporting step count as an indicator of physical activity, this study aims to develop and validate an actimetry protocol for quantifying walking activity after stroke. For methodological purposes, walking activity is expressed as stride count, defined as the interval between two consecutive heel strikes of the same foot (Wall et al., 1987), equivalent to two steps. Particular attention is given to identifying the optimal wearable sensor configuration through comparison of accelerometers placed at several locations and pressure-sensing insoles within the same participants. Sensor outputs are validated against an instrumented treadmill equipped with force plates used as the gold standard. To our knowledge, this is the first study to systematically evaluate multiple wearable sensor configurations for the measurement of step counts under controlled conditions in both healthy adults and post-stroke individuals presenting motor impairments.
We hypothesized that the systematic comparison of multiple wearable sensor configurations against a gold standard would enable the identification of the most accurate and robust method for stride count quantification across a range of walking speeds.
Methods
Participants
For healthy participants, inclusion criteria were: adults over 18 years with no history of neurological or musculoskeletal disorders that could limit functional mobility. Participants with any acute or chronic conditions affecting walking, balance, or overall mobility were excluded.
For post-stroke participants, inclusion criteria were: adults over 18 years, who had experienced a stroke confirmed by MRI at least 15 days prior to enrollment, and who were medically stable. They presented with hemiparesis affecting ambulation and had a Functional Ambulation Categories (FAC) score ranging from 1 to 5 (Holden et al., 1984). Participants were excluded if they had significant communication disorders or any additional neurological or musculoskeletal condition limiting their functional mobility.
Post-stroke participants were recruited at our academic hospital, whereas healthy population were recruited through public notices.
Procedure
Participants attended a single laboratory session lasting approximately 2 h. Demographic and anthropometric data (age, height, and weight) were collected. For post-stroke participants, cognitive impairments were assessed using the Oxford Cognitive Screen (OCS) (Demeyere et al., 2015). Motor function of the upper and lower limbs was assessed using the Fugl–Meyer Assessment (FMA) (Fugl-Meyer et al., 1975). Balance was evaluated using the Mini Balance Evaluation Systems Test (Mini-BESTest) (Chinsongkram et al., 2014). Spontaneous walking speed was measured using the 10-Meter Walk Test (10MWT) (Kwakkel et al., 2017). This last test was also performed by healthy participants.
Walking trials were performed on an instrumented treadmill (Gaitway 3D, h/p/cosmos & Medical GmbH, Nußdorf, Germany) equipped with force plates (Arsalis Sprl, Genappe, Belgium), recording ground reaction forces at a frequency of 1000 Hz (Figure 1). A safety harness was used to ensure participant safety, and handrails were available for participants requiring assistance. Participants wore six accelerometers (ActiGraph wGT3X-BT, ActiGraph LLC, Florida, USA) (Figure 1(a)) on both wrists, hips, and ankles, recording accelerations at a sampling frequency of 90 Hz (Brønd & Arvidsson, 2016). They also wore pressure-sensing insoles (Stride One, Ceriter, Lanaken, Belgium) (Figure 1(b)) in both shoes, recording pressure data at 100 Hz. Finally, participants were also equipped with a heart rate monitor (H10, Polar Electro, Kempele, Finland) (Figure 1) and an ergospirometer (MetaMax3B, Cortex Biophysik GmbH, Leipzig, Germany) (Figure 1(c)). Healthy participants walked at 1, 3, and 5 km/h for two minutes per speed. For post-stroke participants, walking speeds were individually selected within a range of 0.5 to 5 km/h. Speed selection was based on clinical observation and tolerance to treadmill walking. One or several discrete speeds were tested, with the number and range of speeds adapted to each participant's walking capacity. Each speed was maintained for two minutes. Trials were stopped based on clinical and physiological criteria, including signs of physical exhaustion, pain or stress, Borg scale score >17, heart rate >90% of maximal heart rate or respiratory exchange ratio >1 (Valet et al., 2020). Each walking period at a given speed was time-stamped by the evaluator to allow signal segmentation and separate analysis of each walking period.
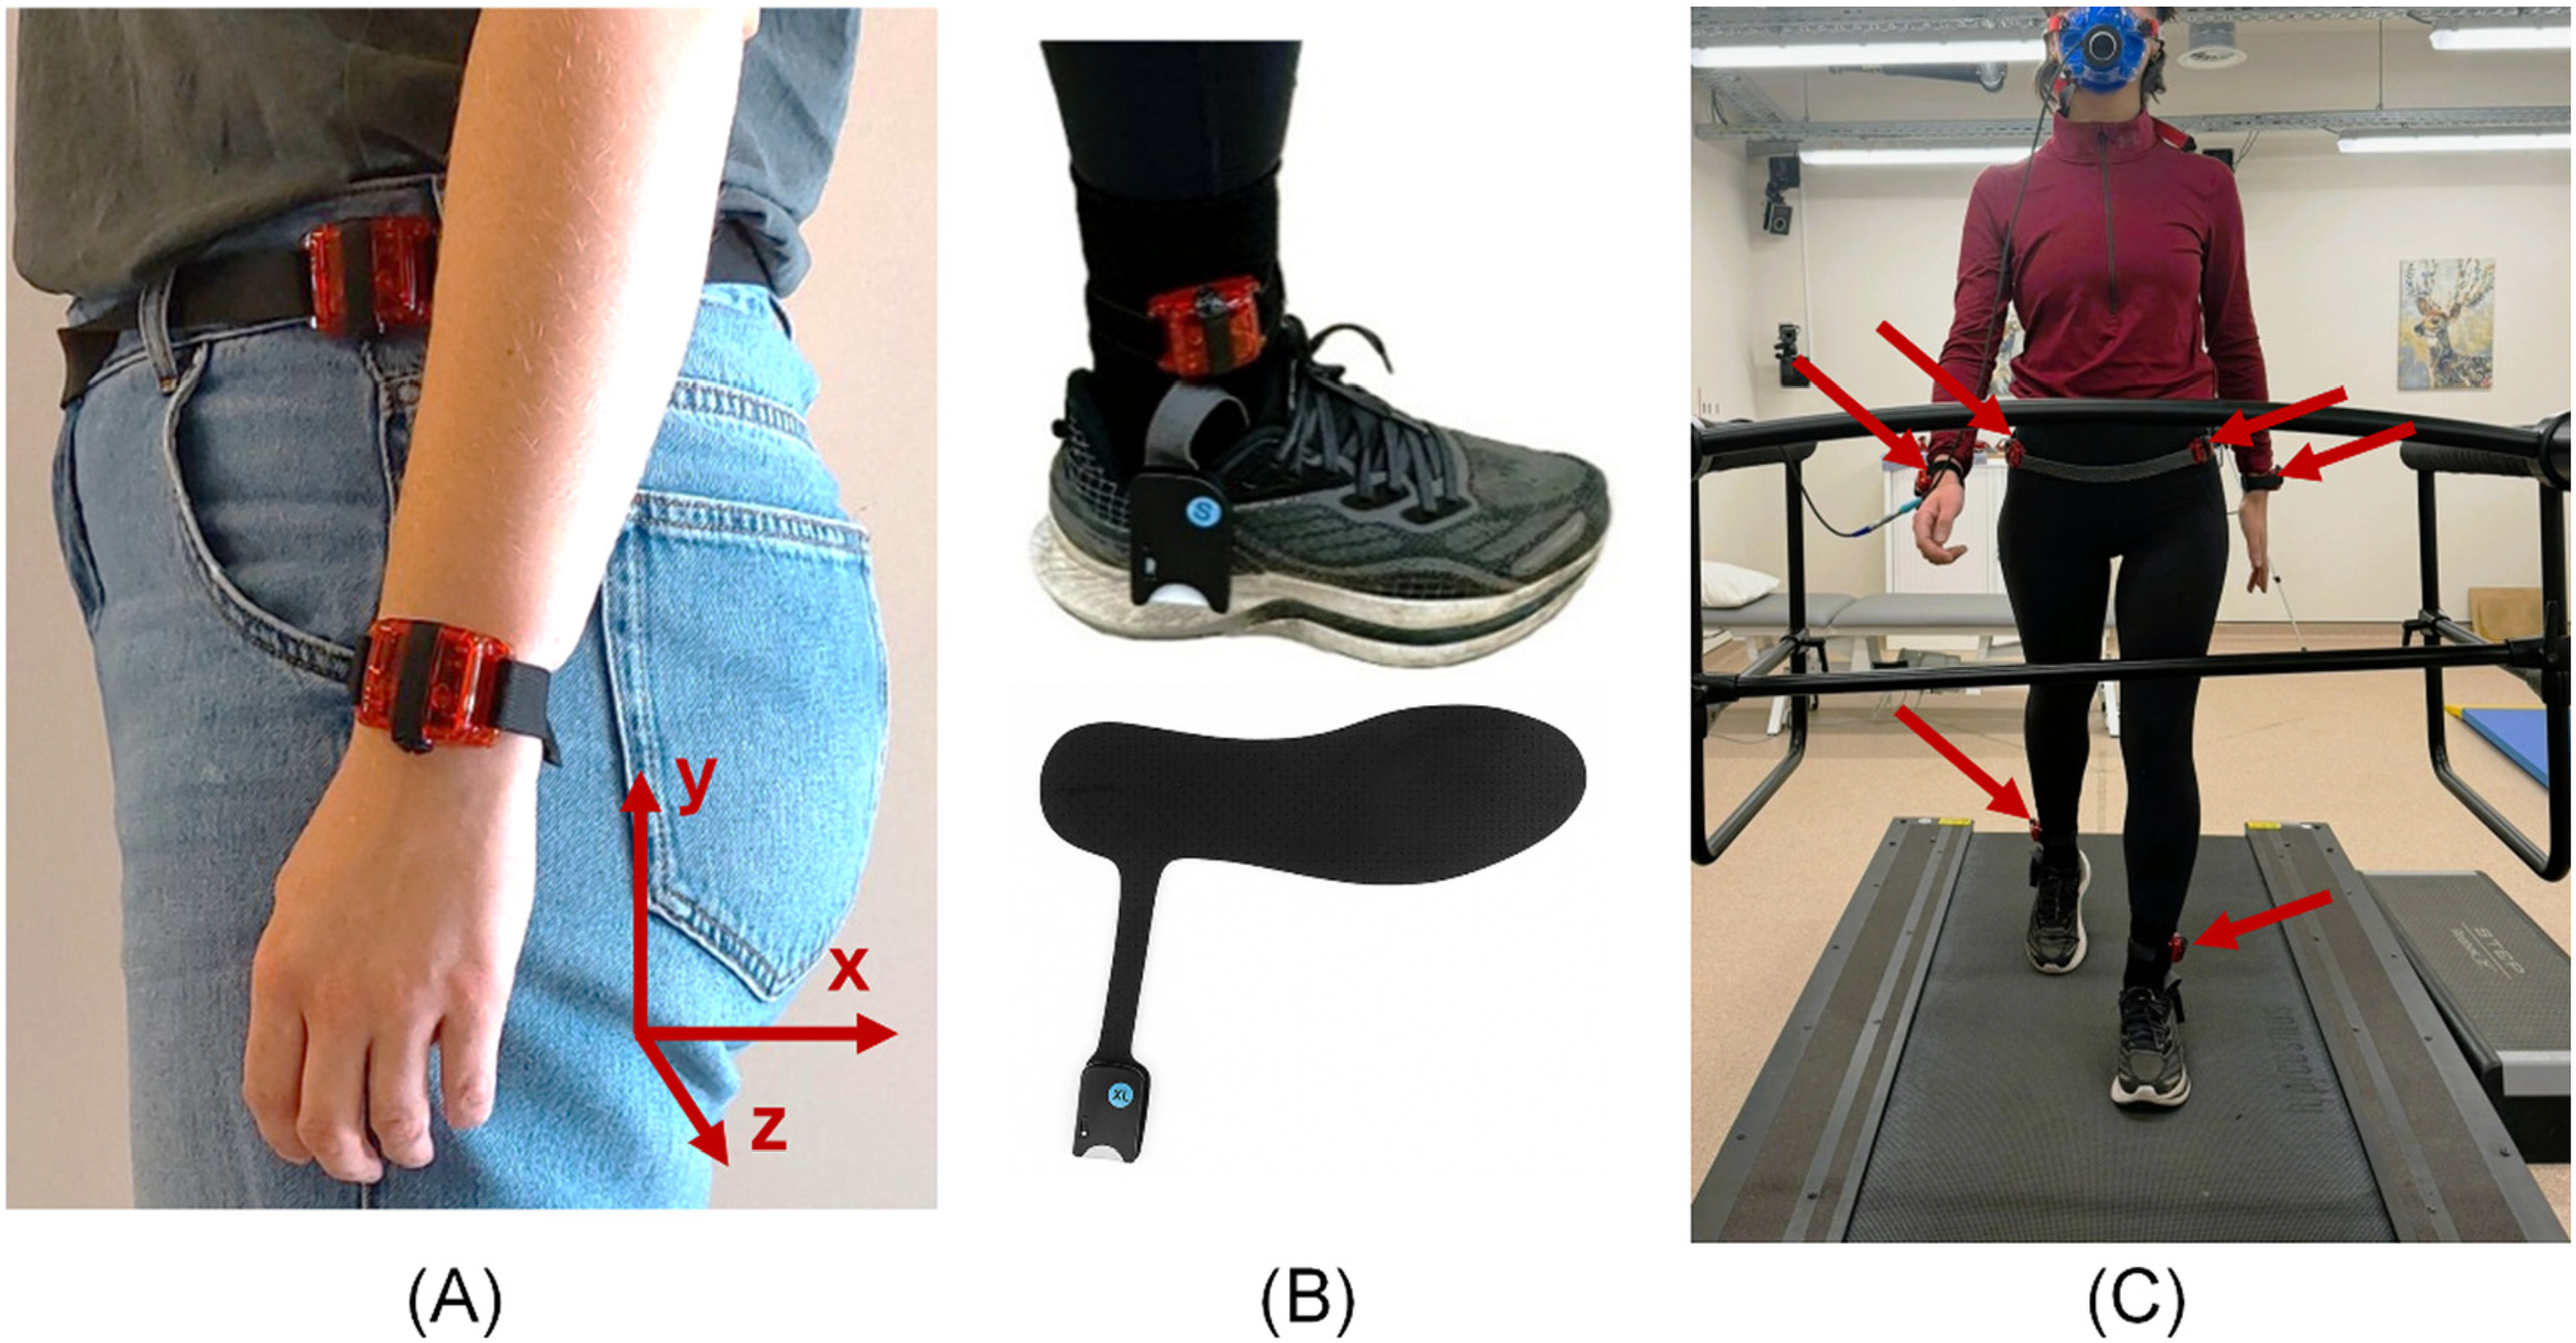
(a) Illustration of hip- and wrist-worn accelerometers (ActiGraphs wGT3X-BT, ActiGraph LLC, Florida, US); (b) illustration of a pressure insole (Stride One, Ceriter, Lanaken, Belgium); (c) illustration of the experimental setup showing a participant walking at different speeds on the instrumented treadmill, with arrows indicating the ActiGraph accelerometers.
Data Processing and Stride Count Estimation
In the present study, stride numbers were computed. A stride corresponds to the interval between two consecutive heel strikes of the same foot (Wall et al., 1987), and therefore consists of two steps.
The number of strides was calculated using four different approaches. It was first identified using the gold standard force-plate instrumented treadmill. Second, stride number was estimated from plantar pressure data collected using the pressure insoles. Third, it was derived using the proprietary ActiLife® algorithm provided with the ActiGraph devices. Fourth, raw acceleration data from the accelerometers were processed using a custom peak-detection algorithm.
Data processing was performed using Python (version 3.12). Based on the timestamps, signals from the insoles and accelerometers were segmented into sub-signals corresponding to each speed condition.
Gold Standard Algorithm
The reference stride count for each 2-min walking-speed trial was obtained directly from the treadmill software (Gaitway 3D version 2.0.11; Arsalis, Belgium). Ground reaction force signals were low-pass filtered using direction-specific cutoff frequencies (30 Hz for the vertical axis, 20 Hz for the anteroposterior axis, and 10 Hz for the mediolateral axis). Foot-contact events were automatically detected from these signals using force-based criteria.
Pressure Insole Algorithm
Step counts were also computed from the pressure-insole signals using a custom in-house algorithm. The insoles are equipped with eight pressure sensors, distributed across the toe (five sensors), midfoot (one sensor), and heel (two sensors) regions. First, defective sensors were visually identified and excluded. Next, mean pressure signals from the heel and toe regions were obtained by averaging signals from the sensors in these regions. The resulting signals were then thresholded to remove low-amplitude noise, setting all pressure values below 10 to zero (arbitrary units). Heel-strike events were detected as transitions from zero to non-zero pressure in the heel signal, whereas toe-off events were detected as transitions from non-zero to zero pressure in the toe signal. Finally, for each speed trial, the stride count was defined as the maximum between the number of detected heel-strikes and toe-offs, ensuring robustness in case of local signal degradation.
ActiLife® Algorithm
The number of steps was calculated using the ActiLife® proprietary algorithm (version 6.13.5; ActiGraph LLC, Florida, US) with a 15-s epoch (Moulaee Conradsson & Bezuidenhout, 2022), a predefined time interval in which raw acceleration data are aggregated. For each walking speed, the 15-s epochs corresponding to the activity timing were identified, and the number of steps calculated by ActiLife® within these epochs was summed and divided by two to obtain a stride count.
Raw-Acceleration Algorithm
The number of steps was also derived from the raw tri-axial acceleration signals using a custom in-house algorithm. For each speed trial, the vector magnitude of the acceleration recorded by each accelerometer was computed and smoothed using a Savitzky-Golay filter (window length = 11 samples, polynomial order = 2). Stride detection was then performed on this filtered signal using a standard peak-detection function. The peak detection for identifying local maxima relied on the minimum time between peaks, and prominence (set to 1 in both groups). For healthy participants, the minimum time between consecutive peaks was set to 0.89 s (80 samples at 90 Hz), whereas for post-stroke participants, whose gait cycles are typically longer due to slower movement, it was increased to 1.11 s (100 samples at 90 Hz). When visual inspection revealed missed peaks or spurious detections, indicating that the default parameters did not provide accurate peak detection, manual parameter tuning was applied to achieve correct identification of the peaks.
Statistical Analysis
Prior to data collection, the sample size was estimated based on a previous study investigating step count quantification using wearable sensors (Cederberg et al., 2021). Assuming a paired, within-subject agreement analysis between stride counts derived from wearable sensors and those obtained from the reference system, the required sample size for a Wilcoxon signed-rank test (two-tailed, α = 0.05, 1−β = 0.8,
Demographic and anthropometric characteristics were compared between group using the Mann–Whitney U test for continuous variables and Fisher's exact test for categorical variables. All other statistical analyses were performed separately for the healthy and post-stroke participants; no direct comparisons were made between these two groups.
For each trial, the outcome of interest was the relative error, defined as the percentage difference between the actimetry-based stride count and the gold standard value.
Linear Mixed-Effects Models
To investigate how the relative error in stride count varied across actimetry methods, sides, and walking speeds, additional analyses were performed using linear mixed-effects models (LMMs), implemented in R (version 4.5.1). Model assumptions were assessed for the LMM through visual inspection of residual Q–Q plots and residual-versus-fitted plots. Statistical significance was set at p < 0.05.
A first LMM was fitted in which the relative error was modeled as a function of several fixed effects: the actimetry method (pressure insole, and any of the seven accelerometer-based methods, combining sensor placement and stride-counting algorithm), the body side (paretic vs non-paretic for post-stroke participants; left vs right for healthy participants), and walking speed treated as a continuous variable. Because treadmill walking speeds varied between participants within the post-stroke group, walking speed was treated as a continuous predictor within the linear mixed-effects framework, allowing all available data to be retained without requiring speed-matched conditions across individuals. This approach enables comparisons to be performed across a continuous and clinically relevant range of walking speeds, rather than being restricted to speed-matched conditions. To account for repeated measurements within participants, a subject-specific random intercept was included. Significance of fixed effects was assessed using Type-III ANOVA with Kenward–Roger degrees of freedom. When neither the side effect nor its interaction with the actimetry method reached statistical significance, a simplified LMM was refitted without the side factor, keeping measurements from both sides in the dataset as separate observations.
To quantify the expected accuracy of each method, a predicted relative error was estimated at three representative walking speeds. For the post-stroke group, these speeds corresponded to the 25th, 50th and 75th percentile of the observed speed distribution. For the healthy group, the three experimentally tested speeds were used directly. At each of these speeds, pairwise comparisons against zero were performed to determine whether a method exhibited a statistically significant bias in its stride-count estimate, with multiplicity correction using the Benjamini-Hochberg procedure.
Finally, we examined how the accuracy of each method changed with walking speed by estimating, for each method, the slope of the relationship between relative error and speed, allowing to determine whether estimation error systematically increased or decreased as participants walked faster.
Agreement Analyses
Complementary analyses assessing agreement with the gold standard were performed in Python (version 3.13.5). Bland-Altman statistics were computed for each method, including the mean bias and the 95% limits of agreement (Bland & Altman, 1999).
Measurement agreement was also quantified using the Concordance Correlation Coefficient (CCC), which evaluates both precision and accuracy. The CCC and its 95% confidence interval were computed using a cluster bootstrap at the subject level to account for repeated measures across walking speeds (Lin, 1989). CCC values were interpreted as follows: <0.90 indicate poor agreement, 0.90–0.95 moderate agreement, 0.95–0.99 substantial agreement, and >0.99 almost perfect agreement (McBride, 2005).
Results
A total of 18 healthy participants and 18 post-stroke participants were recruited. The demographic characteristics of both groups are presented in Table 1.
Demographic, Anthropometric, Clinical, and Functional Characteristics of the Two Groups of Participants.
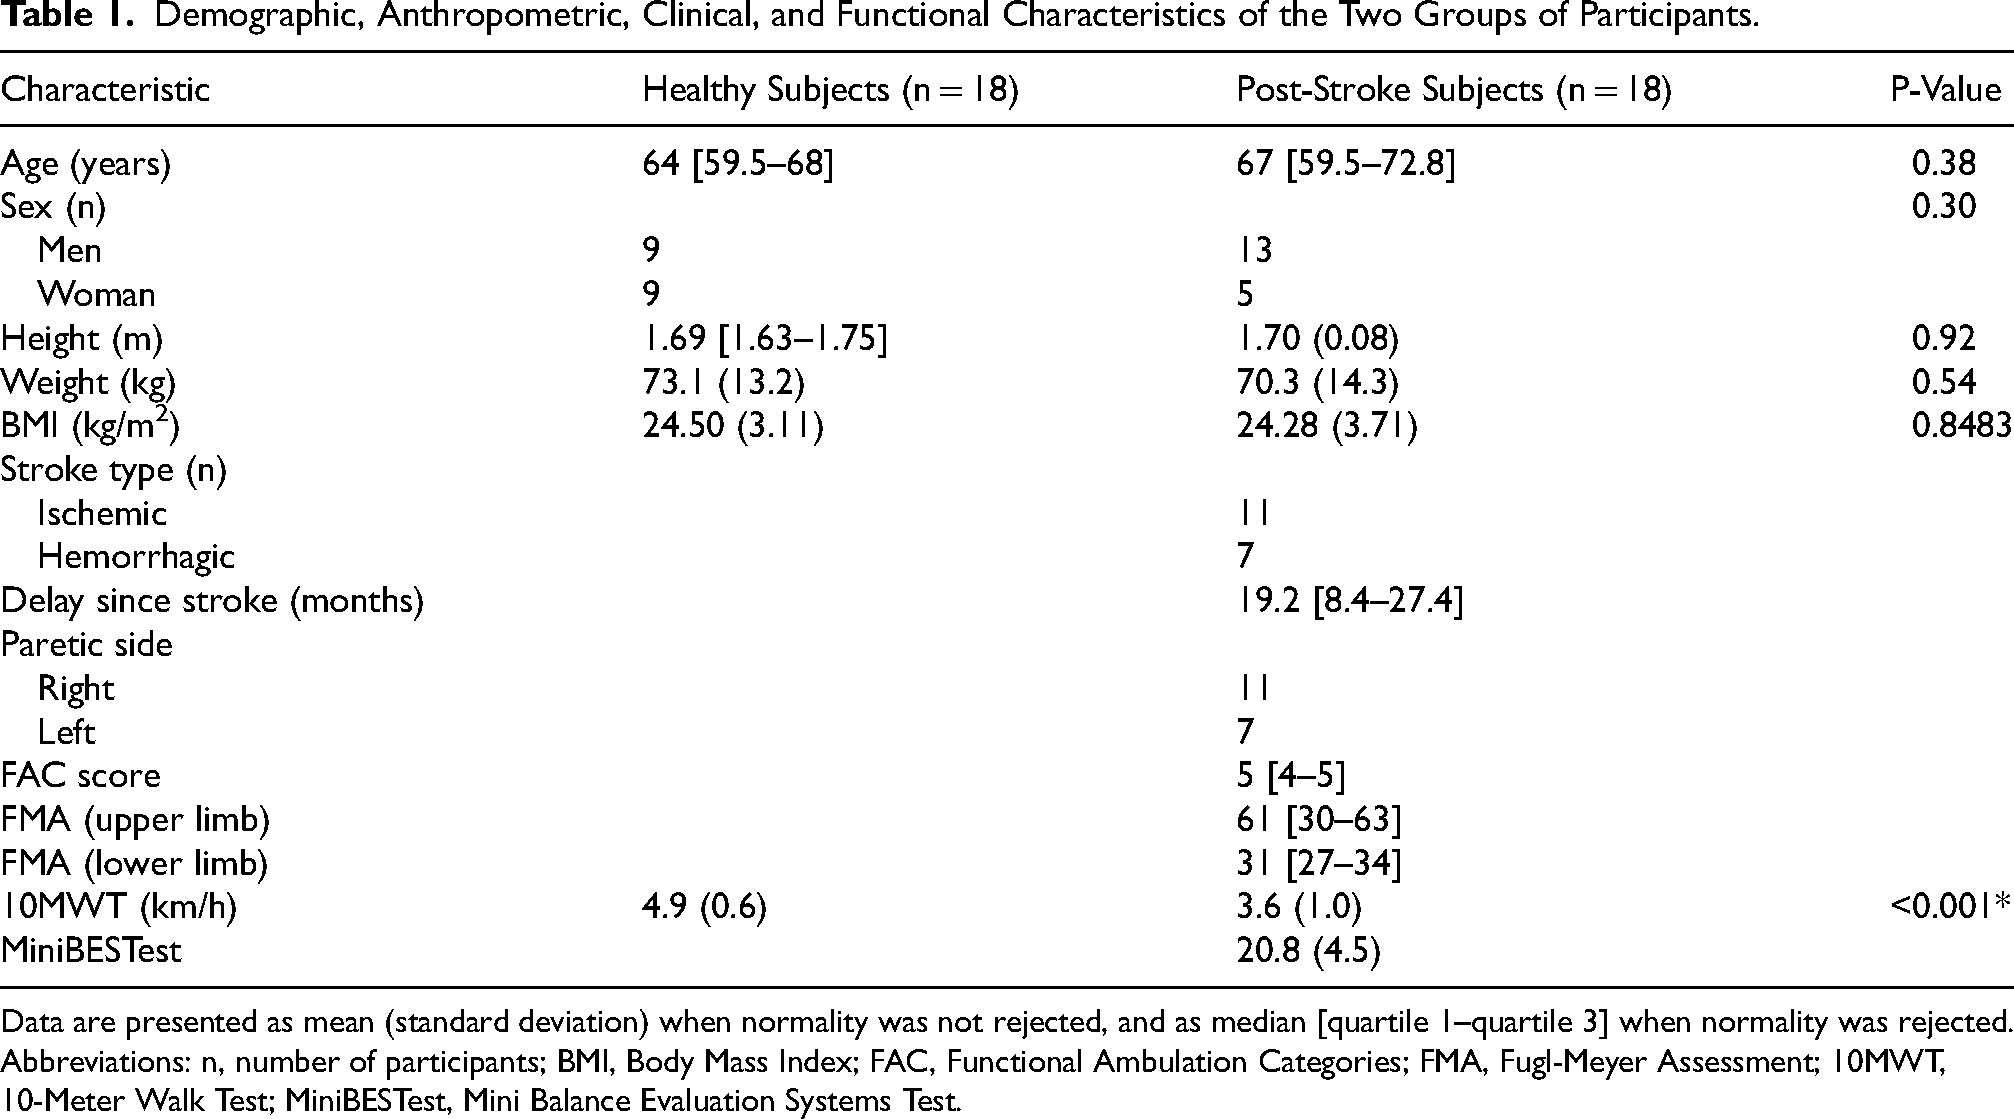
Data are presented as mean (standard deviation) when normality was not rejected, and as median [quartile 1–quartile 3] when normality was rejected.
Abbreviations: n, number of participants; BMI, Body Mass Index; FAC, Functional Ambulation Categories; FMA, Fugl-Meyer Assessment; 10MWT, 10-Meter Walk Test; MiniBESTest, Mini Balance Evaluation Systems Test.
Both groups were comparable in terms of demographic and anthropometric characteristics. According to the 10MWT, healthy participants walked significantly faster than individuals post stroke (p < 0.000; 4.9 and 3.6 km/h respectively).
As stride detection relied on a minimum time between consecutive peaks, its relationship with functional walking speed was examined. A Spearman correlation analysis between spontaneous gait velocity derived from the 10-Meter Walk Test and the time between detected peaks revealed a significant negative correlation (r = −0.68, p = 0.0019). This indicates that, within the peak-detection algorithm applied to raw-acceleration algorithm, higher gait speeds were associated with shorter inter-peak intervals, whereas slower speeds required longer minimum time parameters.
All healthy participants completed the predetermined treadmill speeds (1, 3 and 5 km/h). In the post-stroke group, treadmill speeds were more variable. The 25th, 50th and 75th percentiles were 1, 2 and 3 km/h, respectively. Overall, participants walked between one and eight speeds, ranging from 0.5 to 5 km/h.
Wrist-worn accelerometer data were excluded at specific walking speeds when handrails were used. In the post-stroke group, wrist data were available for 15 of 18 participants (83%). Usable wrist data covered 48% of the tested walking conditions, with most data originating from the paretic side (74%), as participants predominantly used their non-paretic upper limb when holding the handrails. In healthy participants, wrist data were retained for 92% of walking conditions, with a balanced left-right distribution.
Healthy Group
Bland-Altman plots are presented in Figure 2 for all seven actimetry-based methods. The comparison of relative errors across the seven actimetry methods, including measurements from both sides and all walking speeds, is presented in Figure 3. The pressure insoles showed the best agreement with reference, with a relative error bias of 1% and narrow limits of agreement (−2 to 4%). The raw-acceleration algorithm at the ankle also showed minimal bias (2%) and relatively narrow limits of agreement (−10 to 15%). The same algorithm at the hip and wrist showed slightly higher biases (6 and 9% respectively) and wider limits of agreement (−26 to 38% at the hip; −40 to 58% at the wrist). The ActiLife® algorithm at the ankle presented a small relative error bias (−5%) but a wide limits of agreement (−53 to 43%). At the hip and wrist, this algorithm showed large biases (−36 and −35% respectively) and a wide limit of agreement (−131 to 60% at the hip; −127 to 56% at the wrist).
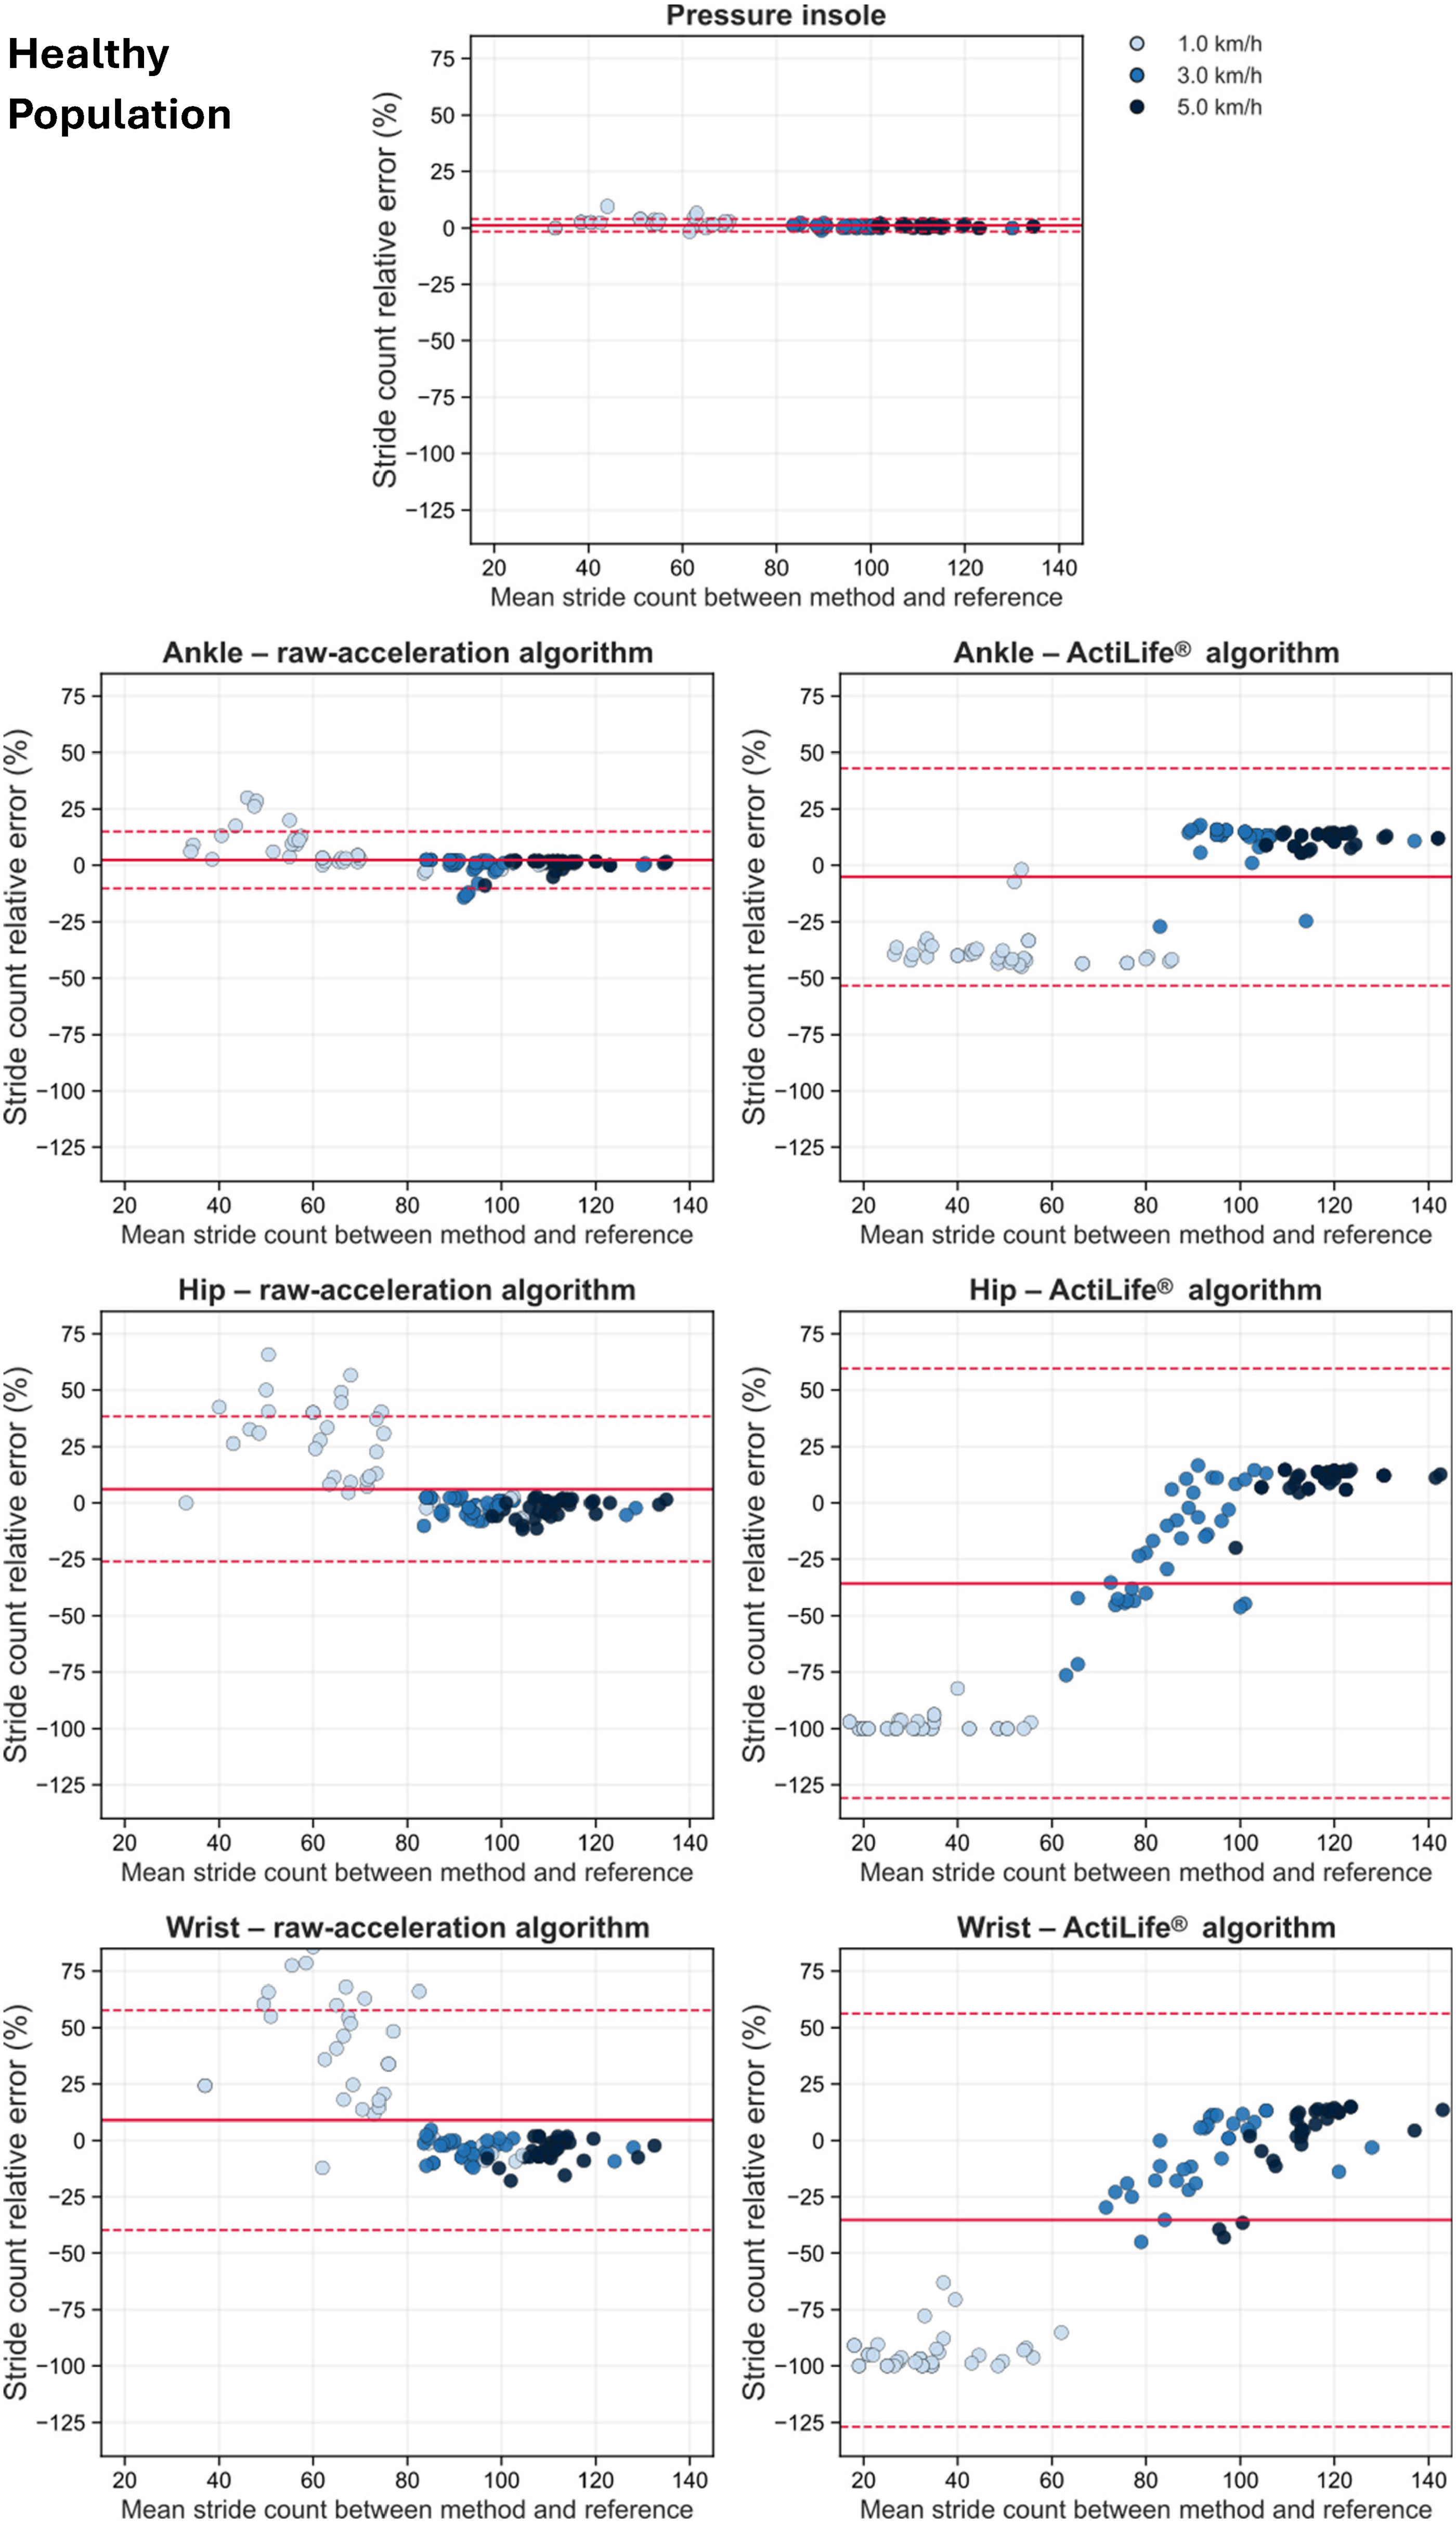
Bland-Altman plots for the seven actimetry-based stride-counting methods for the healthy population. Data include both left and right sides as well as all walking speeds. Each point represents one trial, with colors indicating walking speed. The y-axis shows the relative error between actimetry-based method and the gold standard, and the x-axis shows the mean of the two measurements. The solid red line shows the mean bias, i.e., average relative error between the actimetry-based method and the gold standard. The dashed red lines show the 95% limit of agreement, defined as the bias ± 1.96 standard deviation of the differences.
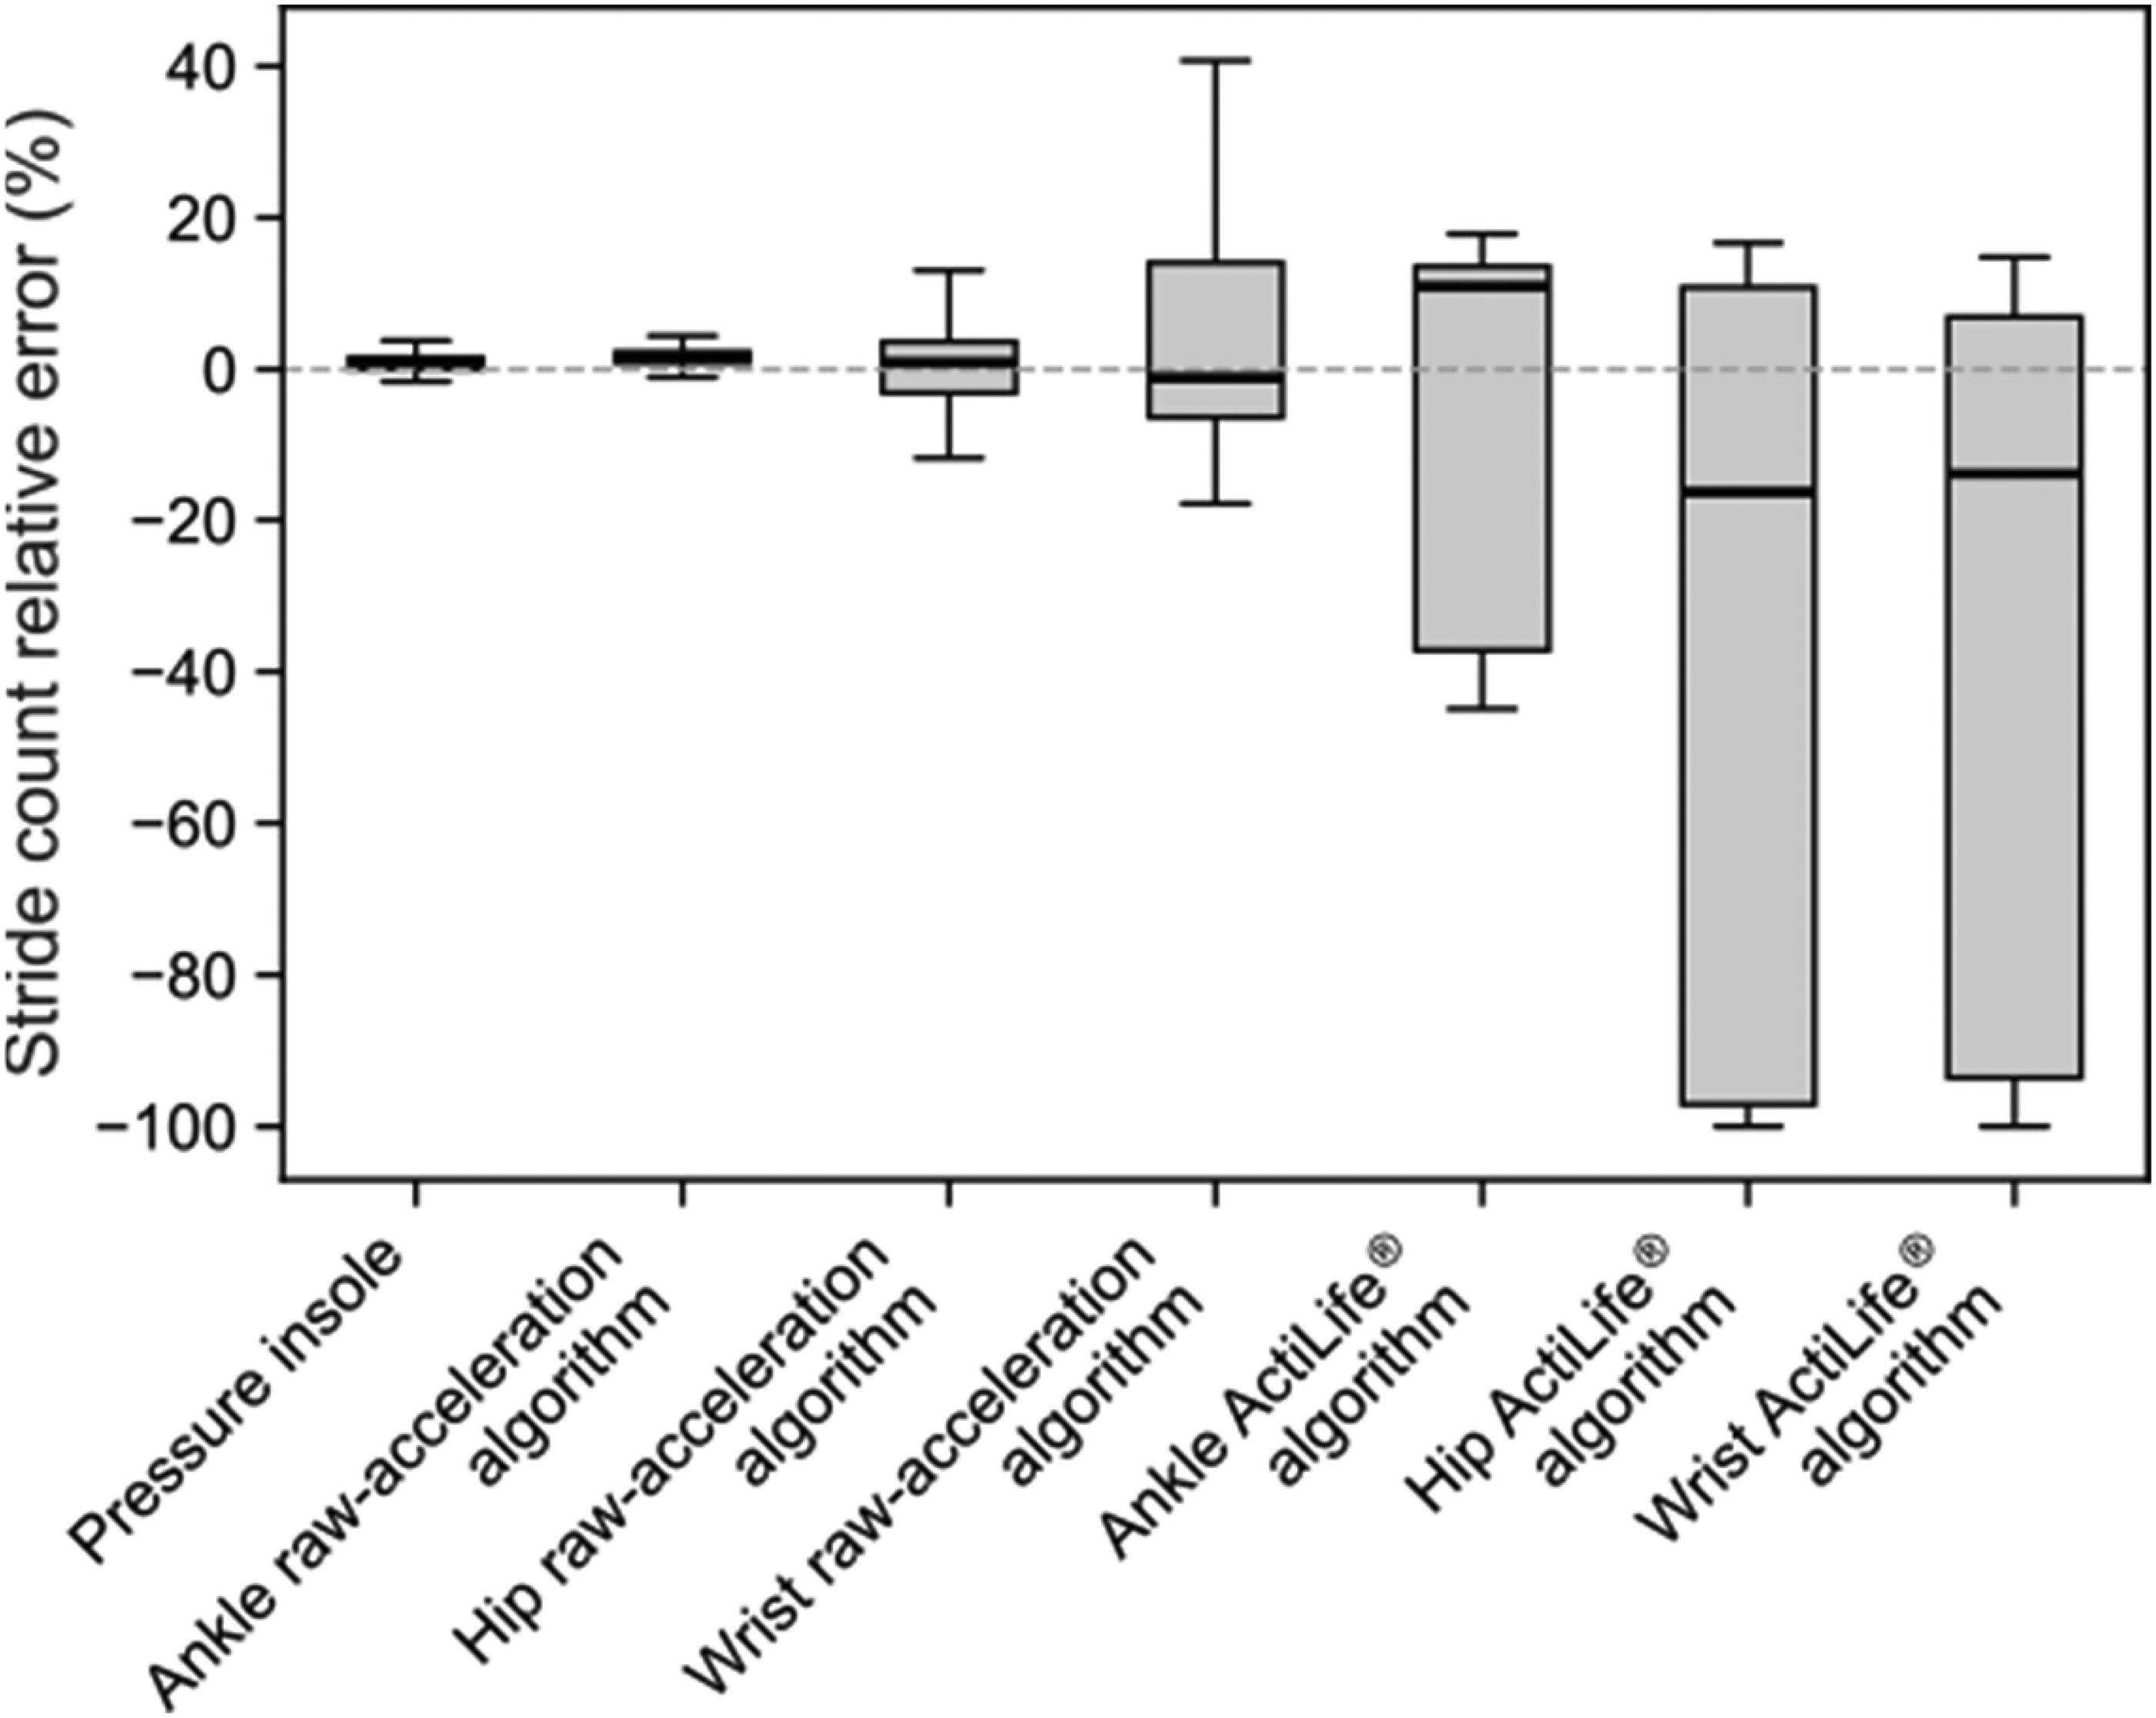
Boxplot of the relative error in stride count for the seven actimetry-based methods for the healthy population. Data include both left and right sides as well as all walking speeds. The central horizontal line within each box represents the median error, the boxes correspond to the interquartile range, and the whiskers extend to 1.5 times the interquartile range.
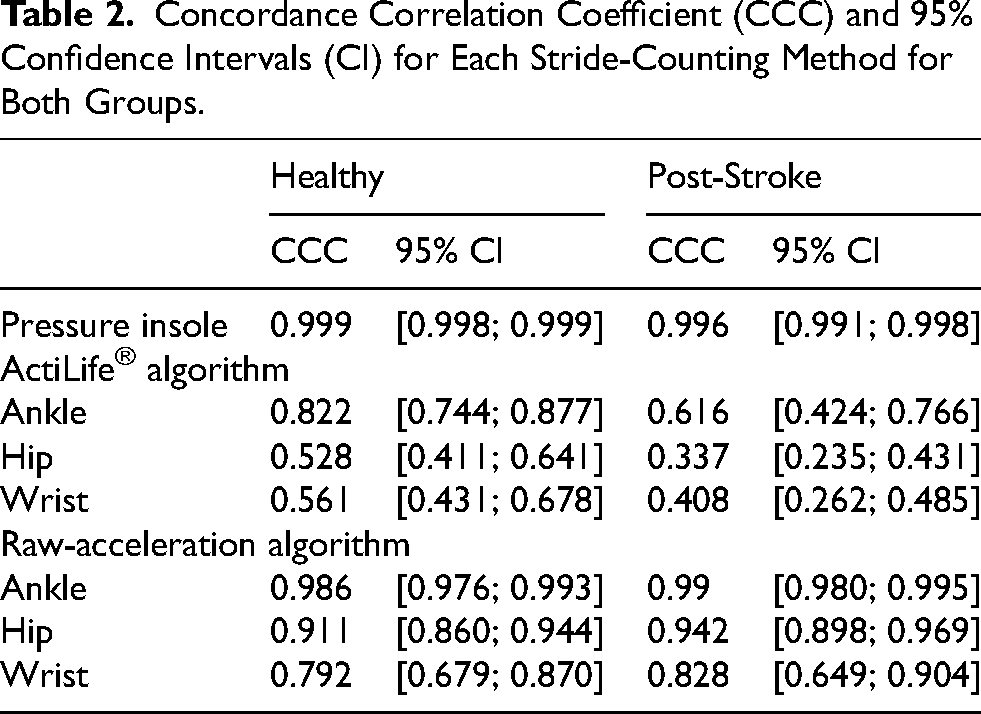
The concordance plots are shown in Figure 4 for all seven actimetry-based methods, and the CCC values are given in Table 2. The pressure insole showed the best correspondence with the gold standard, with almost perfect agreement (CCC = 0.999). Substantial agreement was observed for the raw-acceleration algorithm at the ankle (CCC = 0.986), while this algorithm at the hip showed moderate agreement (CCC = 0.911). Finally, poor agreement was found with the raw-acceleration algorithm at the wrist (CCC = 0.792), and for the ActiLife® algorithm at all three sensor locations (ankle: CCC = 0.822; hip: CCC = 0.528; wrist: CCC = 0.561).
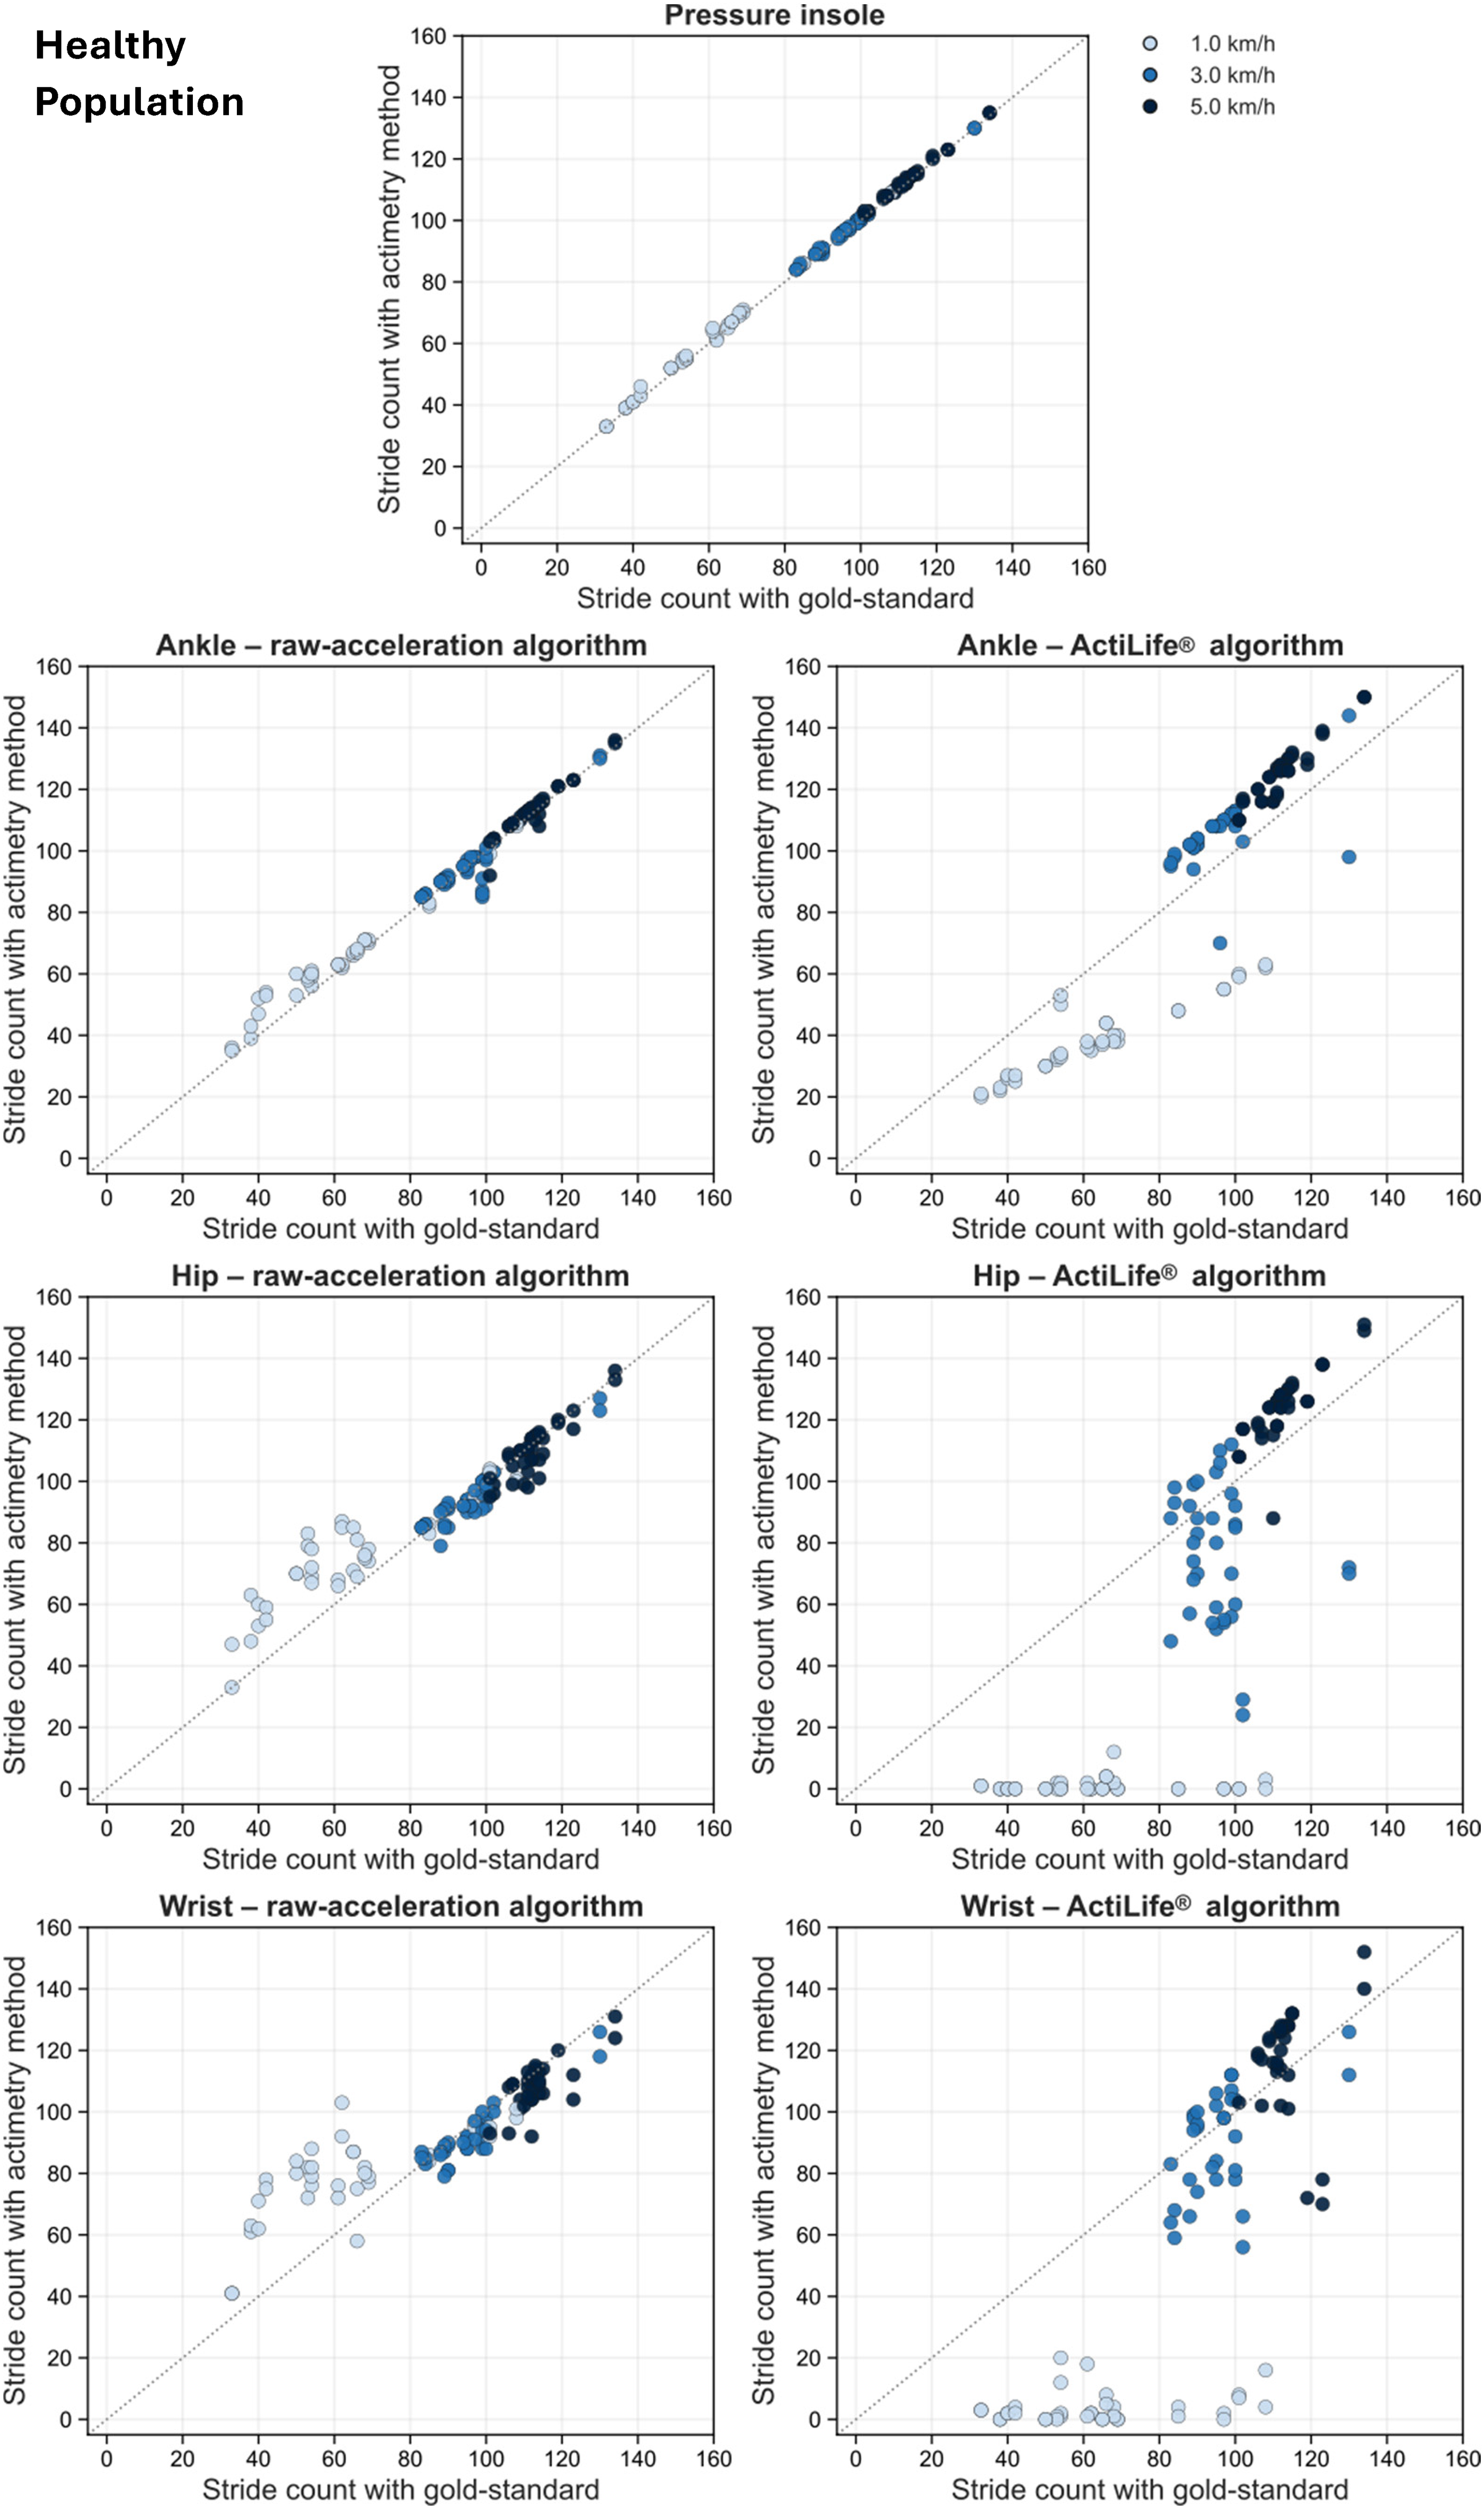
Concordance plots for the seven actimetry-based stride-counting methods for the healthy population. Data include both left and right sides as well as all walking speeds. Each plot shows the stride count measured by the actimetry-method against the gold standard. Each point represents one trial, with colors indicating walking speed. The dashed gray line represents the line of identity.
Concordance Correlation Coefficient (CCC) and 95% Confidence Intervals (CI) for Each Stride-Counting Method for Both Groups.
The first LMM analysis showed no significant effect of body side (p = 0.67) nor of method-by-side interaction (p = 0.96). Therefore, the side factor was removed from the model, and all subsequent analyses were performed using the simplified model excluding the side effect.
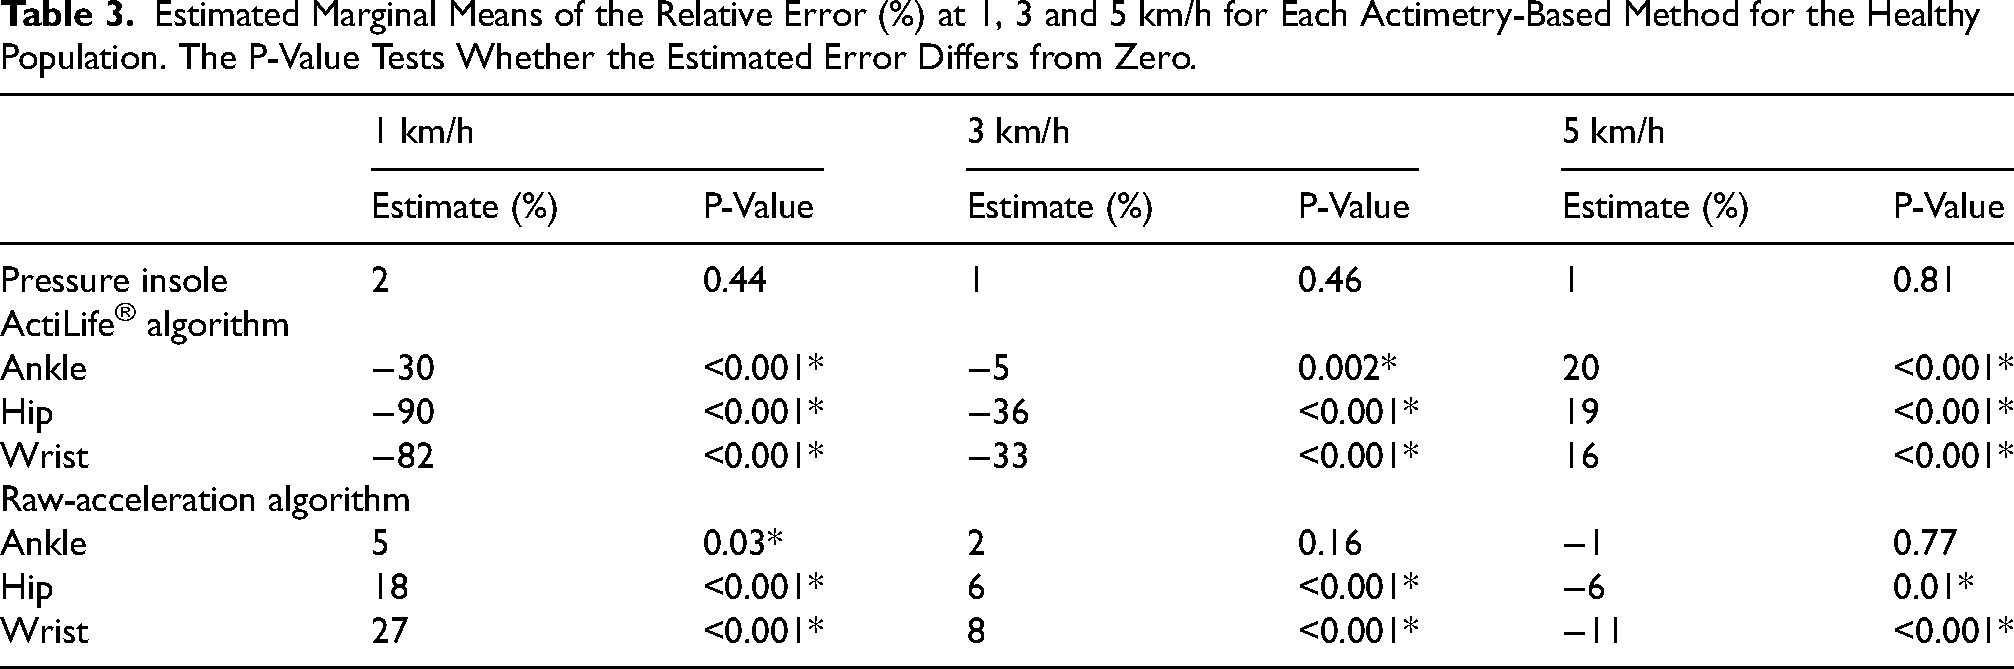
In this simplified model, the effect of actimetry method and walking speed, as well as their interaction, were statistically significant (all p < 0.001). Post-hoc comparisons of the estimated marginal means of the relative error at the three experimental treadmill walking speeds (1, 3 and 5 km/h) are reported in Table 3. The pressure insole showed no significant deviation from zero at any speed (all p ≥ 0.44). Across walking speeds, significant deviations from zero were consistently observed for the ActiLife® algorithm at all three sensor locations (all p < 0.001, except p = 0.002 for the ankle at 3 km/h). At 1 km/h, this algorithm produced large negative relative errors (−30%, −90%, −82% at the ankle, hip, and wrist), indicating marked underestimation. At 3 km/h, the pattern persisted, with moderate to large negative errors (−5%, −36%, −33%). At 5 km/h, the direction of these errors reversed, and the ActiLife® algorithm showed systematic overestimation (+20%, +19%, +16%). At 1 km/h, the raw-acceleration algorithm showed significant deviations from zero at the ankle (p = 0.03), hip (p < 0.001), and wrist (p < 0.001), with positive relative errors at all three locations (+5%, +18%, +27%). At 3 and 5 km/h, significant deviations remained at the hip and wrist (both p < 0.001 at 3 km/h; p = 0.01 and p < 0.001 at 5 km/h), whereas the ankle showed no significant deviation. This algorithm overestimated stride counts at 3 km/h (+6% and +8% at the hip and wrist), while it underestimated them at 5 km/h (−6% and −11% at the hip and wrist).
Estimated Marginal Means of the Relative Error (%) at 1, 3 and 5 km/h for Each Actimetry-Based Method for the Healthy Population. The P-Value Tests Whether the Estimated Error Differs from Zero.
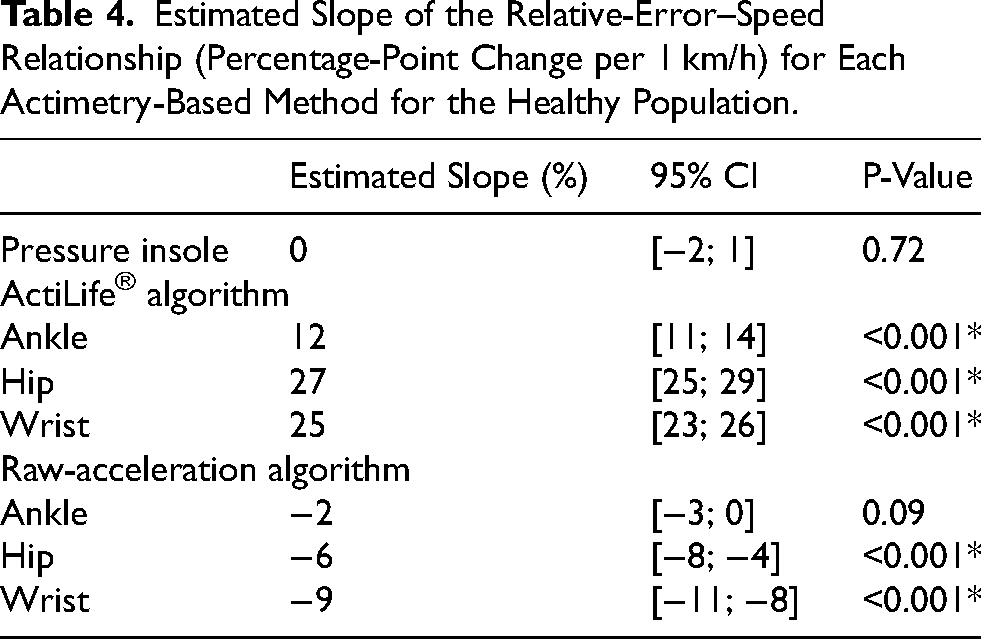
Analysis of the speed-error relationship is summarized in Table 4. Significant negative slopes were observed for the raw-acceleration algorithm at the hip and wrist (all p < 0.001), indicating a decrease in relative error of 6% and 9%, respectively, for each 1 km/h increase in walking speed. It means that hip and wrist raw-acceleration algorithms produce larger errors at slower speeds but improve at faster speeds. Moreover, ActiLife® algorithm at all three sensor locations exhibited significant positive slopes (all p < 0.001), with increases in relative error of 12%, 27%, and 25% per 1 km/h for the ankle, hip, and wrist placements, respectively. It means that ActiLife® algorithm performs better at slow speeds but deteriorates as speed increases, regardless of the sensor location.
Estimated Slope of the Relative-Error–Speed Relationship (Percentage-Point Change per 1 km/h) for Each Actimetry-Based Method for the Healthy Population.
Post-Stroke Group
Bland-Altman plots are presented in Figure 5 for all seven actimetry-based methods. The comparison of relative errors across the seven actimetry methods, including measurements from both sides and all walking speeds, is presented in Figure 6. The pressure insoles showed the best agreement with the reference, with a relative error bias of 2% and narrow limits of agreement (−3 to 7%). The raw-acceleration algorithm at the ankle also showed minimal bias (1%) and relatively narrow limits of agreement (−6 to 8%). At the hip, the same algorithm showed no systematic bias (0%) and moderately wide limits of agreement (−24 to 25%), whereas at the wrist it yielded a small negative bias (−1%) with wider limits of agreement (−40 to 38%). The ActiLife® algorithm at the ankle presented a marked relative error bias (−19%) and wide limits of agreement (−71 to 34%). At the hip and wrist, this algorithm produced large biases (−57% and −54% respectively), and wide limits of agreement (−133 to 19% at the hip; −129 to 21% at the wrist).
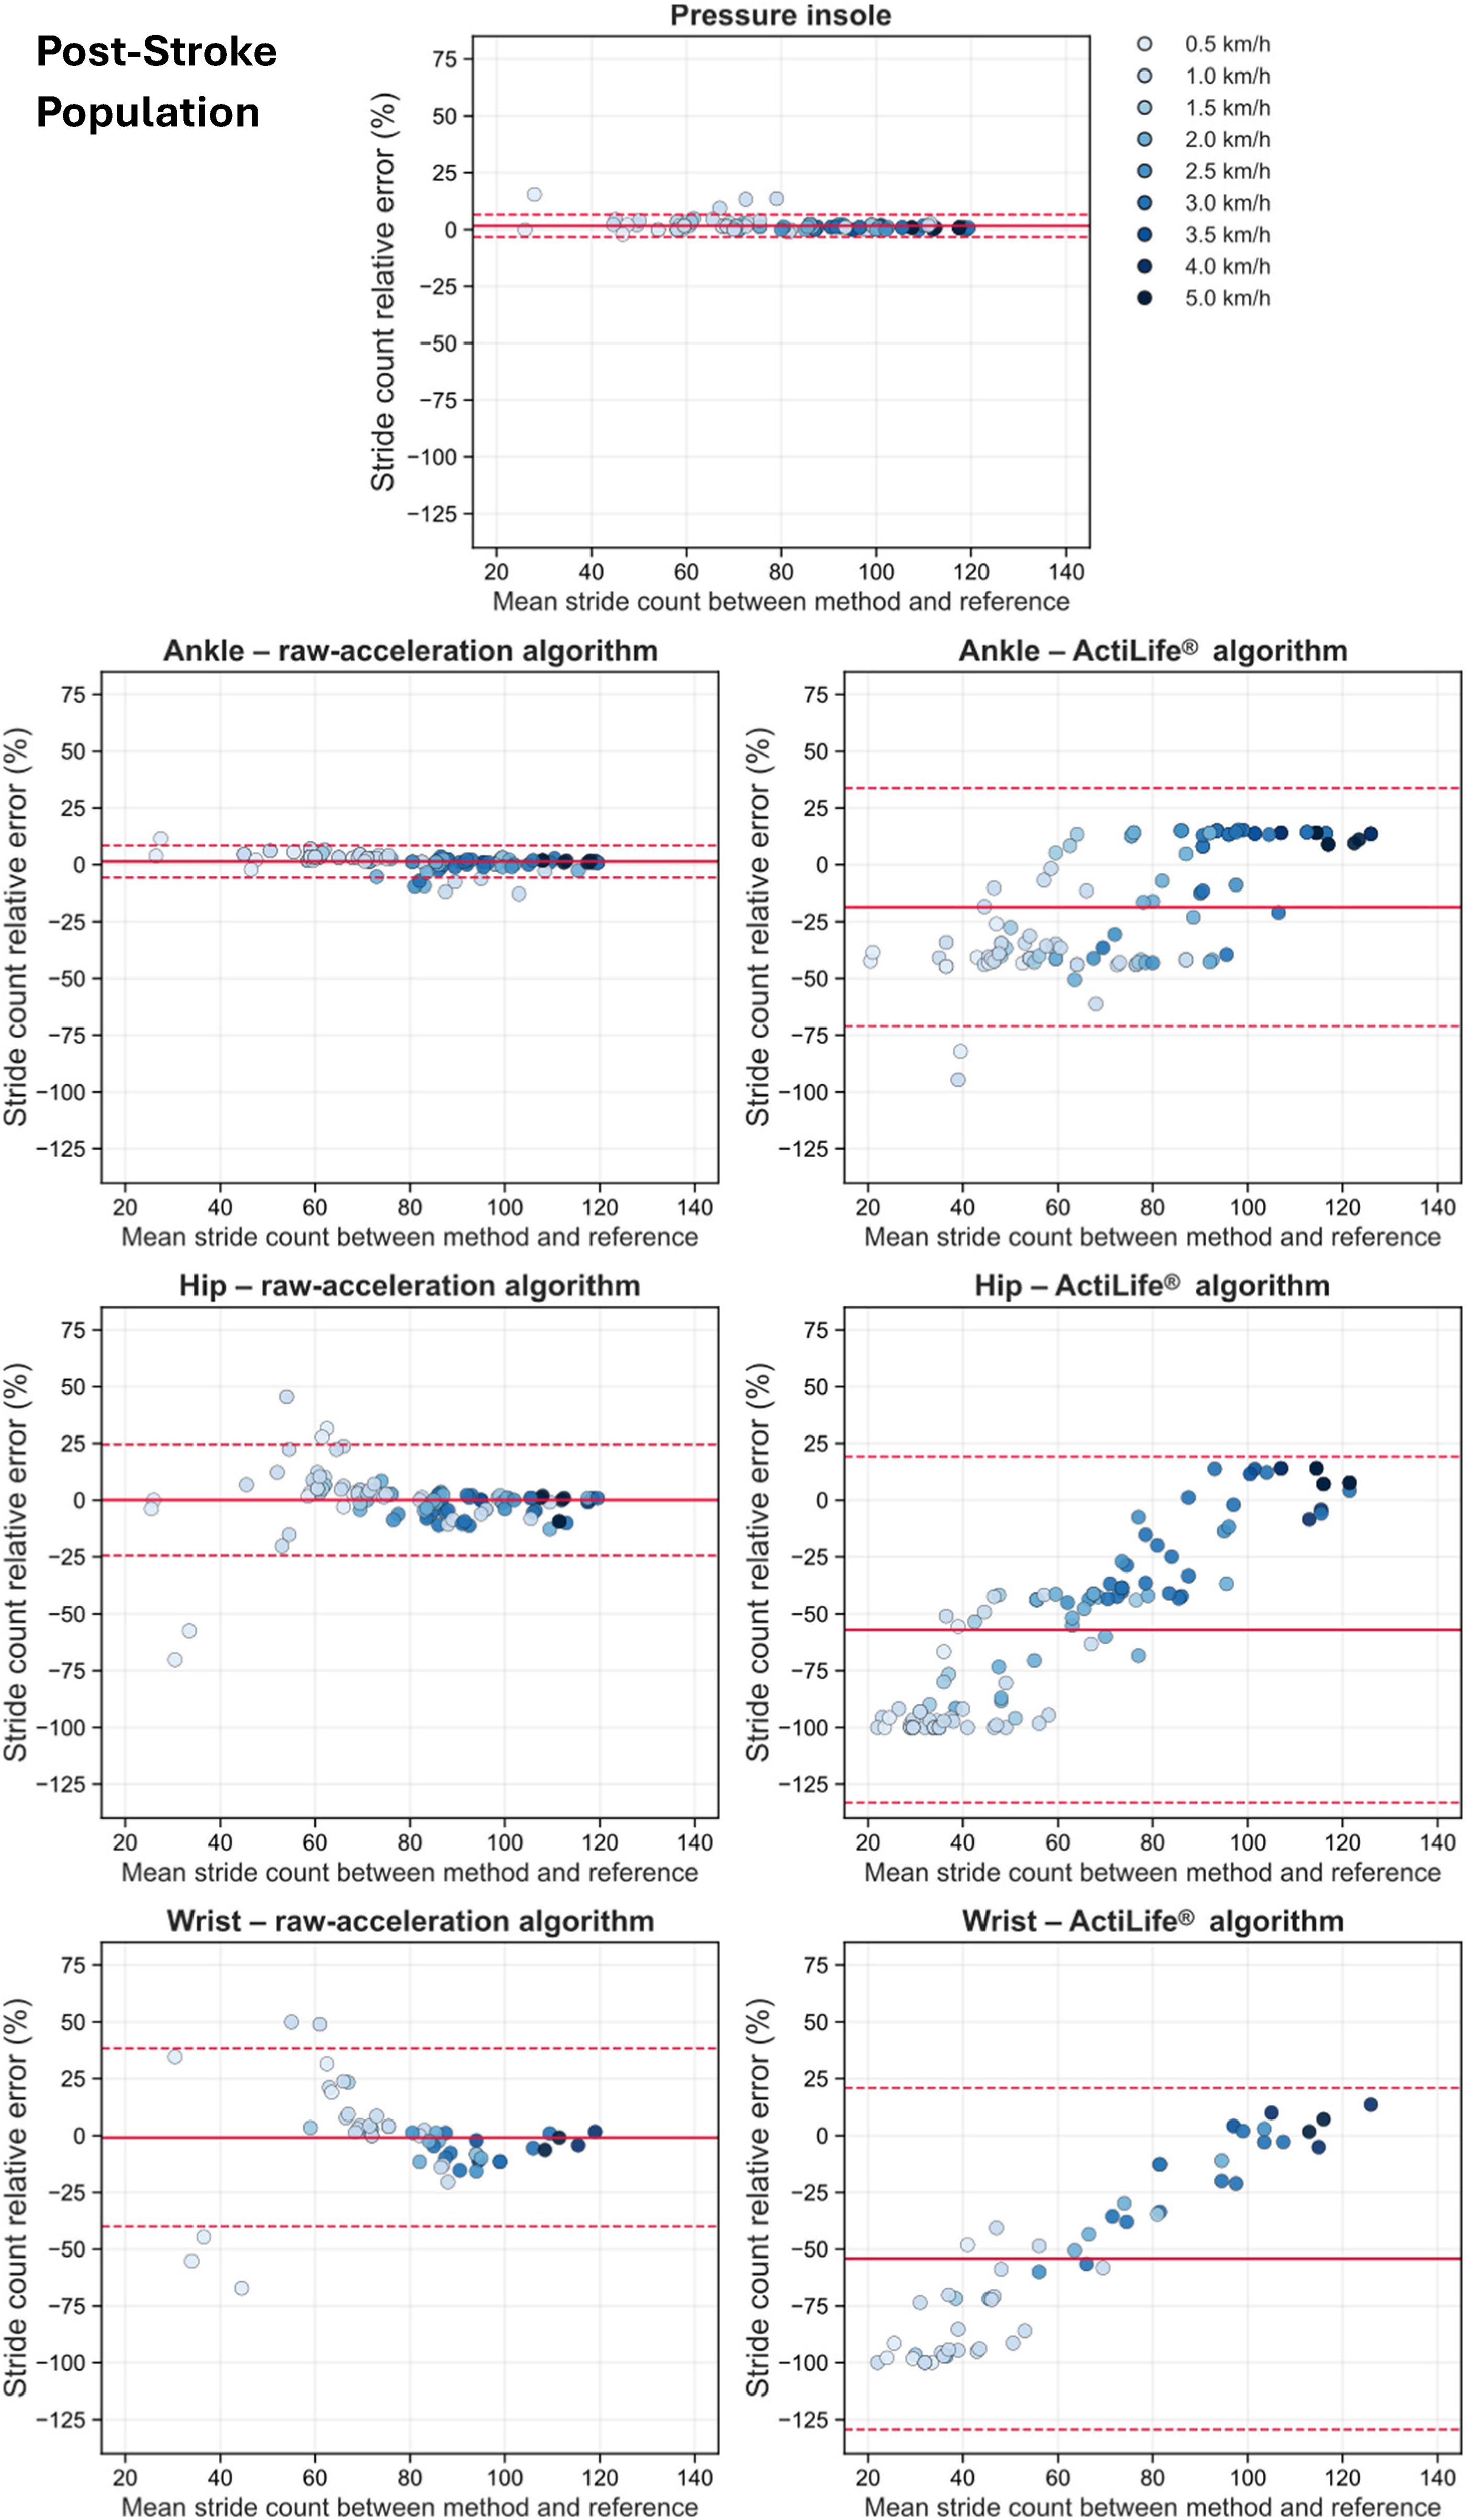
Bland-Altman plots for the seven actimetry-based stride-counting methods for the post-stroke population. Data include both paretic and non-paretic sides as well as all walking speeds. Each point represents one trial, with colors indicating walking speed. The y-axis shows the relative error between actimetry-based method and the gold standard, and the x-axis shows the mean of the two measurements. The solid red line shows the mean bias, i.e., average relative error between the actimetry-based method and the gold standard. The dashed red lines show the 95% limit of agreement (LoA), defined as the bias ± 1.96 standard deviation of the differences.
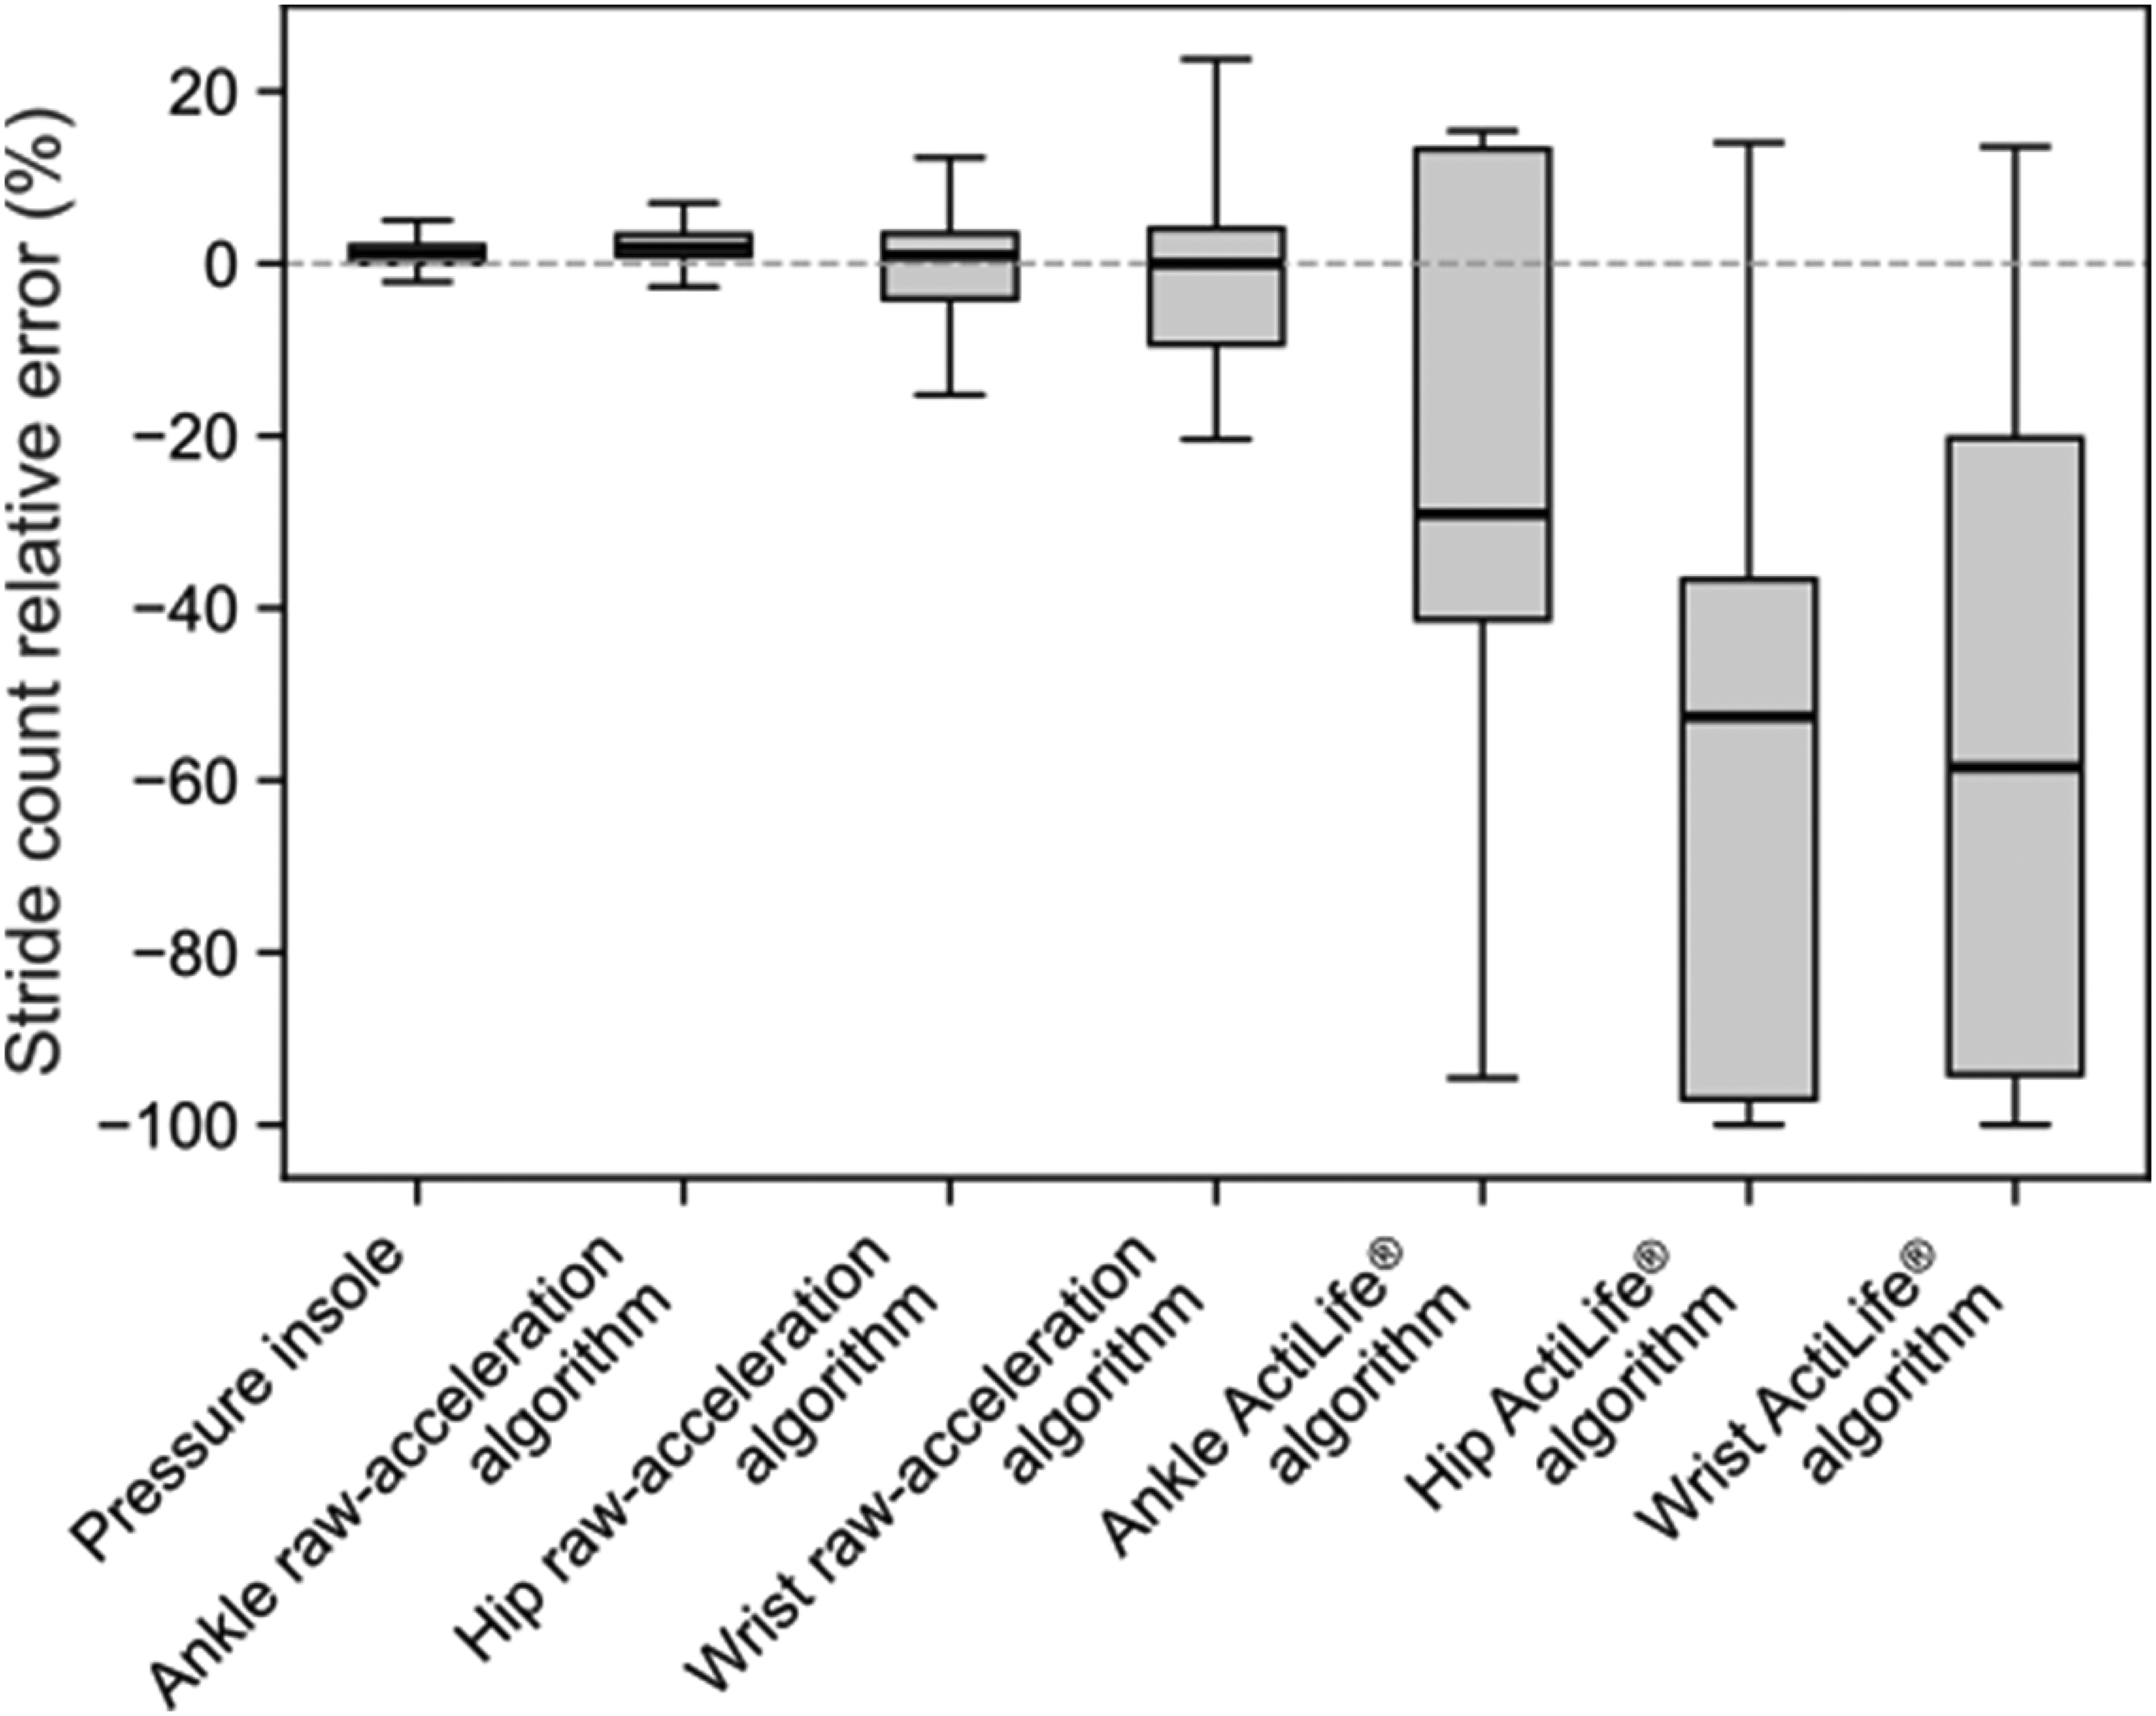
Boxplot of the relative error in stride count for the seven actimetry-based methods for the post-stroke population. Data include both paretic and non-paretic sides as well as all walking speeds. The central horizontal line within each box represents the median error, the boxes correspond to the interquartile range, and the whiskers extend to 1.5 times the interquartile range.
The concordance plots are shown in Figure 7 for all seven actimetry-based methods, and the CCC values are given in Table 2. The pressure insole and the raw-acceleration algorithm at the ankle both showed the best correspondence with the gold standard, with almost perfect agreement (CCC = 0.996 and 0.990 respectively). The raw-acceleration algorithm at the hip showed moderate agreement (CCC = 0.942). In contrast, poor agreement was found for this algorithm at the wrist (CCC = 0.828), and for the ActiLife® algorithm at all three sensor locations (ankle: CCC = 0.616; hip: CCC = 0.337; wrist: CCC = 0.408).
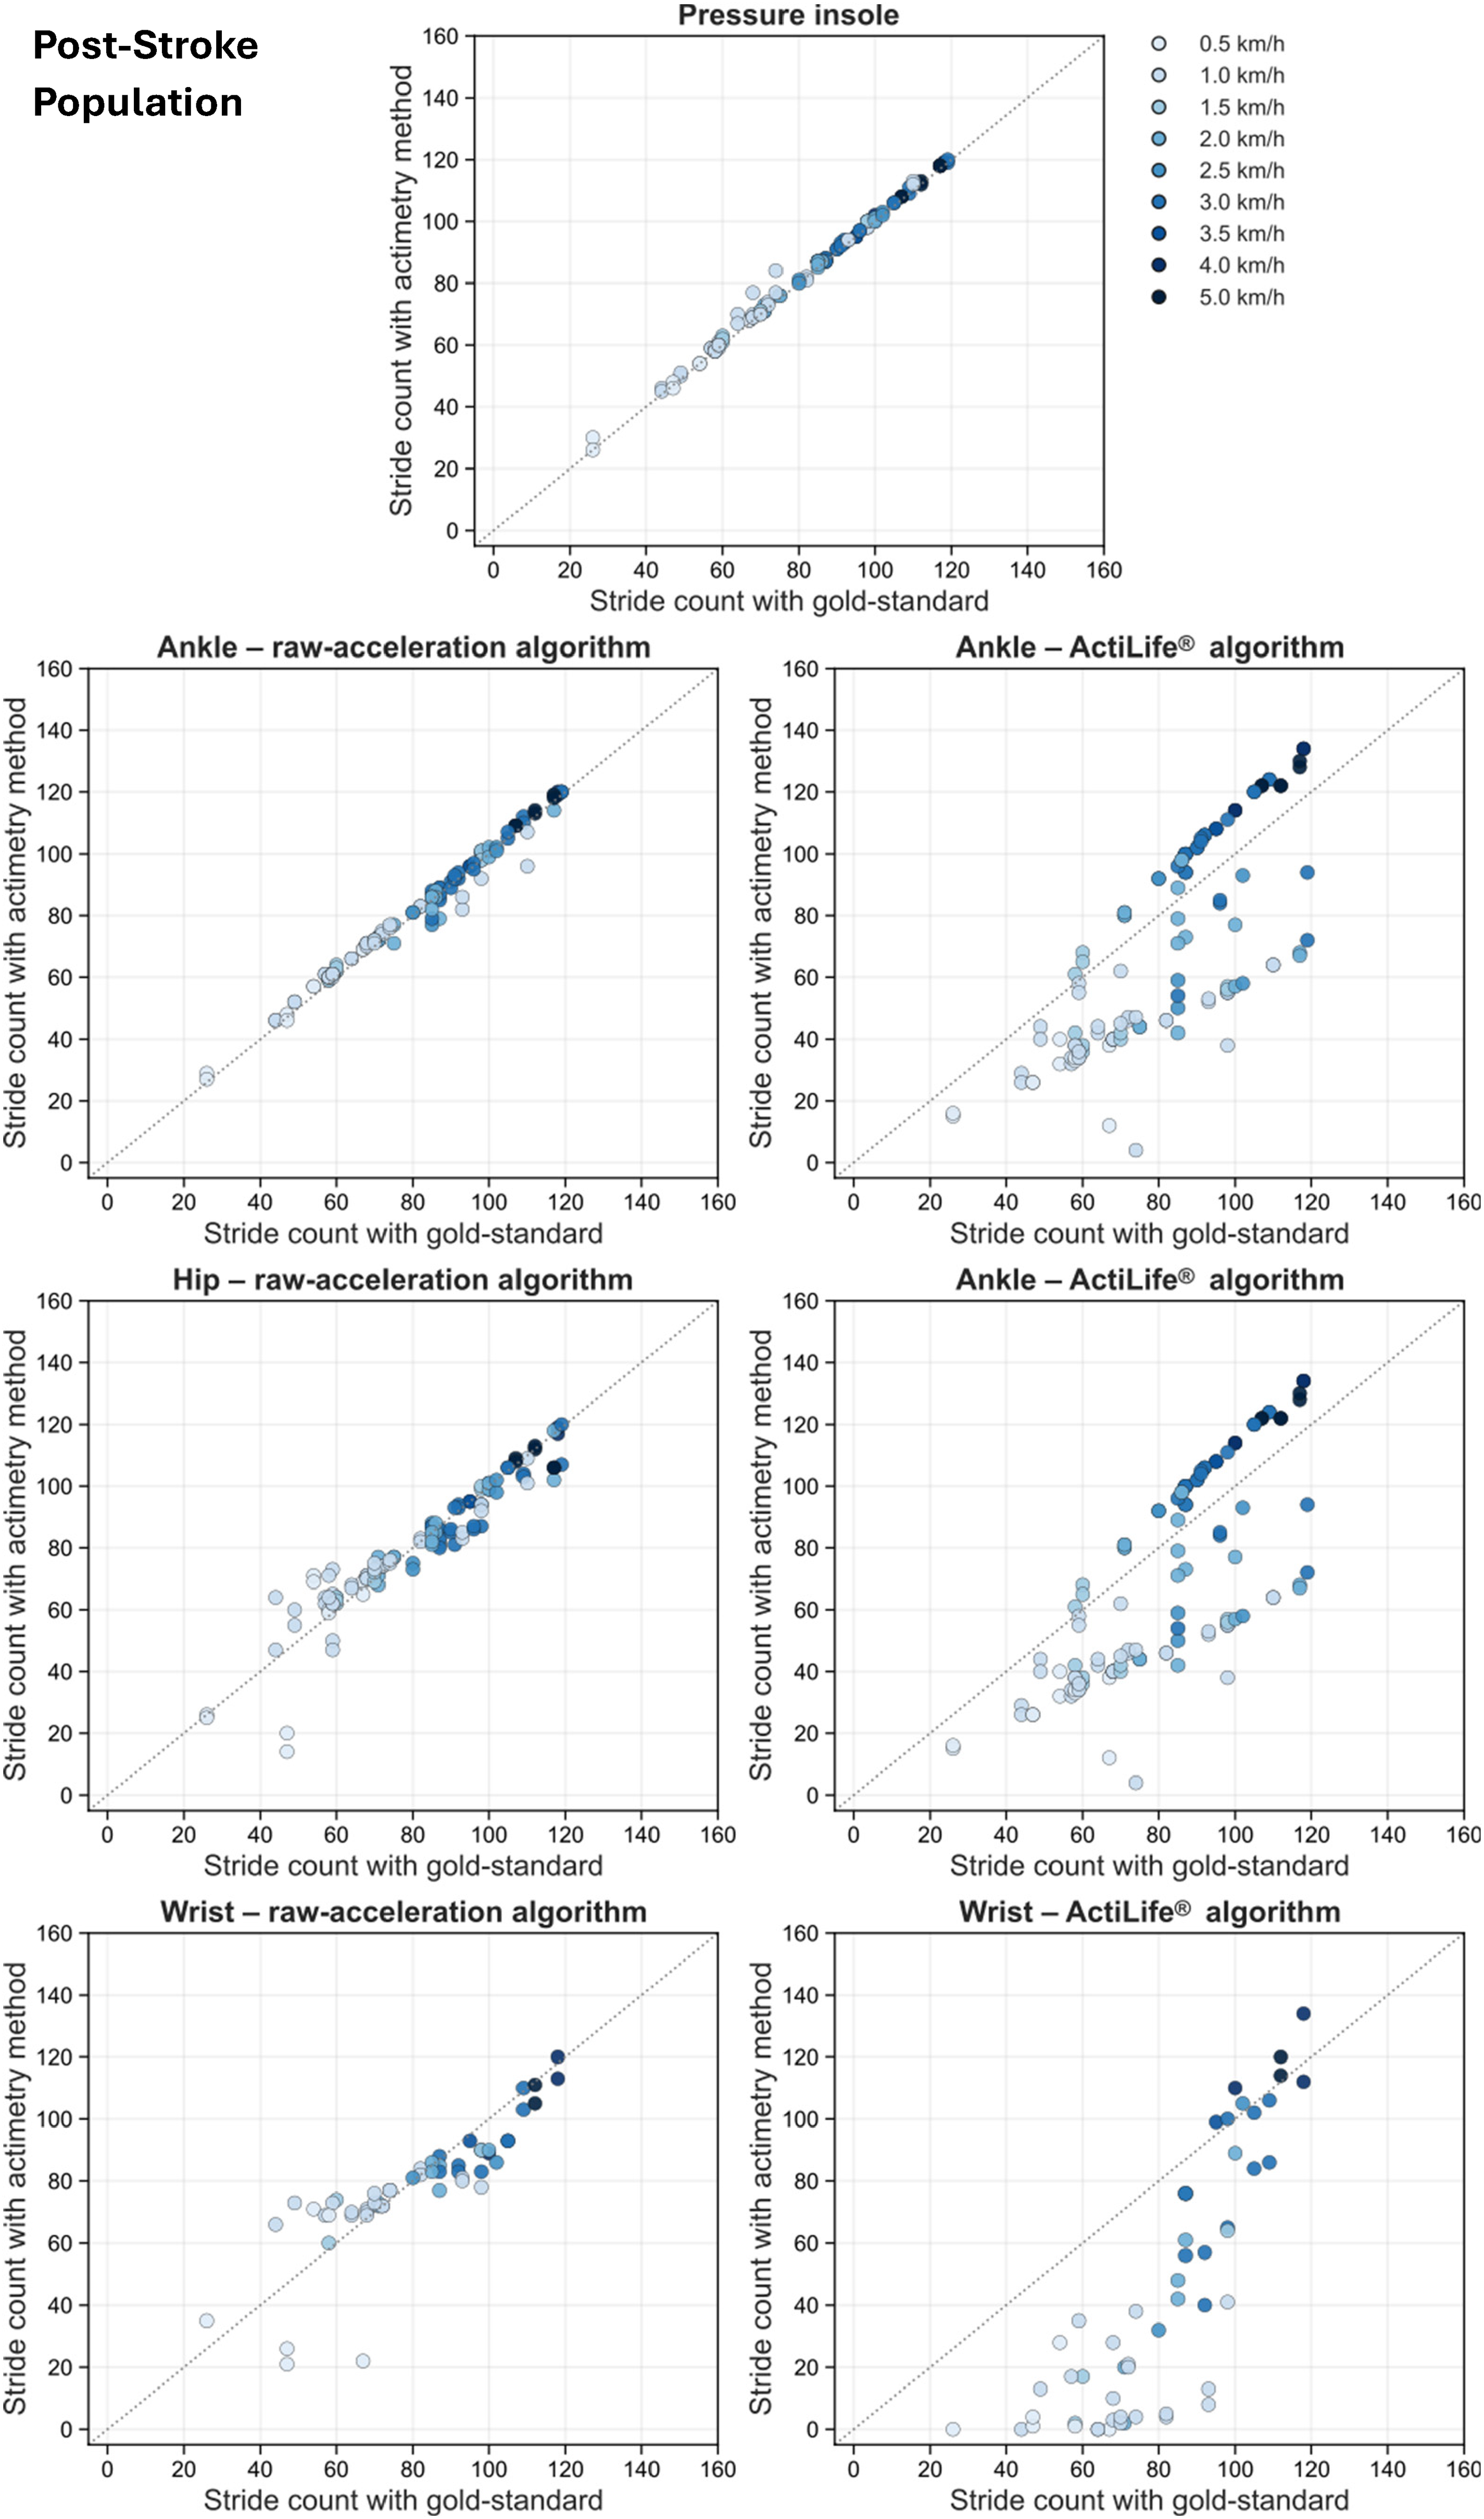
Concordance plots for the seven actimetry-based stride-counting methods for the post-stroke population. Data include both paretic and non-paretic sides as well as all walking speeds. Each plot shows the stride count measured by the actimetry-method against the gold standard. Each point represents one trial, with colors indicating walking speed. The dashed gray line represents the line of identity.
The first LMM analysis showed no significant effect of body side (p = 0.67) nor of method-by-side interaction (p = 0.54). Therefore, the side factor was removed from the model, and all subsequent analyses were performed using the simplified model excluding the side effect.
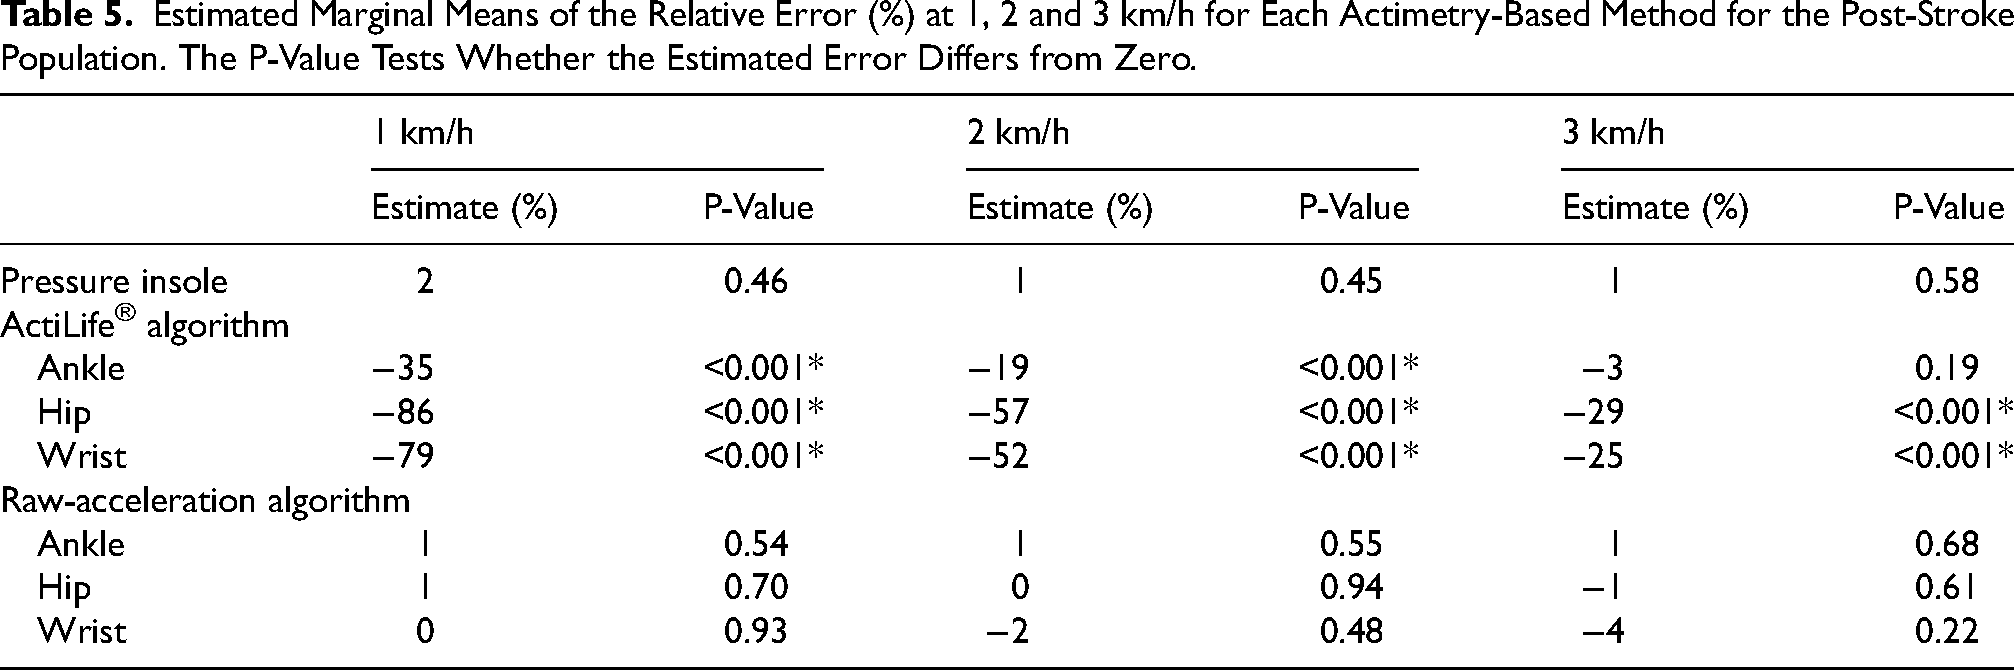
In this simplified model, the effect of actimetry method and walking speed, as well as their interaction, were statistically significant (all p < 0.001). Post-hoc comparisons of the estimated marginal means of the relative error at three representative speeds (1, 2 and 3 km/h corresponding to the 25th, 50th, and 75th percentiles) are reported in Table 5. The pressure insole and the raw-acceleration algorithm at all three sensor locations showed no significant deviation from zero at any speed (all p ≥ 0.22). At 1 and 2 km/h, the ActiLife® algorithm at all three sensor locations showed relative errors that were significantly different from zero (p < 0.001 for all). At 3 km/h, significant deviations from zero persisted for the ActiLife® algorithm at hip and wrist (p < 0.001). All these significant deviations corresponded to negative relative errors (−35%, −86% and −79% at 1 km/h for the ankle, hip and wrist; −19%, −57% and −52% at 2 km/h for the ankle, hip and wrist; −29% and −25% at 3 km/h for the hip and wrist), indicating systematic underestimation with this algorithm.
Estimated Marginal Means of the Relative Error (%) at 1, 2 and 3 km/h for Each Actimetry-Based Method for the Post-Stroke Population. The P-Value Tests Whether the Estimated Error Differs from Zero.
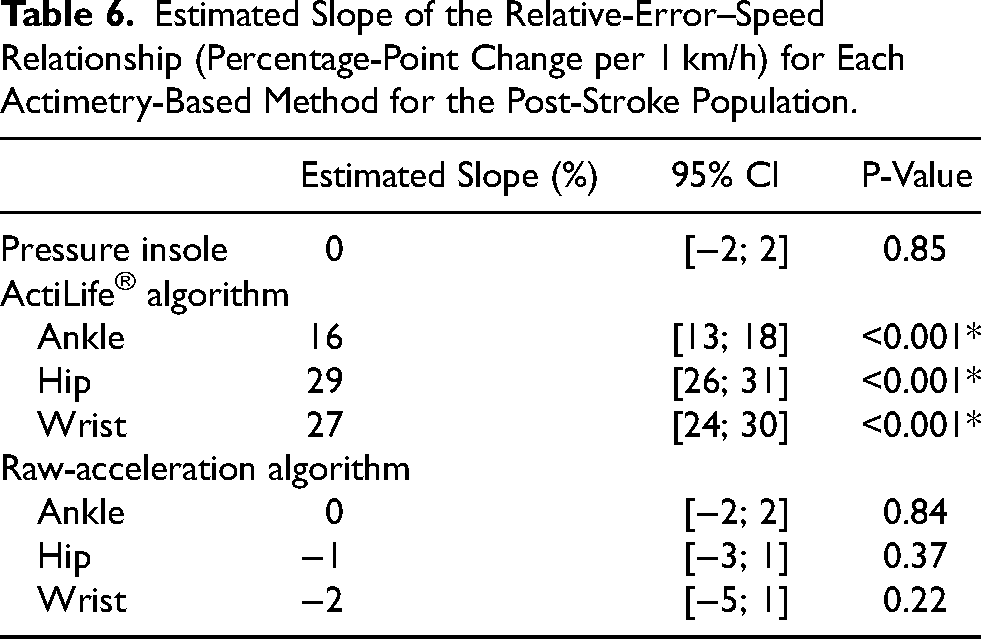
Analysis of the speed-error relationship is summarized in Table 6. Significant positive slopes were observed for the ActiLife® algorithm at all three sensor locations (all p < 0.001), indicating an increase in relative error of 16%, 29%, and 27% per 1 km/h increase in speed for the ankle, hip, and wrist placements, respectively. It means that ActiLife® algorithm produces larger errors at higher speeds, regardless of the sensor location.
Estimated Slope of the Relative-Error–Speed Relationship (Percentage-Point Change per 1 km/h) for Each Actimetry-Based Method for the Post-Stroke Population.
Discussion
The aim of this study was to develop and validate an actimetry protocol for quantifying stride counts in the poststroke population, using an instrumented treadmill with force plates as the gold standard. Our results show that both the ankle-worn raw-acceleration algorithm and the pressure insoles provided precise and accurate steps count in healthy and poststroke participants across all walking speeds. In contrast, the other methods consistently misestimated stride counts at every speed in both populations.
Insoles
Concerning the pressure insoles, results show that they achieved mean relative error below 2% across all walking speeds in both healthy and post-stroke populations, with excellent concordance with the gold standard. This high level of measurement accuracy is consistent with previous findings (Neumann et al., 2024; Ngueleu et al., 2019). These results support the use of pressure insoles as a valid portable method for stride counts in free-living conditions at all walking speeds.
Nevertheless, the pressure insoles used in this study present several practical limitations. The system relies on multiple components (insoles, external unit attached to the shoe, and a smartphone), all of which must remain connected throughout the recording. This multi-device setup increases the risk of connection loss and requires systematic checks before each session. As noted in the literature, multi-sensor configurations also inherently increase the likelihood of user-related errors, such as forgetting to attach one of the sensors, which can compromise data integrity (Baniasad et al., 2023). This issue is particularly concerning when patients or caregivers, who may lack technical training, are responsible for sensor installation (Baniasad et al., 2023). Another complication is that the battery life of the external unit does not allow multi-day recordings, unlike standalone accelerometers that can operate from 11 to 30 days (Campos et al., 2018). The need to extend battery life to enhance wearable-system performance has already been emphasized in previous work (Lin et al., 2016). Finally, real-time feedback is restricted to short recordings (≤15 min). The manufacturer is currently working on improving the system and addressing these practical limitations.
Accelerometer Placement
Regarding the accelerometers, placement appears to be a key determinant of stride count accuracy. In the present study, the raw-acceleration algorithm at the ankle yielded the lowest relative errors among all accelerometer algorithms and placements. In contrast, the raw-acceleration algorithm at the hip and wrist showed higher relative errors suggesting that these locations are less suitable for accurate stride detection.
Moreover, data processed using the ActiLife® algorithm demonstrated consistently reduced accuracy relative to the gold standard across all sensor locations, indicating that this approach would not be well suited for stride estimation. This is likely due to the algorithm's reliance on y-axis acceleration and a zero-crossing method originally optimized for hip-mounted devices (John et al., 2018). Historically, the hip has been considered the reference placement because of its proximity to the center of mass and its ability to capture whole body movement during walking and running (Toth et al., 2024). Under these conditions, one would expect hip-worn accelerometers to yield more accurate estimates. However, this was not observed in our study.
Concerning the wrist-worn accelerometer, the ActiLife® algorithm interprets movements coming from an upper limb not related to locomotion. As a result, many non-ambulatory wrist movements are misclassified as steps, leading to misalignment with the gold standard. This is consistent with previous findings in healthy adults reporting up to 160% higher step counts at the wrist compared with the hip, with discrepancies increasing to 189% in older adults (Toth et al., 2024). This limitation is further amplified in post-stroke populations, where the non-paretic wrist is frequently engaged in the use of assistive devices, which can substantially compromise the validity of wrist-worn accelerometers in free-living conditions.
In addition, in our study, a high number of participants held onto the treadmill handrails during the walking trials. Because arm swing was restricted in these cases, the corresponding wrist-worn recordings could not provide reliable locomotor signals and were therefore excluded from the stride-count analysis.
In contrast, the ankle is directly involved in the gait cycle. This explains the greater stride-count accuracy observed at this location, likely attributable to the higher acceleration peaks generated at the ankle during walking tasks (Klassen et al., 2015).
Taken together, these findings indicate that the raw-acceleration algorithm at the ankle represents the optimal compromise between accuracy and robustness across walking speeds for stride-count estimation in both healthy and post-stroke populations. Notably, 79% of post-stroke participants report the ankle placement to be comfortable, reinforcing its suitability for routine use in this population (Campos et al., 2018).
Velocity Impact
Another key factor affecting stride-count estimation was walking speed. In both healthy and post-stroke populations, the pressure insoles showed robust performance across all walking speeds. Conversely, in both populations, ActiLife® exhibited a dependance on walking speed, with large underestimations at slow speeds that progressively decreased as velocity increased.
These findings are consistent with a recent study evaluating the validity of ActiLife® to quantify step count in healthy adults across five sensor locations at different walking speeds. The authors reported that below 2 km/h, ActiLife® exhibited poor reliability compared with their video-based reference, with the waist placement performing the worst (Karaca et al., 2021). At higher walking speeds, they observed improved accuracy at the waist, whereas wrist-worn devices remained inaccurate across all speeds. Similarly, another study on healthy participants demonstrated that the ActiLife® algorithm at the ankle performed best for step detection at walking speeds above 2.2 km/h, compared with the StepWatch activity monitor (Bezuidenhout et al., 2021). Taken together, these findings confirm that ActiLife® performs poorly at slow walking speeds, which is consistent with the pattern observed in our study.
Despite the wide variety of devices available on the market, the literature consistently shows that the effect of walking speed on step-count accuracy strongly depends on sensor placement. Hip-worn accelerometers generally provide acceptable accuracy at moderate to high walking speeds. Their validity has been demonstrated mainly at walking speeds above approximately 3.2 km/h in healthy adults (Simpson et al., 2015). However, their performance deteriorates markedly at slower velocities, particularly in poststroke populations. In slow walkers (<2.88 km/h), hip-worn Fitbit® devices have even been reported to record zero steps in nearly half of participants (Klassen et al., 2015).
In contrast, ankle-worn accelerometers consistently demonstrate greater step-count accuracy and more stable performance across a broader range of walking speeds. This placement captures limb-related acceleration more directly and is therefore less affected by reduced trunk or arm movement (Bezuidenhout et al., 2021; Klassen et al., 2015). Among post-stroke individuals, ankle placement also appears advantageous, as illustrated by Google Fit®, which showed high agreement with manually counted steps (ICC = 0.93) (Polese et al., 2019). However, at moderate walking speeds (2.5–3 km/h), no significant differences in accuracy have been observed between hip- and ankle-worn Fitbit® devices (Klassen et al., 2015).
The heterogeneity observed in the present findings, combined with the pronounced effects of walking speed and device type on step count accuracy, underscores the need for further development of algorithms specifically adapted to slow walking patterns. Importantly, as the post stroke participants included in this study were relatively high-functioning walkers, these limitations may be even more pronounced in individuals with more severe gait impairments, such as those with lower FAC scores. In this study, we developed a peak-detection algorithm applied to raw acceleration signals from body-worn sensors, with the aim of improving step-count accuracy across several walking speeds and sensor placements. Among post-stroke participants, this algorithm demonstrated excellent agreement with the instrumented treadmill across all speeds and sensor placements.
Overall, our results showed that walking speed strongly influenced stride-count accuracy across sensor's placements, except for the pressure insoles, which exhibited high accuracy across all speeds. The ankle-worn raw-acceleration algorithm also showed good accuracy across walking speeds.
Effect of Wearing side
In the present study, no significant difference between sides was observed in post-stroke individuals, across any sensor location. However, previous work in controlled walking conditions has identified the non-paretic ankle as a preferred placement for quantifying step counts in post-stroke populations (Campos et al., 2018). By contrast, studies performed in ecological environments have reported that sensors worn on the non-paretic limb may overestimate step counts, likely because this limb is more heavily involved in non-ambulatory functional activities (Henderson et al., 2022). Taken together, these contrasting findings underline the importance of context when interpreting side-related differences. In the present study, all participants were required to walk on a treadmill, resulting in a sample with relatively high functional ambulation capacity (FAC 3–5), which may have minimized side-to-side discrepancies.
No significant side-related differences were found in the healthy population either. To the best of our knowledge, no previous study has specifically examined side-related differences at the hip or ankle in healthy individuals. For the wrist, however, previous work has shown that the dominant wrist records substantially more steps than the non-dominant wrist during daily activities (Park et al., 2019). This difference is therefore expected to be more pronounced in ecological environments.
Strengths and Limitations
The first strength of this study is the use of an instrumented treadmill for stride quantification. It provides a fully controlled environment free from external perturbations and allows participants to walk at a constant and reproducible speed. Importantly, it also offers an objective reference, avoiding the risk of measurement errors associated with manual observation or with non-validated wearable systems. Another strength of our study lies in the simultaneous evaluation of six accelerometers placed on the bilateral wrists, hips, and ankles, combined with bilateral pressure insoles, using an instrumented treadmill as the gold standard. This design enables direct within population comparisons across sensor placements and body sides under controlled conditions.
However, some limitations should be acknowledged. First, the results should be interpreted with caution due to the relatively small sample size. Furthermore, the study population was restricted to participants who were able to walk on a treadmill. As a result, post-stroke individuals with more severe gait impairments were not represented, which should be considered when interpreting the generalizability of the findings. In addition, the lack of long-term validation precludes assessment of the stability and reliability of the proposed approach over extended monitoring periods.
Secondly, using the treadmill in a controlled setting might be a methodological strength, but treadmill walking may not fully capture real-world gait patterns. In addition, some participants held onto the safety handrail while walking on the treadmill, even though they did not require gait assistance during overground walking, which reduced the validity of wrist-worn accelerometers measurements. Finally, manual tuning of the stride-detection algorithm may be difficult to implement consistently across operators and datasets. Accordingly, further investigation into the automation of this process is warranted. Future implementations could incorporate an automated and continuously adaptive time parameter, derived from an a priori estimation of gait cadence or walking speed. Such an approach would reduce operator dependance, enhance reproducibility, and further standardize the peak-detection procedure.
From Controlled Conditions to Free-Living Applications
The present results demonstrate the feasibility of detecting gait-related outcomes under controlled conditions. These findings suggest that wearable-based gait monitoring may be transferable to free-living conditions, provided that algorithms appropriately account for the wide variability in gait patterns and movement contexts encountered in daily life. Nonetheless, real-world application may be influenced by variable walking speeds, irregular gait patterns, and heterogeneous environmental conditions, such as uneven ground or stair ambulation, which can affect signal quality and measurement robustness.
Further studies are needed to evaluate performance in ecological, free-living environments in order to establish real-world applicability and clinical utility. In addition, dedicated validation over extended monitoring periods is required to assess the stability of measurements over time.
Additional investigations should also examine the acceptability and usability of wearable devices in daily life, particularly in the context of long-term monitoring.
Clinical Perspective
From a clinical perspective, quantifying physical activity through stride count in post-stroke populations using appropriate wearable represents a promising avenue for post-stroke clinical practice. Such measures may provide clinicians with objective feedback on patients’ real-world activity levels across care setting and outside therapy sessions. Moreover, stride count could be used to support goal setting and encourage patients to increase their daily mobility. By offering reliable and objective feedback on daily activity, the number of steps could be used to enhance motivation, support self-management and promote sustained engagement during post-stroke neurorehabilitation.
Conclusion
In conclusion, in the present study, pressure insoles and the ankle-worn raw-acceleration algorithm demonstrated the highest step-count accuracy and agreement with the gold standard across both healthy and post-stroke individuals.
Footnotes
Acknowledgments
We thank all the volunteers who agreed to participate in the experiments.
Ethical Approval and Informed Consent Statements
The study was approved by the Comité d’Ethique Hospitalo-Facultaire des Cliniques universitaires Saint-Luc (2025/11FEV/062) and is registered on ClinicalTrials.gov (NCT06943014). All participants provided written consent prior to data collection and were free to withdraw from the study at any time.
Author Contributions
L.M.: Conceptualization; methodology; investigation; data curation; formal analysis; writing – original draft.
S.D.: Supervision; writing – review & editing.
T.L.: Supervision; writing – review & editing.
V.O.: Formal analysis; software; visualization; writing – original draft; writing – review & editing.
Funding
The authors disclosed receipt of the following financial support for the research, authorship, and/or publication of this article: This work was supported by the Fonds Spéciaux de Recherche (FSR) – UCLouvain.
Declaration of Conflicting Interests
The authors declared no potential conflicts of interest with respect to the research, authorship, and/or publication of this article.
Data Availability Statement
Data are available from the authors upon reasonable request.
