
Abstract
Objective
To compare palatal mucosal thickness between individuals with and without cleft lip and palate (CLP).
Design
Retrospective observational study.
Settings
Tertiary-level craniofacial referral center.
Participants
Thirty-eight cone-beam computed tomography (CBCT) scans from individuals without CLP (control group, C) and 60 scans from individuals with CLP (test group, T).
Main Outcome Measures
Palatal mucosal thickness was measured in sagittal CBCT slices at the cementoenamel junction (CEJ) of the canine (Ca), first premolar (P1), second premolar (P2), first molar (M1), and second molar (M2). Additional measurements were obtained at 3-mm intervals from the CEJ toward the mid-palatal suture (R3, R6, R9, and R12).
Results
In group C, the thinnest mucosa was observed at M1 (2.95 ± 1.11 mm), whereas P2 showed the greatest thickness (3.72 ± 1.20 mm). In group T, P1 presented the lowest thickness (4.27 ± 1.30 mm), and M2 the highest (4.67 ± 1.93 mm). A significant difference was observed between groups (p < .001). In individuals with CLP, palatal vault height was associated with CAR6 and M1R6, whereas the number of palatoplasties was associated only with P1R6.
Conclusion
In individuals with CLP, the region extending from the distal aspect of the canine to the mesial aspect of the palatal root of the first molar appears to represent the most favorable anatomical region for palatal soft tissue graft harvesting.
Introduction
Patients with cleft lip and palate (CLP) often present specific oral characteristics, such as maxillary atresia, improper positioning of teeth, hypodontia, supernumerary teeth, and mucogingival alterations.1–3 Among these alterations, periodontal issues are the most frequent, including the absence of keratinized mucosa, 3 shallow vestibule,3,4 inflammatory gingival hyperplasia, and gingival recession (GR), which can make periodontal and restorative rehabilitation more challenging.3–5
Studies indicate that, in the general population, GR is highly prevalent in individuals over 43 years of age. 7 In patients with CLP, recession affecting teeth adjacent to the cleft has been reported more frequently than in corresponding teeth of individuals without cleft. 4 In most cases, careful planning is required to increase the volume of keratinized mucosa and to achieve root coverage. 6 Flap procedures combined with subepithelial connective tissue grafts are considered among the most predictable treatment options for these objectives.7–9
The palatal mucosa is considered the primary donor area for soft tissue grafts.9–12 Because palatal mucosal thickness varies substantially among individuals and directly influences graft dimensions and clinical outcomes, a detailed anatomical and quantitative understanding of this tissue is essential. 9 In patients with CLP, identifying palatal regions with sufficient mucosal thickness may directly inform the feasibility and safety of harvesting autogenous soft tissue grafts for mucogingival reconstruction.
In individuals with CLP, the palatal region presents developmental anomalies associated with cleft formation, including failure of fusion of the palatal shelves and, in some cases, altered palatal shelf position and related soft tissue displacement. Reconstruction of the secondary palate (hard palate region) is performed through primary palatoplasty. These approaches commonly involve mucoperiosteal flap elevation and repositioning with relaxing incisions to achieve closure and restore palatal function.13,14 Moreover, differences in palatoplasty protocols have been associated with distinct long-term craniofacial growth patterns, underscoring the heterogeneity of surgical management in this population. 14
Several reports have used cone-beam computed tomography (CBCT) to map palatal mucosal thickness in individuals without cleft-related craniofacial anomalies.11,12,15 However, there are no reports that accurately determine the average thickness of the palatal mucosa in patients with CLP or how this tissue presents following cleft-related surgical management, including primary palatoplasty and additional secondary procedures when indicated. Therefore, the objective of this study was to compare the thickness of the palatal mucosa in individuals with and without CLP using CBCT and to investigate whether factors such as sex, age, palatal vault height, palatal width, and number of palatoplasties influence mucosal thickness.
Materials and Methods
Patients
For the selection of the CBCT scans analyzed in this study, 2 institutional databases were used: images from the Department of Surgery, Stomatology, Pathology, and Radiology of the School of Dentistry and from the radiology department of the Tertiary Healthcare Center of the institution. The CBCT scans had been acquired as part of routine clinical care for diagnostic and/or treatment planning purposes in both groups. Therefore, no patient was exposed to ionizing radiation for research purposes.
For both groups, eligible scans had to meet the following criteria: individuals aged 18 years or older, of either sex, with complete maxillary CBCT records showing complete dentition from the canine to the second maxillary molar in at least 1 hemiarch, and image quality sufficient for reliable interpretation.
The control group comprised individuals without CLP or other cleft-related craniofacial anomalies.
The test group comprised individuals with unilateral complete CLP evaluated on CBCT after completion of the primary cleft management and rehabilitation protocol.
Exclusion criteria applicable to all scans were unsatisfactory restorations, palatal pathology, maxillary crowding, severe tooth rotation or spacing, bone loss visible on CBCT, GR on the palatal/lingual aspect in the region evaluated, and CBCT scans in which analysis of the palatal mucosa was not feasible because of artifacts, collapse of adjacent soft tissues, or inability to reliably identify the anatomical landmarks required for standardized measurements.
Additional exclusion criteria for the test group were syndromic diagnosis, oronasal fistula, submucous cleft only, and cleft conditions involving only the lip or only the soft palate.
After application of the eligibility criteria, the final sample consisted of 38 CBCT scans from individuals without CLP (control group, C) and 60 CBCT scans from individuals with CLP (test group, T).
Clinical Parameters
To evaluate the thickness of the palatal mucosa, points were marked on the cementoenamel junction (CEJ) of the canine (Ca), first premolar (P1), second premolar (P2), first molar (M1), and second molar (M2) in a sagittal slice of the CBCT. For each tooth, additional points were marked along the mucosa surface, extending from the CEJ towards the palatal midline, with an interval of 3 mm between them, designated as R3, R6, R9, and R12, respectively (Figure 1A). CBCT-based protocols have been used to quantify palatal masticatory mucosa thickness with clinically acceptable accuracy when standardized measurement procedures are applied.11,12,15,16
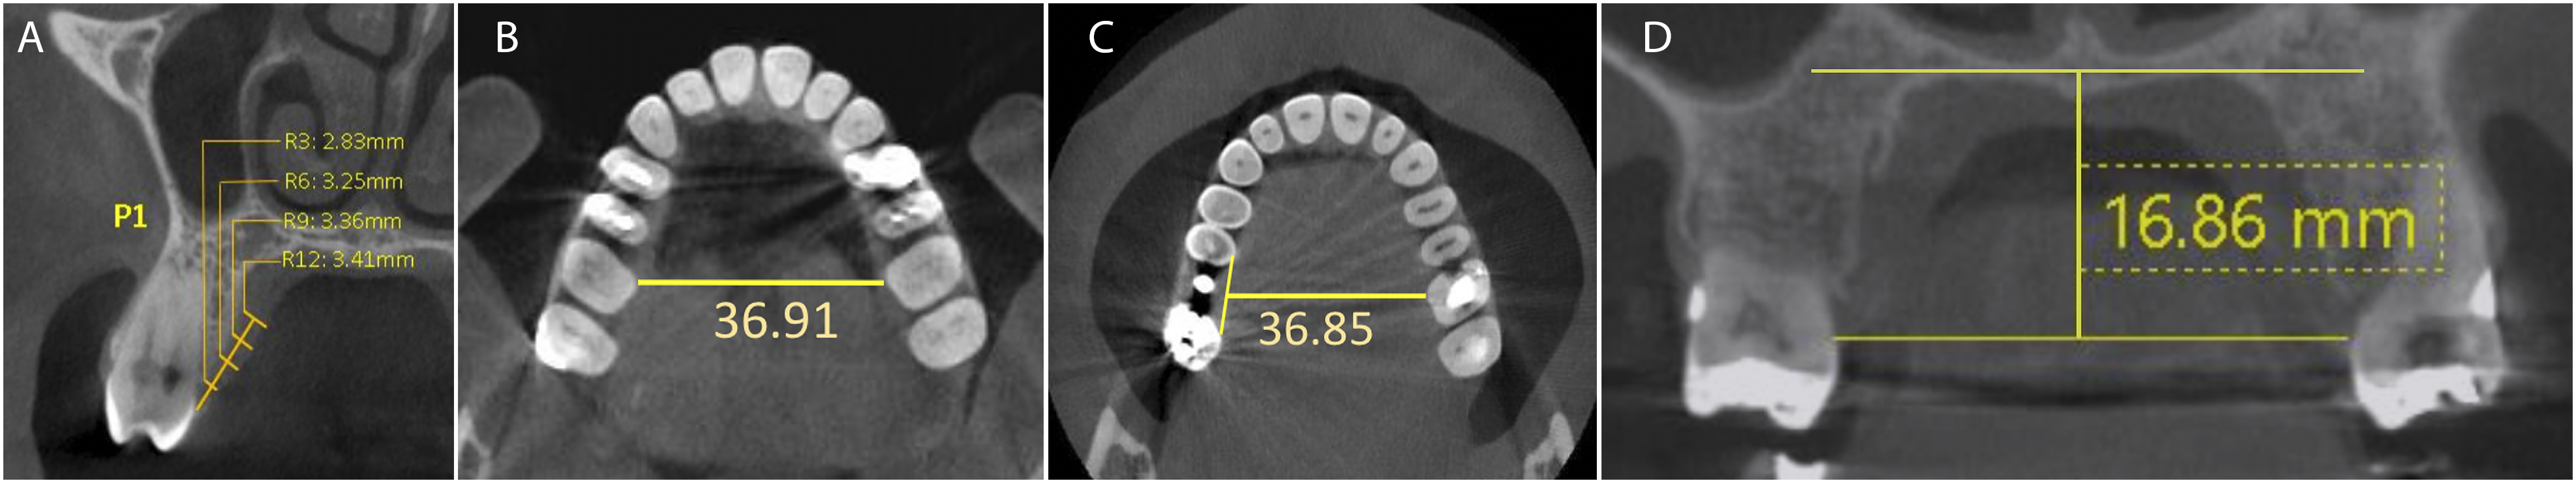
Standardization of points for the measurement of palatal mucosa thickness (A), palatal width (B), palatal width in the absence of one of the upper first molars (C), and palatal vault height (D).
The palatal width was determined in a transverse section by measuring the distance between the palatal surface of the mesial portion of the two upper first molars (Figure 1B). In cases where this measurement was absent in one of the hemiarches, a straight line drawn between the palatal surfaces of the teeth adjacent to the absent upper first molar was used as a reference for determining the palatal width (Figure 1C).
The height of the palatal vault was determined in a coronal plane by measuring the distance from the deepest point of the palatine bone to a perpendicular line drawn at the CEJ of the upper first molar (Figure 1D). The number of palatoplasty surgeries performed on patients in group T was collected from their medical records.
To determine the selected hemiarch, a preliminary statistical test was conducted, revealing no significant difference in palatal mucosa thickness and palatal vault height between the right and left hemiarches for both groups: C (p = .887) and T (p = .727). Similar results have been reported in the literature in studies involving patients without palatal cleft.17,18
This study analyzed the hemiarch that contained all teeth from the canine to the second upper molar in at least one hemiarch. When the CBCT image displayed complete dentition, the selection was made randomly. All measurements were performed by a single examiner, who was calibrated through the evaluation of 10 CBCT images over a 10-day interval. The intraclass correlation coefficient (ICC) was used to assess the reliability of all collected data, achieving an excellent classification (ICC = 0.993) as recommended by Cicchetti (1994). 18
Statistical Analysis
The obtained data were entered into Excel spreadsheets (Microsoft Corporation, USA) and subsequently processed using statistical modeling software—JAMOVI (The Jamovi Project, Sydney, Australia) to establish descriptive statistics and statistical inference. Initially, normality tests were conducted to characterize the sample results and guide the selection of the most appropriate statistical test.
To assess whether there was a statistically significant difference in palatal mucosa thickness between groups C and T, a multivariate analysis of variance was employed. Multiple linear regression analyses were performed to evaluate predictors of palatal mucosal thickness at the standardized R6 sites (CAR6, P1R6, P2R6, M1R6, and M2R6). In the combined sample (groups C and T), the predictors were cleft status, age, sex, palatal width, and palatal vault height. In a subgroup analysis restricted to group T, age, sex, palatal width, palatal vault height, and number of palatoplasties were evaluated. The Student's t-test was utilized to evaluate whether there was a statistically significant difference in palatal vault height and palatal width between groups C and T. A significance level of 5% was adopted.
Results
Overall Measurements and Analysis
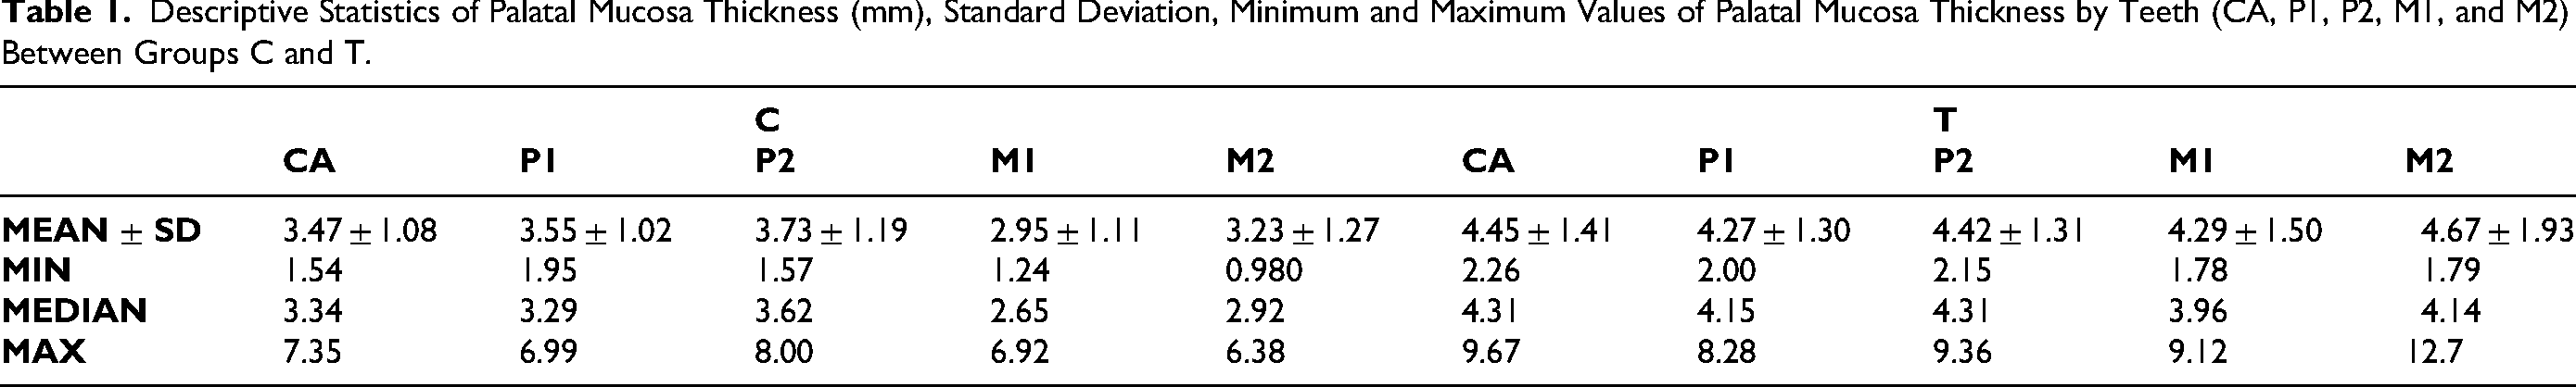
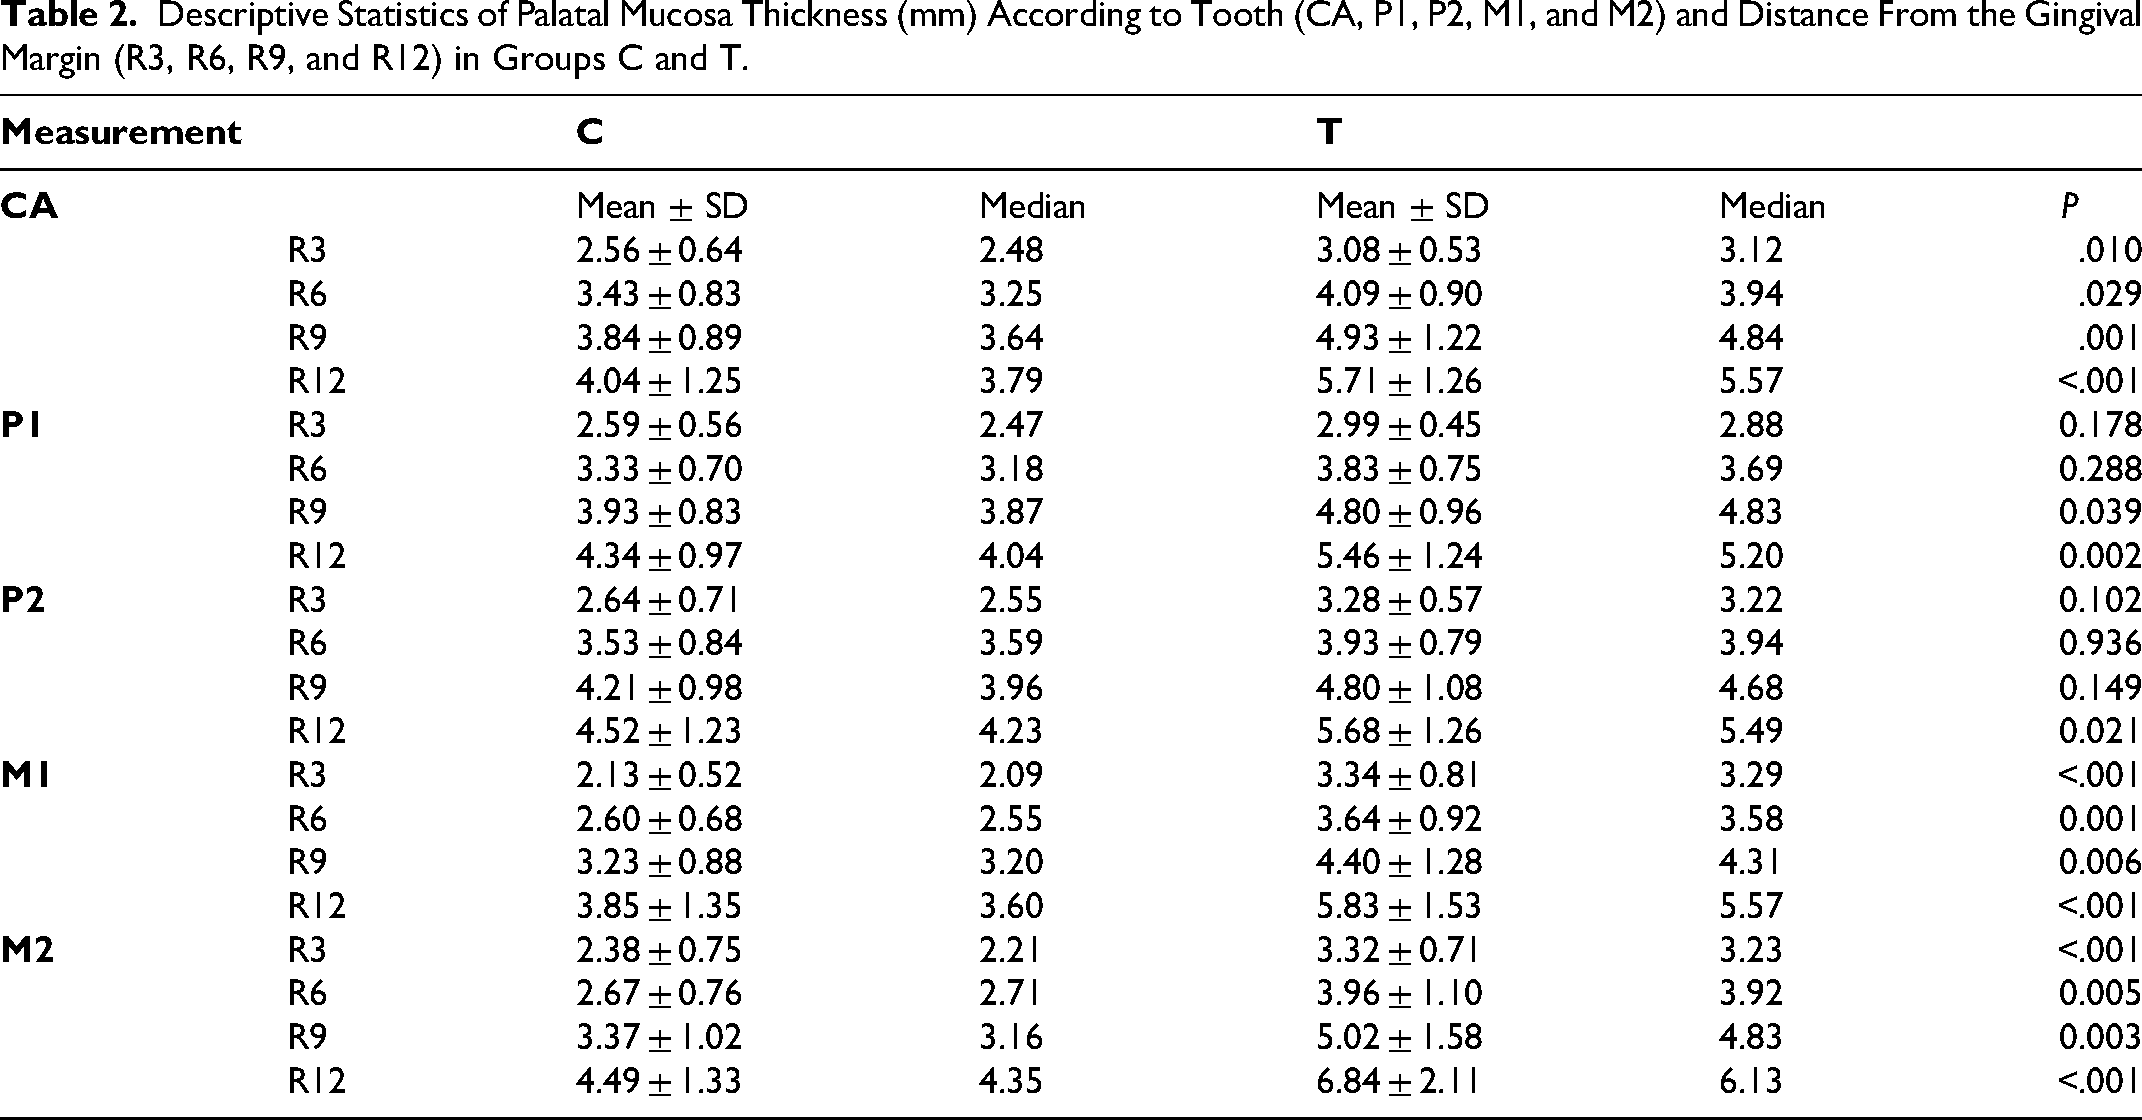
The sample consisted of 38 CBCT scans in the control group (C) and 60 CBCT scans in the CLP group (T). Group C comprised 19 females and 19 males, with a mean age of 40.9 ± 16.3 years, whereas Group T included 22 females and 38 males, with a mean age of 24.5 ± 5.9 years. For group C, the first molar region (M1) showed significantly thinner mucosa (2.95 ± 1.11 mm), while the second premolar region (P2) exhibited the thickest mucosa (3.73 ± 1.19 mm) (Table 1). In the analysis of palatal thickness, the M2-R6 region showed the minimum thickness (0.980 mm), and P2-R12 showed the maximum thickness (8.00 mm), demonstrating a statistically significant difference among the mean thickness values in Ca, P1, P2, M1, and M2 (p < .001) (Table 2).
Descriptive Statistics of Palatal Mucosa Thickness (mm), Standard Deviation, Minimum and Maximum Values of Palatal Mucosa Thickness by Teeth (CA, P1, P2, M1, and M2) Between Groups C and T.
Descriptive Statistics of Palatal Mucosa Thickness (mm) According to Tooth (CA, P1, P2, M1, and M2) and Distance From the Gingival Margin (R3, R6, R9, and R12) in Groups C and T.
In the analysis of palatal mucosa thickness for group T, the first premolar region (P1) showed the thinnest mucosa (4.27 ± 1.30 mm), while the second molar region (M2) exhibited the thickest mucosa (4.67 ± 1.93 mm) (Table 1).
Despite the differences observed between the groups, the measurements of R3, R6, R9, and R12 exhibited a similar pattern. The palatal mucosa was found to be thicker in R9 and R12 compared to measurements closer to the gingival margin (R3 and R6), highlighting a general increase in thickness as the distance from the gingival margin increased (Table 2).
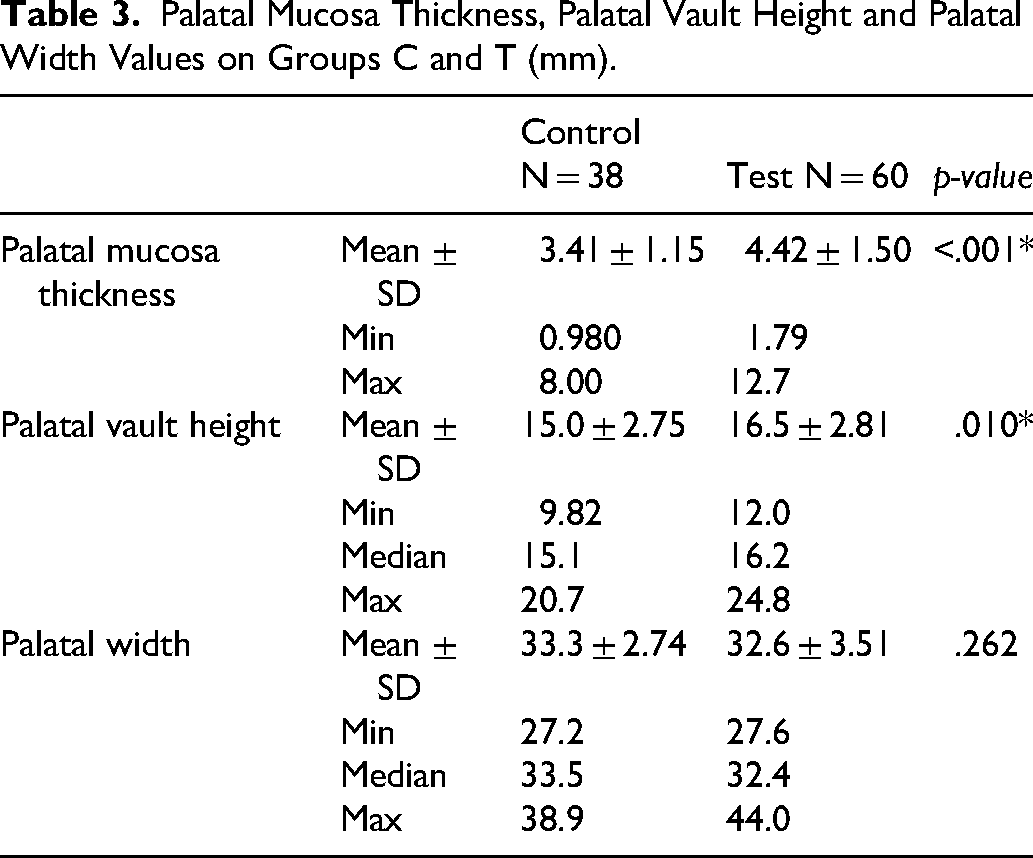
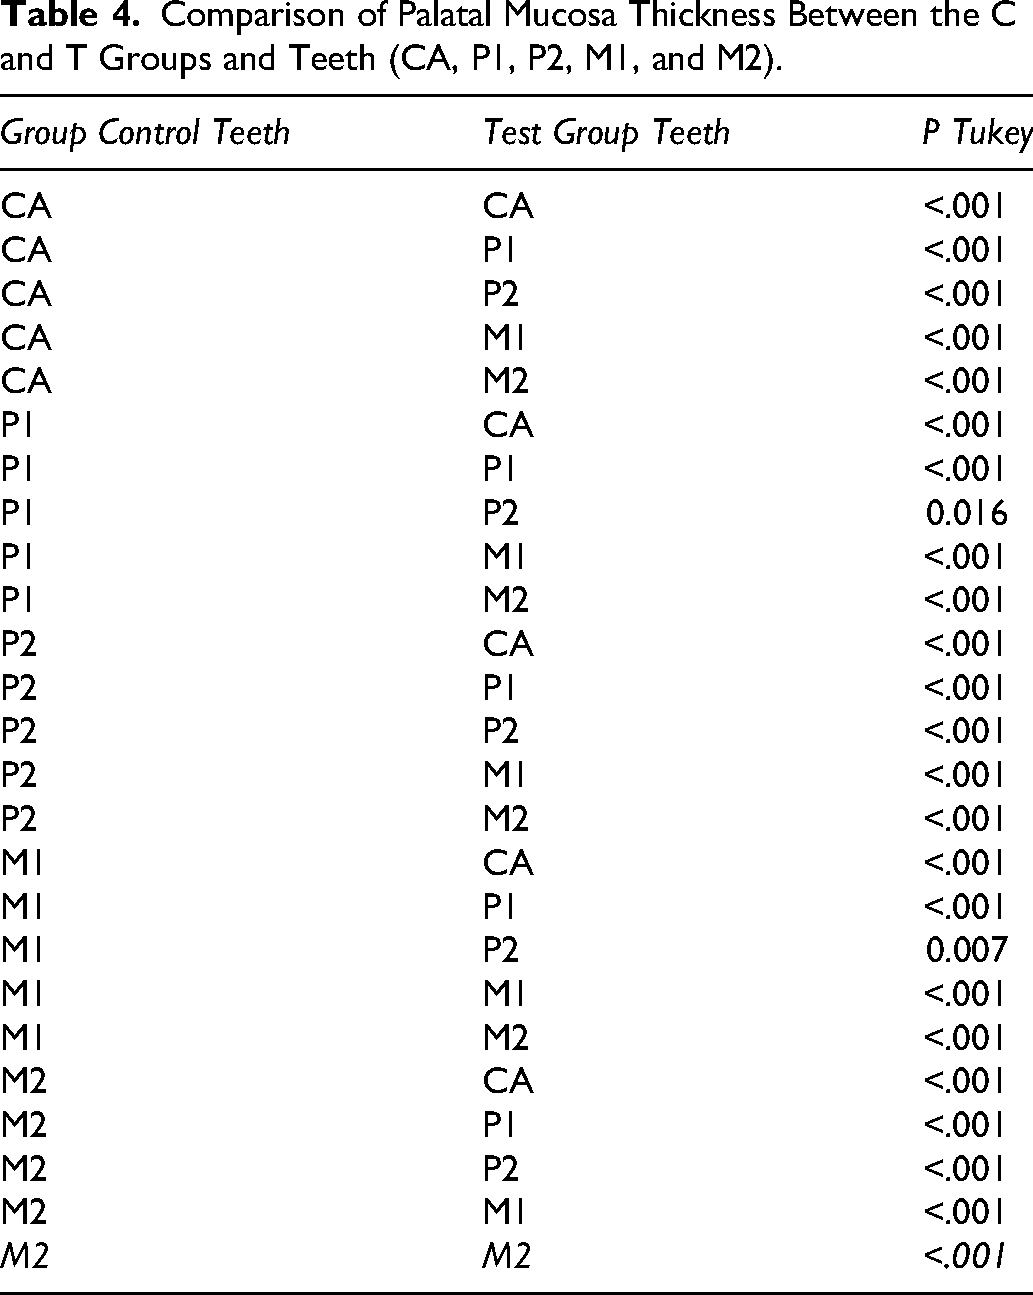
Group T exhibited a greater mean palatal mucosal thickness than group C (4.42 ± 1.50 mm vs. 3.41 ± 1.15 mm; P < .001) (Table 3), and intergroup comparisons by tooth showed statistically significant differences throughout the evaluated dentition (Table 4).
Palatal Mucosa Thickness, Palatal Vault Height and Palatal Width Values on Groups C and T (mm).
Comparison of Palatal Mucosa Thickness Between the C and T Groups and Teeth (CA, P1, P2, M1, and M2).
Whole-Sample Multivariable Regression Analysis of Predictors of Palatal Mucosal Thickness
A multiple linear regression analysis was performed in the combined sample (groups C and T) to assess whether cleft status, age, sex, palatal width, and palatal vault height were independently associated with palatal mucosal thickness at the standardized R6 sites (CAR6, P1R6, P2R6, M1R6, and M2R6). In this whole-sample model, cleft status was significantly associated with greater mucosal thickness at CAR6, P1R6, M1R6, and M2R6 (p < .05), but not at P2R6 (p = .174). Age, sex, palatal width, and palatal vault height were not significant predictors in this model.
Subgroup Multivariable Regression Analysis in the Cleft Group
In group T, 34 individuals (56.7%) had undergone 1 palatoplasty, 17 (28.3%) had undergone 2, 6 (10.0%) had undergone 3, and 3 (5.0%) had not undergone palatoplasty. A multiple linear regression analysis restricted to the cleft group was then performed to assess whether age, sex, palatal width, palatal vault height, and number of palatoplasties were associated with palatal mucosal thickness at the standardized R6 sites. In this subgroup analysis, palatal vault height was significantly associated with CAR6 (p = .031) and M1R6 (p = .041), whereas number of palatoplasties was significant only for P1R6 (p = .036).
Comparison of Palatal Vault Height and Palatal Width Between Groups
The palatal vault height showed a statistically significant difference (p = .010) between the groups. Group T had a greater height compared to group C (Table 3). In the palatal width comparison, no statistically significant difference was found (p = .262) (Table 3).
Discussion
In this study, 38 CBCT scans from individuals without CLP (group C) and 60 from individuals with CLP (group T) were evaluated. The results demonstrated a statistically significant difference in palatal mucosa thickness between groups C and T across all analyzed teeth, from the canine to the second molar. These findings indicate that the presence of CLP is consistently associated with differences in palatal soft tissue morphology.
For group C, the region with the highest value was P2, while the M1 region exhibited the thinnest measurement. Similar findings have been reported in the literature.12,19,20 In contrast, for group T, the P1 region had the lowest thickness, while the M2 region showed the greatest thickness.
Few studies in the current literature have investigated palatal mucosal thickness in individuals with CLP. Our results are in partial agreement with those of Moscarino et al., 21 who found thicker soft tissue in patients with cleft than in controls. However, the explanation proposed in that study was related to the cleft region itself, where partial absence of bone may account for the increased mucosal thickness. In the present study, this rationale is not directly applicable, because measurements in group T were limited to sites located up to 12 mm from the CEJ, thus excluding the cleft region.
Multiple linear regression analysis was conducted to investigate the influence of factors such as age, sex, palatal width, and palatal vault height on palatal mucosa thickness. The results showed that the presence of CLP was the only factor that demonstrated statistical significance (p < .001). Together, these data demonstrate that the presence of CLP is independently associated with increased palatal mucosal thickness. Although the control and test groups differed substantially in age, age was not significantly associated with palatal mucosal thickness in the whole-sample multivariable regression model. Therefore, within the limits of this retrospective dataset, the greater mucosal thickness observed in the cleft group cannot be attributed to age alone.
To further explore factors operating within the cleft group, a separate multivariable analysis restricted to this subgroup was performed to assess whether variables within the cleft group were associated with palatal mucosal thickness. In this analysis, palatal vault height was significantly associated with CAR6 and M1R6, suggesting that local palatal morphology may influence tissue thickness in specific regions among individuals with CLP. Palatal vault height and transverse width in individuals with CLP may reflect expected developmental patterns and may also be influenced by orthodontic expansion. Because expansion adequacy was not specifically assessed in this study, palatal width findings should not be interpreted as evidence of “proper expansion,” and the interpretation of vault/width-related findings is presented without attributing causality to expansion.
Studies conducted on patients without clefts observed that groups with higher palatal vaults presented significantly thicker mucosa.12,17 However, there are no references that have conducted similar analyses in individuals with CLP. Anatomical differences in individuals with CLP may be accompanied by local soft tissue adaptations. Although the mechanisms underlying these differences cannot be determined from the present data, such adaptations may help explain the greater mucosal thickness observed in this group.
In the present study, the average height of the palatal vault was 15 mm for group C and 16.5 mm for group T, highlighting a statistically significant difference between the groups (p = .010). Regardless of the relationship between palatal vault height and mucosa thickness, previous anatomical studies indicate that higher vaults may provide a greater margin of safety for palatal graft harvesting than lower ones.21,22 In this context, “margin of safety” refers to the anatomical safety window for palatal soft tissue graft harvesting, in which higher palatal vaults provide a wider vertical distance that may help avoid harvesting too close to the gingival margin, thereby reducing the risk of postoperative GR, and too close to the expected course of the greater palatine neurovascular bundle. However, these results should be interpreted with caution. Because of the cleft anatomy, vault height was measured at the highest palatal point rather than with reference to the median palatine suture, as described in studies of individuals without CLP.11,12,17 In addition, cleft-related anatomical variation may influence the course of the greater palatine artery. Evidence directly evaluating its trajectory in CLP remains limited, and the low soft tissue contrast of the available CBCT images did not allow reliable assessment in the present study.
In contrast, the number of palatoplasties was significantly associated only with P1R6. This localized finding should be interpreted cautiously. Although repeated surgical intervention may contribute to soft tissue remodeling, important surgery-related variables such as age at repair, surgical technique, and operator-related variability were not available in this retrospective analysis. Accordingly, the present results do not support broad conclusions regarding the effect of palatoplasty burden on palatal mucosal thickness.
Because CBCT examinations were obtained as part of routine clinical care for diagnostic and/or treatment planning purposes in both groups, the study sample may not fully represent the broader populations of individuals with and without CLP. This should be considered when interpreting the generalizability of the findings. Furthermore, because the sample was derived by convenience from available eligible records, the strength and external validity of the conclusions are inherently limited. Differences in age distribution between groups may also have affected external validity, although age was not a significant predictor in the adjusted model.
Additional factors not captured in the present dataset, including body mass index, smoking habits, and recent procedures involving the palatal mucosa, may also influence mucosal thickness.
The results suggest that the most suitable region for palatal graft harvesting in individuals with CLP is anatomically similar to that described for individuals without CLP, located between the distal aspect of the canine and the mesial aspect of the palatal root of the first molar.
It is recommended that future studies with larger samples and longitudinal follow-up be conducted to more accurately assess the evolution of mucosa thickness over time. It is especially important to investigate the trajectory of the greater palatine artery in group T, aiming to ensure greater safety in obtaining the graft.
Conclusions
Individuals with CLP exhibited greater palatal mucosal thickness than individuals without CLP. This difference was consistently observed across the evaluated dental regions, indicating that cleft status is associated with differences in palatal soft tissue morphology.
Although individual variability and the heterogeneity of surgical histories must be considered when interpreting these findings, the results support the clinical feasibility of palatal graft harvesting in individuals with CLP. Importantly, the anatomically most favorable donor region in these patients appears to be similar to that observed in individuals without cleft, extending from the distal aspect of the canine to the mesial aspect of the palatal root of the first molar.
These findings provide clinically relevant guidance for periodontal and reconstructive procedures in this population and highlight the need for further investigations incorporating longitudinal designs and detailed surgical data to refine risk assessment and surgical planning.
Footnotes
Ethical Approval and Informed Consent Statements
This study was approved by the Research Ethics Committee of institution (CAAE: 51858021.0.0000.5417). All patients were informed about the study, received detailed explanations, and provided informed consent.
Funding
The author(s) disclosed receipt of the following financial support for the research, authorship, and/or publication of this article: This work was supported by the Coordination for the Improvement of Higher Education Personnel (CAPES, Finance Code 001).
Declaration of Conflicting Interests
The authors declared no potential conflicts of interest with respect to the research, authorship, and/or publication of this article.
Data Availability Statement
The datasets generated during and/or analyzed during the current study are available from Ana Lúcia Pompéia Fraga de Almeida upon reasonable request.