
Abstract
This study aims to develop a multi-dimensional night-time economy vitality index (NTEVI) to measure the vitality of night-time economic (NTE) activities in Zhejiang Province, China, covering its 11 cities and 90 counties. Comprising 44 supply and demand indicators of the NTE, the index was composed of an overall index and six major sub-indices that measured the vitality of six typical NTE subsectors, including catering, shopping, recreation, accommodation, touring, and fitness. The NTEVI was calculated using a unique multi-source dataset based on hourly online transaction data from a leading Chinese online-to-offline service platform, monthly night-time electricity consumption data, and official statistics from 2019 to 2020. Robustness and sensitivity analyses were conducted to ensure high credibility of the index results. The findings of this study suggested that the NTEVI was highly and significantly correlated with night light indices, economic indicators, and tourism demand measures. By identifying regional and temporal differences across several service sectors over time at the county, city, and provincial levels, the NTEVI serves as a powerful numerical and visual tool: it offers key information to guide policy formulation, resource allocation, and policy evaluation. In the context of COVID-19, the index analyses also reflect the NTE recovery process in Zhejiang Province. Our findings indicate that it is important for the Chinese government, regional authorities, and enterprises to encourage the NTE as a main driver of economic revitalization.
Introduction
The coronavirus (COVID-19) pandemic has proven devastating for the world’s economy. Barriers to global travel, such as quarantine measures, blanket anti-travel advisories, inadequate testing and contact tracing, limited adoption of global health and safety protocols, a lack of coordination across governments and between public and private sectors, and a second wave of infections could all lead to major economic losses. As lockdown and social distancing restrictions ease across the globe, domestic tourism is set to assume a vital role in rebuilding economies. The night-time economy (NTE), comprising economic activities that occur between 6 p.m. and 6 a.m. and include catering, culture, entertainment, arts, festivals, events, sports, nightlife, tourism, and transportation services, is becoming a main engine for urban economic recovery. The NTE plays multiple roles in promoting urban development and enhancing urban vitality, the most important of which include stimulating economic growth, increasing employment opportunities, expanding consumption, and improving cities’ competitiveness and attractiveness. For example, the NTE is the fifth largest industry in the UK: the region’s vibrant NTE accounts for nearly 8% of the UK’s employment and annual revenues of 66 billion GBP (6% of the UK’s total yearly revenues) (NTIA, 2020). Australia’s NTE made up about 4% of the country’s economy in 2019, suggesting upside potential for Australia compared with the UK (Deloitte Australia, 2019). Regional and national governments have also given increasing attention to the NTE, especially in the context of COVID-19. In the short run, as an important source of employment and additional revenue for local governments, the NTE can relieve the pressure of unemployment, boost consumption, and hedge against economic losses caused by the pandemic. In the long run, the NTE can keep cities vibrant at night by creating a sense of belonging for residents and tourists, raising investors’ and consumers’ confidence, and ultimately accelerating economic recovery.
Under the national government’s effective control of COVID-19, the pandemic is waning in China. Residents’ enthusiasm for consumption, which was previously restrained, is hence beginning to recover. China sent several positive signals about rebuilding the domestic tourism market over 2019, although many countries are still struggling to kickstart their battered tourism industries. The number of domestic trips totaled 637 million and overall tourism revenue reached 466 billion yuan in 2020; encouragingly, domestic tourism managed to recover to nearly 80% of the 2019 level (WIND, 2021). With the intensive introduction of government policies, ongoing improvements in infrastructure, and shifts in urban residents’ consumption habits, China’s NTE continues to develop rapidly despite the pandemic. By 1 October 2020, China had issued 197 policies related to the NTE throughout the year—four times greater than the number of policies published in 2019 (China Tourism Academy, 2020). In addition to the government’s strong support for NTE development, many studies have shown Chinese urban tourists’ growing propensity for night-time spending: 92% of tourists reported participating in night-time tours, and 53% of domestic tourists who stayed for an average of 3 days spent two nights experiencing local nightlife (China Tourism Academy, 2019). Tourists’ night-time expenditure accounted for 30% of their full day’s expenditure; further, tourism expenditure alone represented nearly 30% of full-day spending (China Tourism Academy, 2019). The above analysis suggests that, similar to many other developed countries/regions, the NTE has become an important component of China’s modern urban economy. Numerous societal features—from the macro-level political environment to micro-level consumer behavior—have empowered the vigorous development of China’s NTE.
Most NTE-related studies have focused on formulating relevant strategies, policies, and plans with an emphasis on urban governance and maintaining law and order (Beer, 2011). Systematic evaluations of the economic and social impacts of urban NTE are rare. Meanwhile, quantitative measures are urgently needed to facilitate government and business stakeholders’ policy planning and decision making to recover from COVID-19. In addition, despite sufficient academic attention toward the economy in general, the NTE has merely served as a context to support tourism research. The nature and dynamics of the association between the NTE and tourism have not been explored in detail (Zmyslony and Pawlusiński, 2019).
Taking Zhejiang Province, China, as a case, this study aims to construct a multi-dimensional night-time economy vitality index (NTEVI) using multi-source big data to assess the degree of vitality of the NTE and its subsectors (i.e., catering, shopping, recreation, accommodation, fitness, and tourism) at the county, city, and provincial levels. The present study makes several noteworthy contributions. First, this research presents an innovative index to measure the vitality of Zhejiang Province’s overall NTE and its typical subsectors. To the best of our knowledge, this study is one of the first to develop such an analytical tool to monitor the NTE at the county, city, and provincial levels. The NTEVI consists of an overall index and several sub-indices to convey the performance of six NTE subsectors, monitor the recovery process, and track the pandemic’s impact on the overall NTE and these subsectors. Second, the proposed index is continuous, transparent, comparable across counties and cities over time, and can be applied for econometric analysis. Rooted in the definition and nature of the NTE, the index reflects structural features of the NTE based on a supply–demand framework of economics. Third, we adopted a rigorous strategy to define NTEVI parameters and return reliable empirical evidence to quantitatively measure how prosperously a region has cultivated its NTE. A set of sensitivity and robustness analyses substantiated the NTEVI’s capacity to generate credible findings. The credibility and robustness of the proposed methodology was further confirmed through correlation analysis based on a group of established economic and tourism indicators. Fourth, a multi-source dataset consisting of hourly data from one of a leading Chinese online-to-offline service platform, monthly night-time commercial electricity data, and annual official statistics was constructed to calculate the NTEVI. Our rich findings based on an index analysis of the NTEVI hold great value for the Chinese government and regional authorities; stakeholders can promote the NTE as one of the most important drivers of economic revival amid the COVID-19 pandemic.
The rest of this article is organized as follows. The Literature Review section provides a comprehensive review of NTE-related studies. The Data and Method section describes the conceptual framework, data sources, and methods used to calculate the NTEVI and verify the index. The Results and Findings section presents key findings of index comparisons and correlation analysis. The Discussion and Conclusions section concludes this study by outlining several limitations and future research directions.
Literature review
Origin, definition, and importance of NTE
The term “NTE” originated in Britain in the 1970s, although its birth has also been traced back to a program of cultural events run by the Rome City Council between 1977 and 1985 and in other European countries in the 1970 and 1980s (Bianchini, 1995; Montgomery, 1990). In Britain, the NTE concept was proposed to describe revitalization of the manufacturing-oriented day-time economy in the city center, which was declining due to de-industrialization, by extending operating hours into the evening and night (Chatterton and Hollands, 2002). Since then, the NTE has served as a metric to explain various trends in urban governance and business in post-industrial British cities (Beer, 2011).
No uniform definition of the NTE exists in the literature due to the term’s economic and social dimensions, but consumption activities and related economic opportunities in service-oriented industries (e.g., leisure, tourism, shopping, fitness, culture, and catering) appear to constitute the NTE’s most prominent features (Bianchini, 1995). Economic features of the NTE emphasize activities occurring at night, mainly production and/or consumption behavior in service industries such as leisure, entertainment, and cultural activities (Bianchini, 1995; Montgomery, 1994). McArthur et al. (2019) addressed that the “economy” in the NTE was understood “predominately as constituted by leisure activities provided by cultural, entertainment, and food sectors, that is, the consumption opportunities provided by the economy.” The term’s social characteristics pertain to daily activities and social behavior in a city’s public spaces at night, such as taking a stroll (Mao et al., 2020). Rowe et al. (2008) referred to the NTE as a series of activities and experiences tied to entertainment and night-time socialization, stressing its social aspects. Shaw (2010) described the NTE as including night-time activities associated with urban entertainment and retail provision; this definition focuses more on the term’s economic attributes. On this basis, Beer (2011) added a time limit to the NTE, restricting it to production and consumption activities in hospitality and entertainment that took place between about 6 p.m. and 6 a.m. (i.e., from sunset to sunrise). A definition similar to Beer’s (2011) is adopted in this study: for our purposes, the NTE represents a category of economic activities occurring from 6 p.m. in the evening to 6 a.m. the following morning, including night-time catering, shopping, touring, recreation, accommodation, and fitness. A few studies have distinguished between “the evening economy” and the NTE in terms of time (e.g., the evening economy encompasses 5 p.m.–10 p.m., whereas the NTE applies after 10 p.m.); however, these two concepts have been analyzed holistically in such studies (Thomas and Bromley, 2000; Tiesdell and Slater, 2006). Most NTE-related research has not made such distinction. In general, the NTE is thought to begin when people leave work in the evening (Bianchini, 1995).
NTE development plays a prominent role in urban development and vitality. First, the NTE’s most direct effect is greater night-time use of public and commercial facilities in the city and increased employment opportunities (i.e., by extending the economy’s operating time) (Bianchini, 1995). Second, NTE development promotes the service industry’s expansion and encourages consumption (Heath, 1997). The NTE can thus lead to prosperity in the tourism, leisure, and entertainment industries while fostering the development of complementary sectors, such as the catering, transportation, and retail industries (Hobbs et al., 2005). Third, NTE development boosts a city’s competitiveness and attractiveness. Authorities often adopt active strategies of “re-imagining” and “place marketing” to boost a city’s appeal; doing so can attract external investors, skilled residents, and professionals in addition to boosting the local economy (Hobbs et al., 2005). Fourth, the NTE affords visitors highly diversified consumption choices and increases tourists’ positive experiences (Grazian, 2008). Predictably, if a visitor’s city experience is pleasant and memorable, then they will likely return—either as a tourist or perhaps even a corporate investor (Heath, 1997). Similarly, if local residents find the urban nightlife to be beautiful and interesting, they will be more open to participating in recreational activities after work.
Study topics of NTE research
The NTE has been a topic of clear scholarly interest since the 1990s. As mentioned, most studies have focused on developing NTE-related strategies, policies, and plans on urban governance and the maintenance of order and law (Beer, 2011). NTE research has mainly covered four categories (Yeo and Heng, 2014): (a) development and planning: policy design and planning around urban regeneration and economic development via the NTE (Roberts and Eldridge, 2009; Wolifso and Drozdzewsk, 2017); (b) management and regulation: nightlife regulations and by-laws related to business licenses, crime, disorder, noise, the environment, and safety issues (Hobbs et al., 2003; Philpot et al., 2019; Roberts, 2004); (c) deviance and liminality: analyzing nightlife participants’ behavioral patterns and social phenomena accompanying NTE development from sociological and anthropological perspectives (Hayward and Hobbs, 2007; Hobbs et al., 2000; Monaghan, 2010); and (d) exclusiveness: addressing nightlife barriers such as socio-economic status, age, gender, cultural differences, and religious beliefs (Eldridge, 2010; Hadfield, 2015; Hollands, 2002; Talbot, 2007). Through in-depth observation and hands-on participation, researchers have generally analyzed the NTE as a cultural phenomenon in modern cities through the lenses of anthropology and sociology. Such work is indispensable to a richer understanding and better development of urban NTE; however, studies are also needed to assess the economic and social impacts of urban nightlife and the NTE (Bianchini, 1995). Governments would benefit from quantifiable and comparable economic indicators to provide a scientific basis for policy formulation, resource allocation, and policy evaluation. Enterprises could also use these evaluation indices to make reasonable investment decisions and strategic plans. However, to the best of our knowledge, no empirical studies have yet quantified the NTE’s effects at the county level using multi-source data—presumably due to data availability. In addition, nearly all related studies have investigated the NTE from a Western perspective; little research has considered the NTE in Asian countries/regions (Yeo and Heng, 2014).
The NTE concept has been particularly well-established in European social science research, and American cities have provided popular cases for studying the NTE. Although the NTE of many Chinese first- and second-tier cities, such as Beijing, Shanghai, Chongqing, and Hangzhou, is booming, domestic NTE research did not begin to increase until about 2 years ago (Feng et al., 2020). Compared with international NTE-related studies, the NTE concept is less popular in Chinese urban governance and planning; its assessment is notably absent (Mao et al., 2020). However, as economic development has been affected by the pandemic, the NTE has become a major force behind domestic economic recovery. The local government and enterprises require quantitative and visual indicators of the NTE’s status to inform related decisions and ensure an orderly recovery from COVID-19.
Measurements of NTE
Few variables are readily available to fully measure NTE activities. Gross domestic product (GDP) is the most powerful and popular indicator for assessing regional economic development. Official GDP statistics have suffered from heavy criticism and accusations of intentional data falsification or manipulation (Rawski, 2001), even though it is challenging to capture economic growth in China as effectively as growth in developed countries. As a useful proxy to evaluate economic performance, different from human-produced economic indices, night-time luminosity can be objectively measured and is immune to falsification or misreporting (Chen and Nordhaus, 2011). Among indicators using night-time data, the night light index (e.g., the Night Light Development Index (NLDI) and Night Light Index (NLI) are common proxies of NTE activities (Elvidge et al., 2012; Mellander et al., 2015; Zhong et al., 2018).
In modern society, nearly all economic activities are exposed at night, and light provides the most thorough information on night-time economic performance (Chen and Nordhaus, 2011). The greater the intensity of economic activities, the more obvious the brightness of light. The National Oceanic and Atmospheric Administration’s global night light data (i.e., from the Defense Meteorological Satellite Program-Operation Linescan System) have received great academic attention in recent years (Zhong et al., 2018). These data are based on United States Air Force weather satellite observations from outer space of the brightness of light in different regions on Earth between 8:30 p.m. and 10 p.m., adjusted for accidental effects such as clouds, moonlight, and firelight (Sutto and Costanza, 2002). Scholars have used such data to study economic performance in various countries or regions. Night light data have since been deemed a suitable proxy of a nation’s or area’s current economic indicators. Brighter night-time light was found to be associated with higher GDP, such that satellite observations of light in an area can reveal the region’s degree of economic development (Chen and Nordhaus, 2011; Henderson et al., 2012). Yet night light intensity only provides a generic measure of an area’s economy or NTE, and the results based on stable nights may overestimate the potential contribution of luminosity to measure economic output. Chen and Nordhaus (2011) further concluded that luminosity data can be served as a supplement to standard economic indicators for countries and regions with very poor quality or missing data. Conclusions drawn from this single indicator are correspondingly limited. Understanding the overall status of the NTE is thus a preliminary goal; actionable structural information and knowledge of the NTE are needed to foster this concept’s development.
Influencing factors of NTE development
Illumination and safety
Ongoing enhancements to lighting facilities are fundamental to a vibrant NTE. Over the past 20 years, China’s NTE has developed alongside advances in urban lighting. With adequate lighting, the arrival of night no longer means the cessation of economic activities but the beginning of a new economic pattern (Lovatt & O’Connor, 1995). In addition to maintaining economic activities, night-time lighting can promote individuals’ perceived safety as well as street security (Heath, 1997).
Several empirical studies have shown that the intensity of night-time light partially reflects a country’s/region’s economic development (Chen and Nordhaus, 2011; Doll et al., 2006; Henderson et al., 2012). However, in this study, the goal is not only to construct a single index representing the overall vitality of economic activities at night but also to establish a practice-oriented index to illustrate the NTE’s structure. Considering the close correlation between the vitality of economic activities and electricity consumption, we integrated commercial electricity data to reflect the vitality of each night-time subsector based on the extent of night-time commercial electricity consumption.
Commercial and public facilities
Another tenet of the NTE is the number of commercial and public facilities in the city (Bianchini, 1995). From a supply-side standpoint, a well-lit business area with sufficient night-time commercial and public facilities is more accessible to potential consumers than shops and stores scattered along dark, small streets (Rowe et al., 2008). The number of businesses that stay open at night was thus included in our index system as an indicator of the NTE’s supply capacity.
Diversity
In the NTE-related literature, NTE promotion is intended to cultivate various night-time attractions (Chatterton and Hollands, 2002). A basic ingredient of a successful NTE is the presence of people—ideally of different ages, occupations, and places of origin (Rowe et al., 2008). A diversified NTE brings together several population segments, thereby enhancing the city’s vitality. Even people who are unaccustomed to going out at night are likely to participate in NTE activities when an array of products and services are offered.
Policy environment
The prosperity of urban NTE cannot be separated from relevant government policies (Roberts and Eldridge, 2009); restaurants, bars and clubs, parks, and other night-time recreational venues are not allowed to stay open until late at night without government permits. Night-time electricity supply, public transport, urban security, and environmental protection, all of which are necessary to ensure NTE maintenance, are also dependent on governmental management and regulations (Hobbs et al., 2003). In the index system proposed in this study, we introduced a series of indicators measuring NTE vitality after 10 p.m. to reflect the strength of policy support and late-night economic vitality.
Consumer satisfaction
Consumer satisfaction is a fundamental qualitative indicator from the demand side which is vitally important in understanding consumers’ preferences, experiences, and repeat purchases; this indicator directly leads to greater profitability and growth (Dupeyras and MacCallum, 2013). The NTE has seen a shift from selling products to offering a range of diversified services and lifestyles. The physical and tangible elements of nightlife products and services have also become increasingly distinct based on their intangible qualities (i.e., esthetic and emotional elements) in branding (Hollands and Chatterton, 2003). NTE development will be unsustainable if local residents and tourists have unsatisfactory experiences (Mao et al., 2020). In other words, residents’ and visitors’ satisfaction is essential to determining whether the NTE can continue to grow. If tourists are satisfied with their trips to the city, they will be more likely to come back; if the locals enjoy themselves in the city at night, they will be more willing to venture out at night with their family and friends (Heath, 1997). More importantly, the city will be freely and widely marketed through satisfied patrons’ word-of-mouth, which should attract more people to the city to enjoy the night there (Talbot, 2007).
An understanding of destination competitiveness is rooted in the notions of comparative advantages and price competitiveness (Dwyer et al., 2000) as well as productivity (Cracolici et al., 2008). However, scholars have also started to consider quality-related factors, including non-price components of the regional economy (e.g., consumer experiences and satisfaction) and quality of life (or well-being), as determinants of competitiveness (Dupeyras and MacCallum, 2013). For example, Dmitrović et al. (2009) proposed a conceptual model of tourist satisfaction at the destination level as a basis for the ongoing monitoring and improvement of destination competitiveness. More recently, Guizzardi and Mariani (2021) developed a Dynamic Destination Satisfaction Matrix to monitor tourist satisfaction at the country level over time (i.e., longitudinally). This matrix revealed how tourist satisfaction can translate into enhanced destination competitiveness.
Social media represents a key information source influencing consumers’ decision making in the digital era. Consumer feedback is vital to gain insight into consumer satisfaction and the competitiveness of the visitor economy. This information can guide future decisions by reflecting the likelihood of repeated purchases, designing effective promotions, and improving future destination competitiveness to generate economic benefits (Dupeyras and MacCallum, 2013). In essence, growing competitiveness implies rising prosperity or vitality. Given the importance of consumer satisfaction, data on online review ratings of each night-time subsector were included in our index system to evaluate NTE vitality from subjective perspectives.
Economic performance, tourism development, and NTE
Academic publications suggest that the NTE is present in many economically developed countries or regions, especially densely populated urban areas with empty manufacturing plants or abandoned industrial waterfronts. These countries or regions leverage the NTE as a post-industrial regeneration strategy to stimulate consumption and keep urban centers vibrant at night, which drives economic growth (Heath, 1997). In addition, tertiary industries such as leisure, tourism, shopping, fitness, culture, catering, and so on represent the NTE’s most prominent features (Hollands and Chatterton, 2003). Because the NTE covers almost all tertiary industries, in an economy whose service sector is a strong contributor to economic growth, the NTE is expected to be better developed and vice versa (Hobbs et al., 2005).
In tourism studies, the relationship between economic growth and tourism development has been discussed at length. Most studies suggest that tourism sector development and local economic growth are mutually reinforcing (Lin et al., 2019). Given the positive correlation between tourism and the economy, it is expected that NTE development will foster tourism development and vice versa. Local citizens and non-local tourists are the main NTE consumption bodies. Through organizing cultural events and festivals, night walks, night light shows, and attractions, the tourism sector enlivens night-time consumption by providing local citizens and tourists various products and services that capture a city’s charm and character; these offerings can boost local consumption, investment, and exports (Heath, 1997). Conversely, NTE development can encourage tourism by attracting tourists, visitors, and different segments of the local population to experience urban nightlife (Grazian, 2008) and by promoting tourism-adjacent industries such as catering, accommodation, and transportation (Hobbs et al., 2005).
Data and method
Study area
Zhejiang Province was chosen as a case study due to its economic standing as one of the most vigorous and promising areas of China’s economy. The province also has a unique geographical advantage through bridging the country’s east and west and linking the south and north (see Figure 1). Located in the southern part of the Yangtze River Delta, Zhejiang Province is one of China’s smallest but most densely populated provinces: it covers 104,175 km2, accounting for 1.09% of land in China, and was home to 58.5 million residents in 2019 (4.18% of China’s population)—the 10th highest proportion among the country’s 31 provinces and municipalities (WIND, 2021). Location of study area.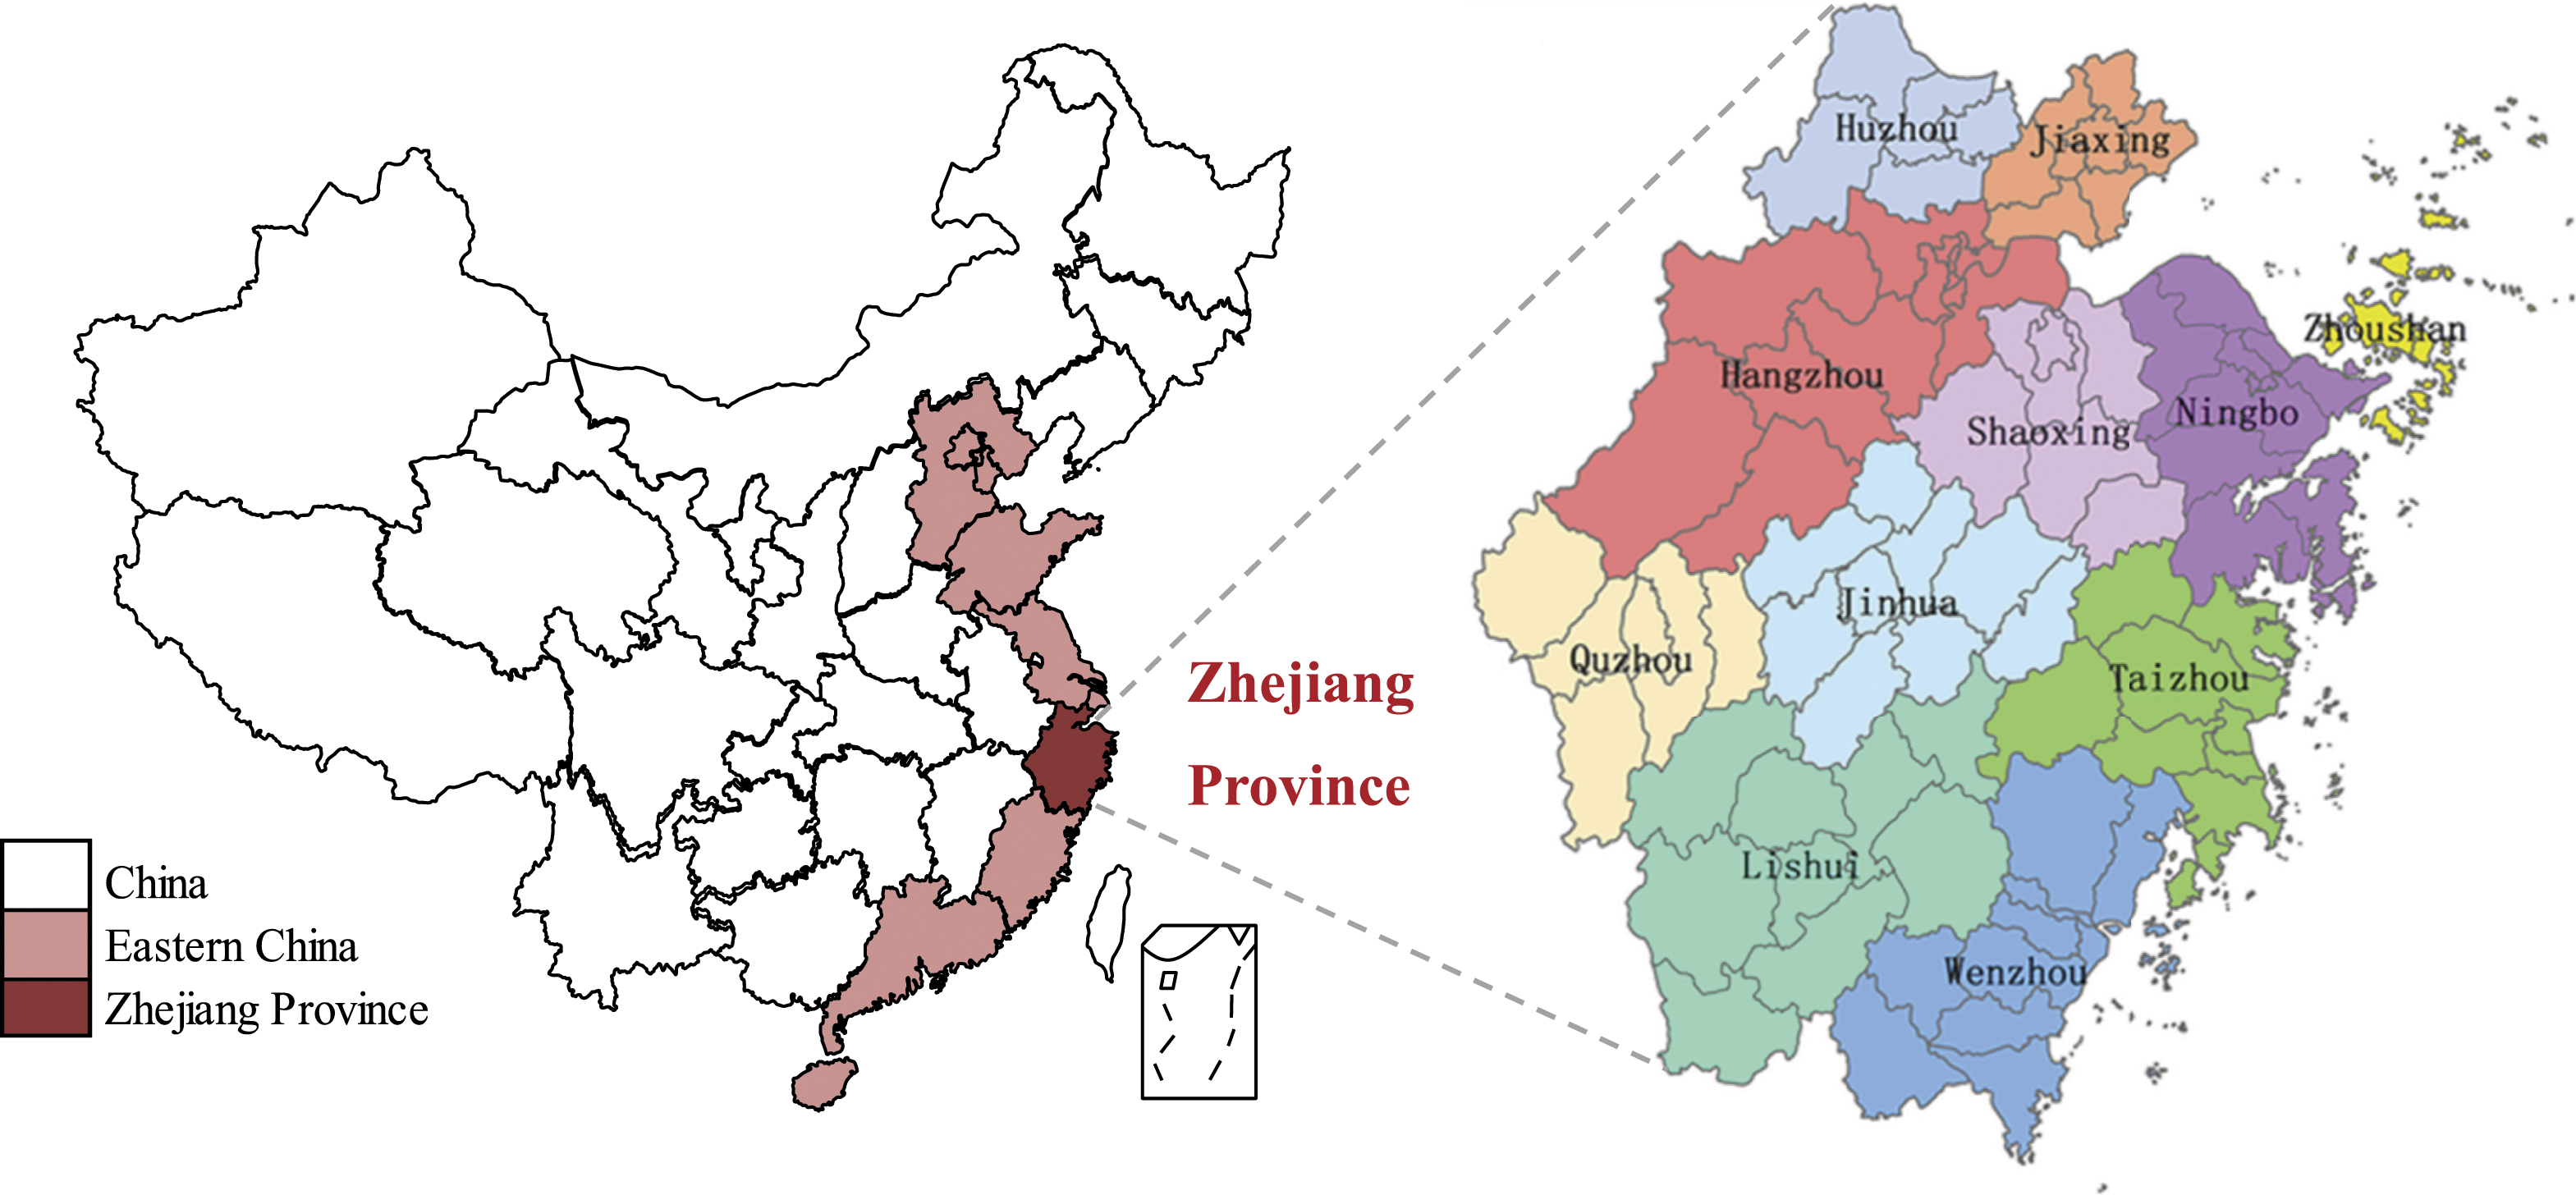
As a pioneer in China’s reform and opening-up, Zhejiang Province has followed a fast track of economic growth throughout the past four decades. Its GDP jumped from 12.37 billion yuan (US$7.35 billion) in 1978 to 6.46 trillion yuan (US$936.58 billion) in 2020, and the province has remained the fourth richest in China for 27 consecutive years since 1994 (WIND, 2021). Urban residents’ per capita disposable income skyrocketed from 332 yuan (US$197.20) in 1978 to 60,182 yuan (US$8723.93) in 2019, consistently the third highest among all Chinese provinces (regions) since 2001 (WIND, 2021). Zhejiang Province consists of 11 prefecture-level cities (including the sub-provincial cities of Hangzhou and Ningbo) and 90 county-level municipalities. In addition, Hangzhou, the provincial capital, is the headquarters of e-commerce giant Alibaba Group—the largest mobile payment provider in the world. This province’s digitalized working and living environment thus provides inherently representative consumption behavior data.
Data sources and pre-processing
We integrated several data sources to construct a multi-source time series dataset (spanning January 2019–December 2020) to calculate and examine the proposed NTEVI: (1) consumption-based transaction data from M company, one of China’s top online-to-offline platforms for life services; (2) monthly data on night-time electricity consumption in commercial sectors, gathered from a state-run electric power company in Zhejiang Province; and (3) annual official socio-economic statistics (e.g., population data, number of hotels and attractions) from WIND (2021). The consumption dataset included millions of hourly transaction records from M company, providing detailed information on each transaction’s location, date and time, amount of consumption, number of purchase orders and consumers, payment channel (online vs. offline), consumption category (e.g., catering, shopping, touring, recreation, accommodation, and fitness), number of suppliers, opening time of suppliers, and consumer ratings. Hourly online and offline consumption-based transaction data were first aggregated into monthly data and then combined with monthly electricity consumption data and annual socio-demographic data across consumption categories at the county, city, and provincial levels. Lastly, a multi-source time series dataset from January 2019 to December 2020 containing all the NTE indicators measured from the supply and demand sides of 90 counties and 11 cities in Zhejiang Province was generated. As recommended by OECD and the Joint Research Centre of the European Commission (JRCEC (2008), statistical coherence, defined as “the adequacy of the data to be reliably combined in different ways and for various uses” (p. 45), is vital when building composite indicators. We also verified the statistical definitions, concepts, classifications, and calculation methodology of all data to ensure they were consistent throughout the selected time periods and across counties and regions.
Methods
Conceptual framework of the NTEVI
Given a relative lack of empirical evidence to assess NTE vitality, it was challenging to design a credible and legitimate multi-dimensional index system to enable transparent comparisons across counties and cities based on existing data. We therefore established a set of core principles to outline the NTEVI parameters. First, we aimed to make the NTEVI intuitive and easy to understand for governmental decision makers. Second, we intended for the NTEVI to be comparable across counties and cities by minimizing the inclusion of indicators with different meanings across counties and by highlighting existing non-cooperabilities. Third, NTEVI comparisons were intended to be robust to a range of weights.
Following the definitions, components, and space types of the NTE explored in a set of studies including Chatterton and Hollands (2002), Hollands and Chatterton (2003), Rowe et al. (2008), Shaw (2010), Beer (2011), and McArthur et al. (2019), six service sectors (i.e., night-time catering, shopping, touring, recreation, accommodation, and fitness) were selected based on data availability. Nightlife and a host of popular cultural activities have often been promoted through the idea of a 24 hour city since the 1980s; as a result, many public subsidies and public–private partnerships have emerged to foster entertainment, cultural, and night-time facilities (Hollands and Chatterton, 2003). Essentially, more active supply (production) leads to more active demand (consumption) and vice versa. Chatterton and Hollands (2002) proposed a theoretical framework that described a dominant mode of mainstream urban nightlife as a combination of three interrelated aspects of production, regulation, and consumption in the NTE. Our previous review of the literature also shows that consumer satisfaction is an important factor influencing the NTE’s sustainable development. Thus, this study developed indicators based on three dimensions: the supply (production) and demand (consumption) of entertainment, popular cultural and nightlife activities, and consumer satisfaction. The regulation component as included in Chatterton and Hollands’s (2002) proposed framework was ignored due to data availability.
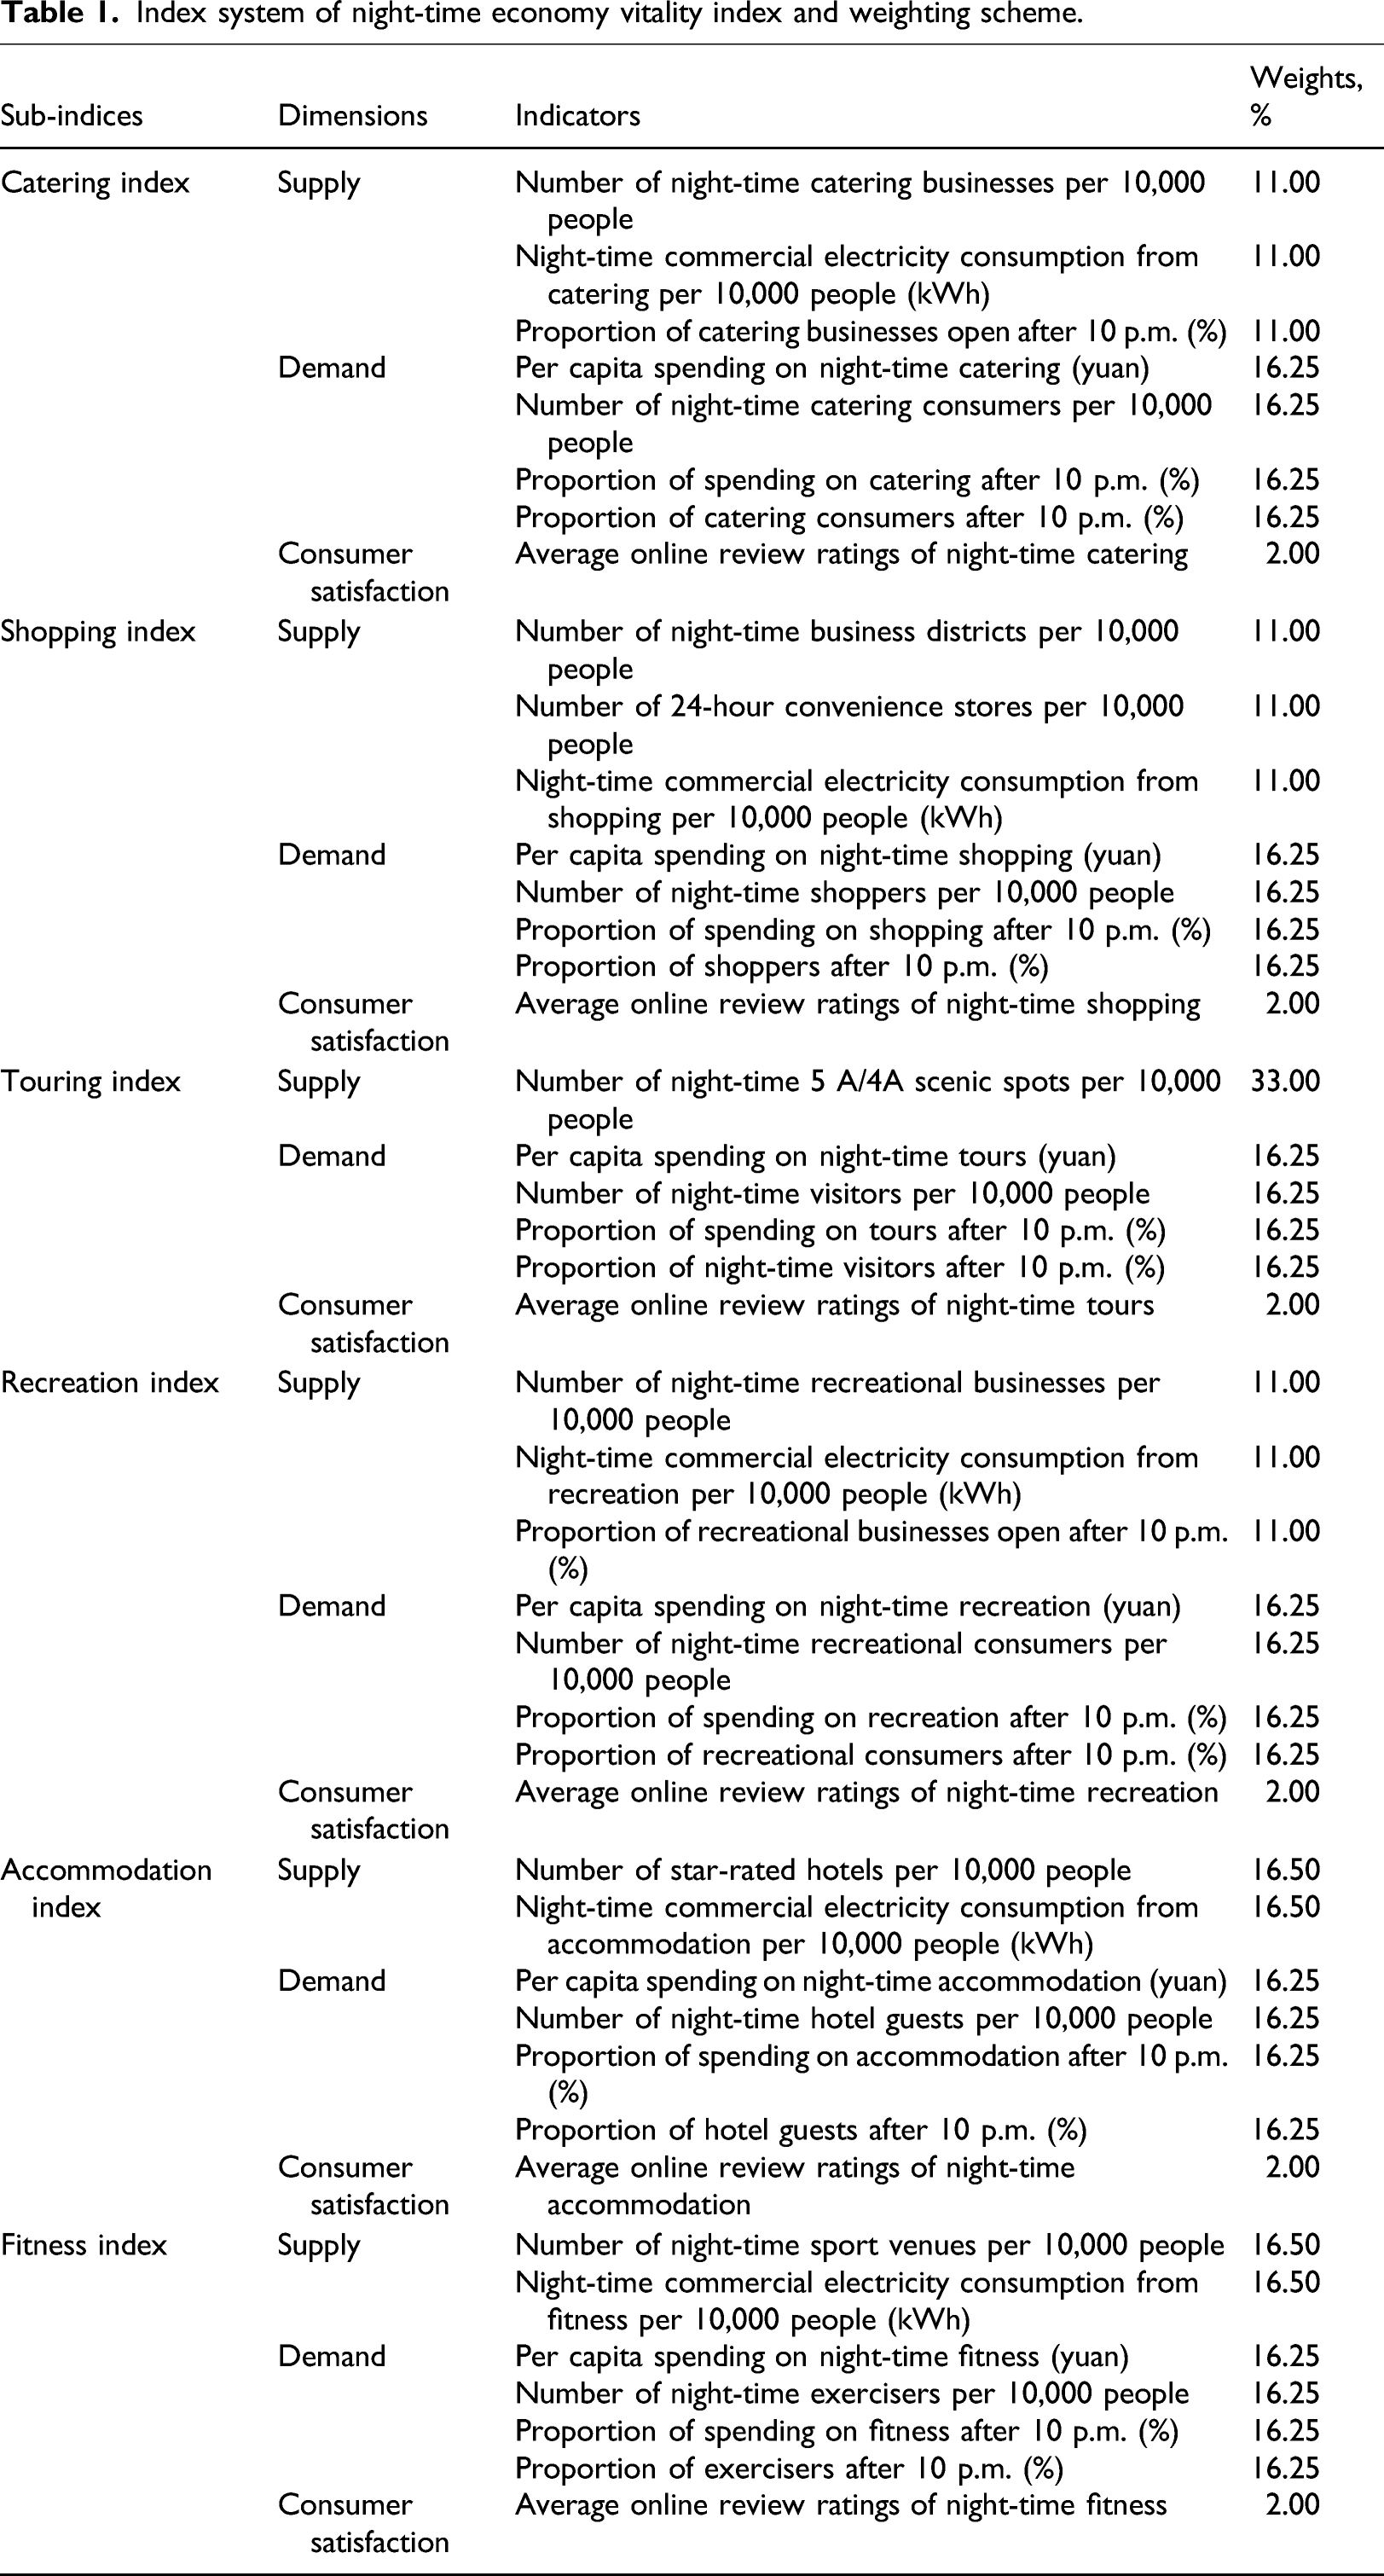
Figure 2 presents the theoretical framework of our index system. The NTEVI should reflect the vitality of the overall NTE as well as its subsectors at the county, city, and provincial levels. The NTEVI includes six sub-indices: a catering vitality index, shopping vitality index, touring vitality index, recreation vitality index, accommodation vitality index, and fitness vitality index (see Table 1). Each sub-index is composed of three sub-dimensions, namely supply, demand, and consumer satisfaction. Average online review ratings of individual sectors, scored on a scale of 1–5, are used to measure consumers’ satisfaction. The individual indicators within each sub-index were selected based on their relevance, analytical soundness, timeliness, and accessibility according to the NTE’s definitions, nature, and influencing factors. As the NTE is demand-driven, indicator selection was consumption-oriented. Supply- and demand-side indicators were pairwise selected in most cases. For instance, the number of catering businesses corresponded to the number of catering consumers. To ensure an objective and accurate comparison across small and large counties/cities, we used residents’ population as a tool to scale indicators. For example, we referred to the “number of night-time catering businesses per 10 000 people” rather than the “number of night-time catering businesses.” We applied a ratio scale to eliminate the effects of measurement units (i.e., the proportion of spending was calculated instead of an absolute number). Conceptual framework of night-time economy vitality index. Index system of night-time economy vitality index and weighting scheme.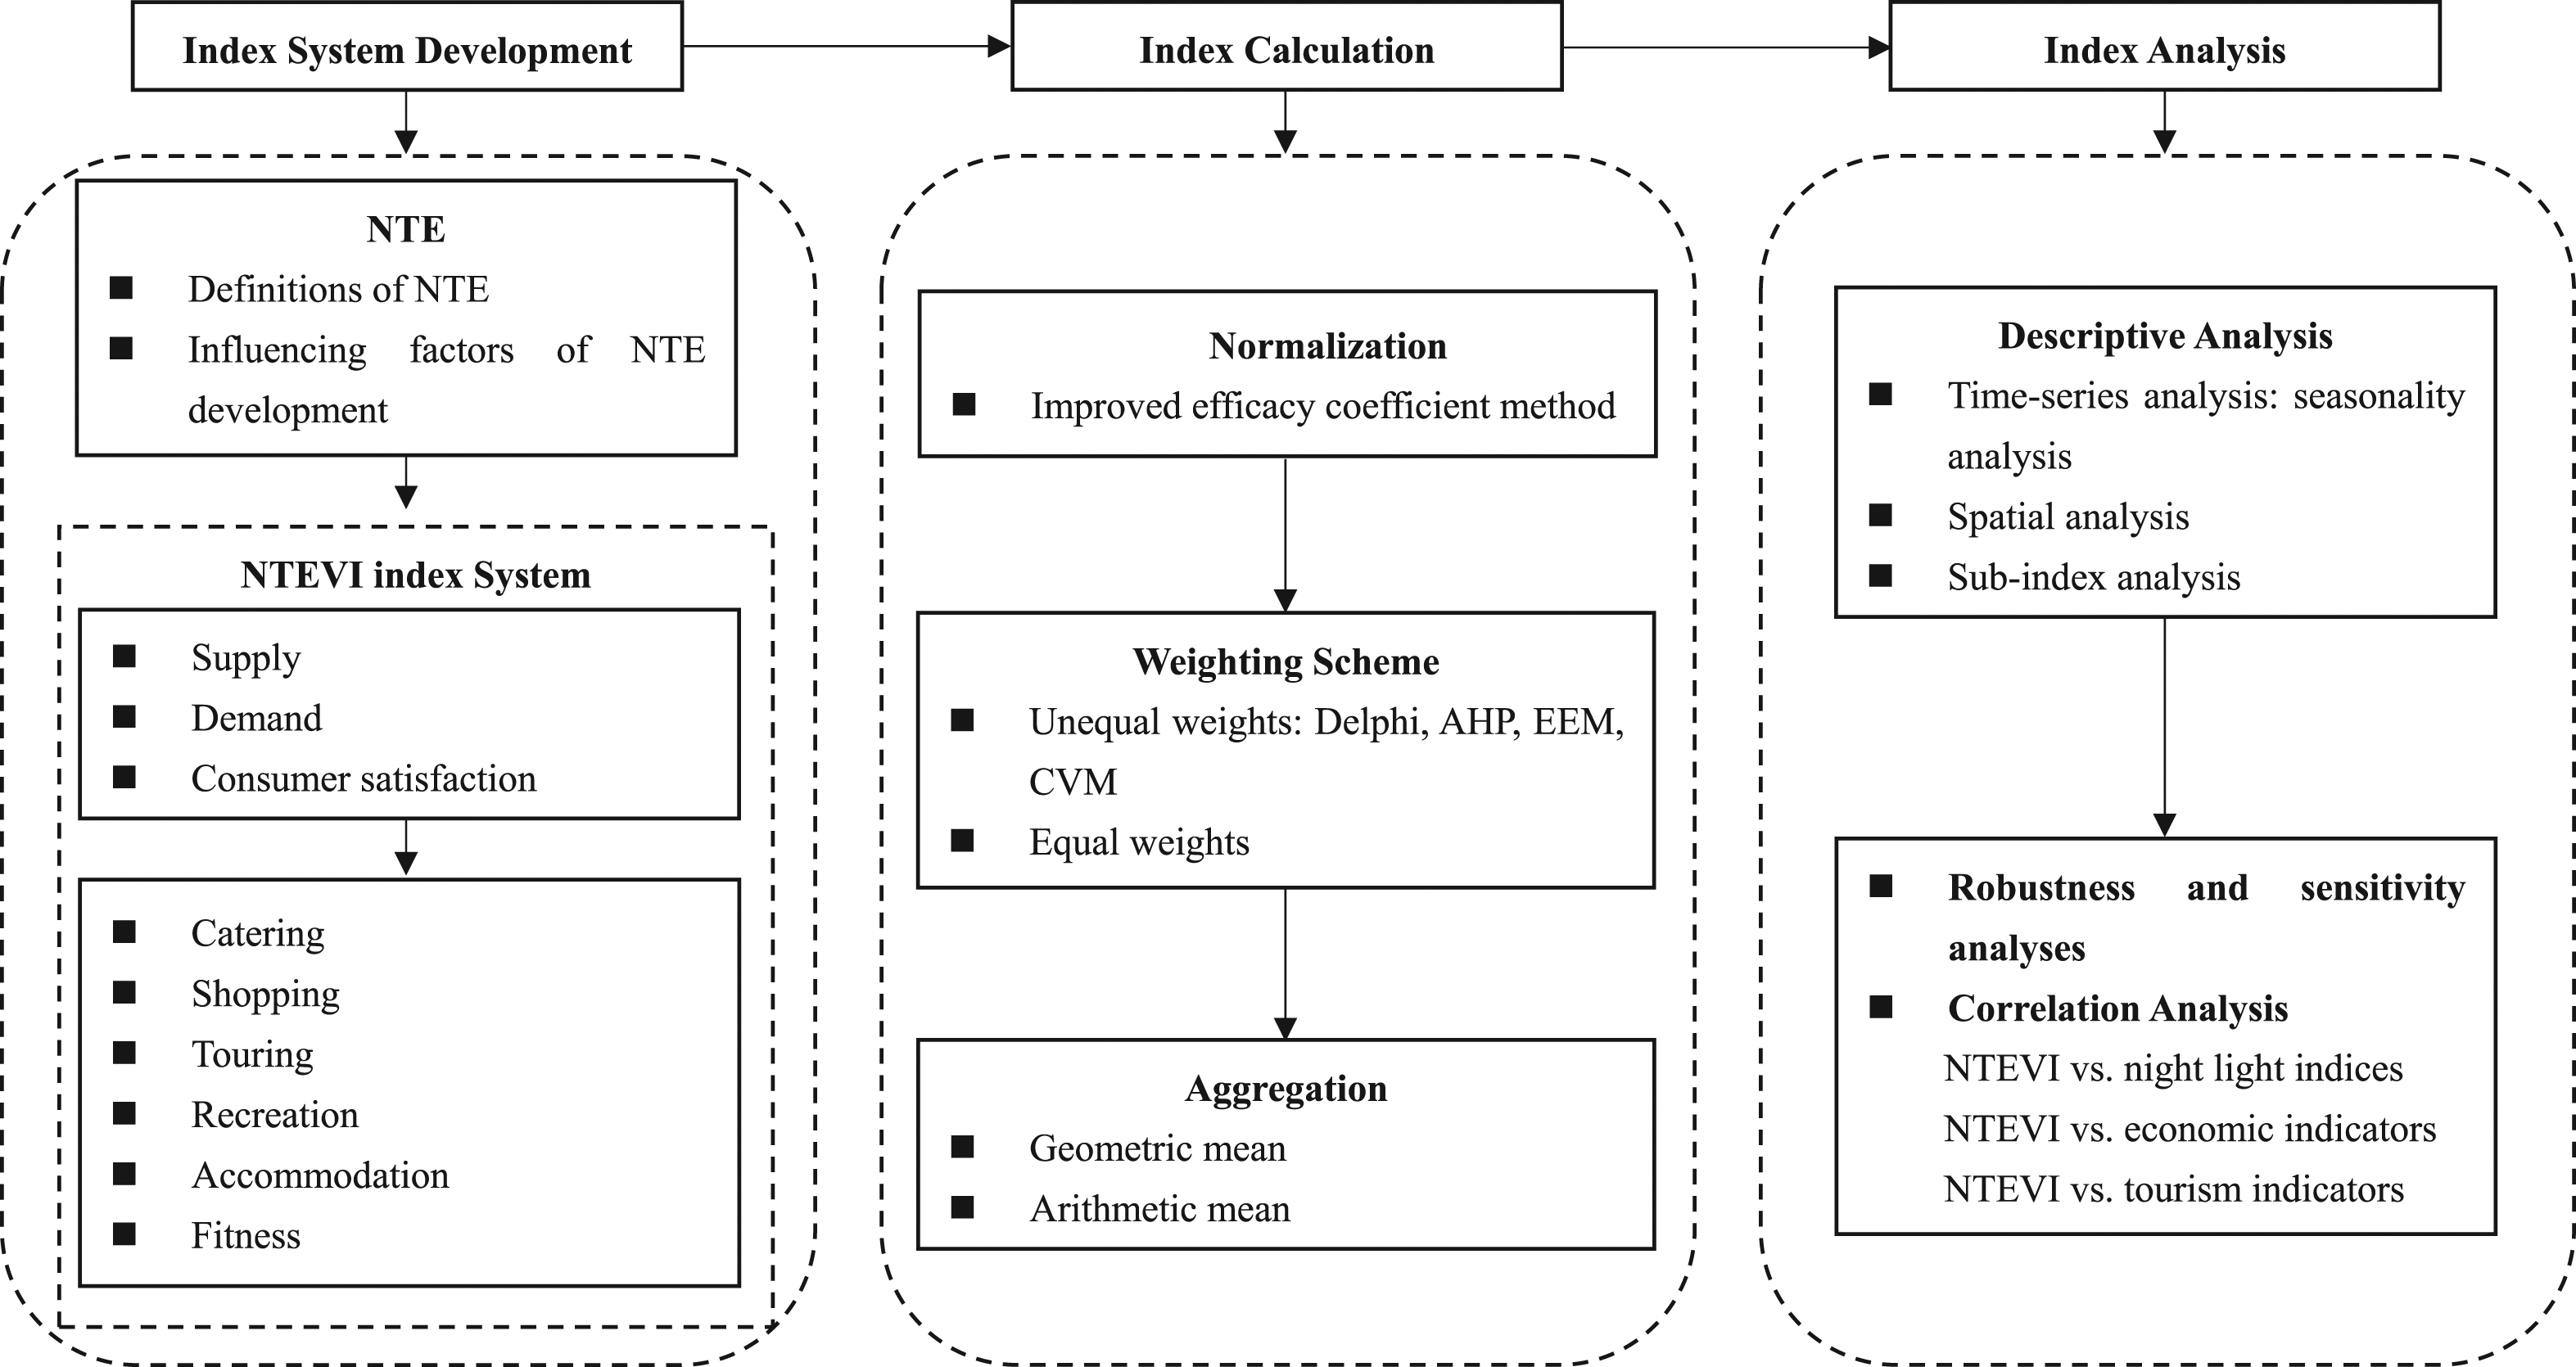
A mixed weighting approach combining subjective and objective weighting methods was adopted to determine the index weighting scheme. Index robustness was tested and evaluated using equal (simple average) and unequal (weighted average weighted average with Delphi-based weighting scheme) weighting schemes and aggregating methods and different aggregating methods (geometric mean and arithmetic mean). Index reliability was assessed based on a series of economic-related night light indices, economic performance and tourism development indicators, and the index’s consistency with trends during the COVID-19 pandemic.
The NTEVI is a summary measure of achievements in six typical service sectors of night-time economic development: catering, shopping, recreation, accommodation, touring, and fitness. Evaluations and comparisons of the NTEVI across different levels of administrative areas before, during, and after the COVID-19 outbreak were conducted to understand the pandemic’s impact and to describe Zhejiang Province’s path to economic recovery. This index system consisted of six sub-indices, 18 dimensions, and 44 individual indicators at the county, city, and provincial levels, respectively (see Table 1). The list of indicators was limited in order to be practical and also restricted by data availability.
When multiple measured variables (or indicators) are used to overcome measurement error by multivariable measurement, mild multicollinearity is not a problem (Hair et al., 2019). Field (2017) suggested eliminating variables that correlate very highly (r > 0.8). However, OECD and Joint Research Centre of the European Commission (2008) pointed out that “correlations do not necessarily represent the real influence of the individual indicators on the phenomenon being measured” (p. 26). An alternative way to investigate the degree of correlation among a set of variables is to use Cronbach’s alpha coefficient, which is the most common estimate of the internal consistency of multiple items (Hair et al., 2019). We thus carried out correlation analysis and reliability tests to assess the degree of consistency between multiple indicators of a sub-index. Correlation analysis of indicators in each sub-index showed that the coefficients were all below 0.80, with most being lower than 0.5 (see Supplementary Appendix Table C1 of Online Appendix C). Cronbach’s alpha coefficients for each sub-index at the county-level were 0.73, 0.66, 0.72, 0.80, 0.73, and 0.66, respectively, for the catering, shopping, touring, recreation, accommodation, and fitness sectors. A generally accepted lower limit for Cronbach’s alpha is 0.7, although values between 0.6 and 0.7 are considered acceptable in exploratory research (Hair et al., 2017). Thus, the indicators included in each sub-index in our study were not highly correlated and had a reasonably acceptable internal consistency, making them suitable for further analysis.
Normalization and weighting scheme
We followed data pre-processing practices similar to those applied for the Global Competitiveness Index (World Economic Forum, 2020), World Digital Competitiveness Ranking (Institute for Management Development, 2020), and Human Development Index (United Nations Development Programme, 2020). Then, the improved efficacy coefficient method shown in Equation (1) was applied to standardize indicators in Table 1 at the county, city, and provincial levels, respectively, to eliminate the influences of dimensionality and magnitude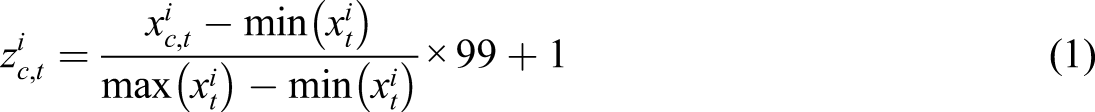
The weights of individual indicators can be determined using subjective weighting methods (e.g., the Delphi method and analytic hierarchy process (AHP) and objective weighting methods (e.g., the coefficient of variation method (CVM), entropy evaluation method (EEM), and principal component analysis (PCA) (Yin et al., 2017). A combination of subjective and objective weighting methods can retain experts’ experience while maintaining objectivity to avoid subjective randomness (Xu, 2004). Thus, we adopted a three-stage procedure that combined subjective and objective weighting methods. First, the Delphi method, which can effectively incorporate a panel of experts’ knowledge and expertise, was applied to determine the weights of three dimensions for each subsector. The Delphi method, also known as the expert survey method, can be applied to subjectively select and assign indicators based on each indicator’s importance, impact, and performance as well as the quality and characteristics of the data (Lin and Song, 2015). In this study, the importance of dimensions including supply factors, demand factors, and consumer satisfaction was first independently evaluated by 10 academic and industry experts. A follow-up focus group was convened to reach expert agreement. A total weight of 33% was ultimately assigned to the dimension of supply vitality; the remaining 65% was assigned to demand vitality with 2% to consumer satisfaction. Following the approach used to calculate the Global Competitiveness Index (World Economic Forum, 2020), equal weights were assigned to individual indicators within the demand, supply, and consumer satisfaction component of each sub-index, respectively. The above procedure entailed the Delphi-based weighting method and was applied to the six sub-indices (see Table 1). Second, we selected an appropriate weighting scheme by comparing the calculation results of four schemes: AHP, CVM, EEM, and the Delphi-based weighting method. The index calculation results for AHP, CVM, and EEM were compared with the Delphi-based weights to verify the robustness of the proposed index system. Detailed comparisons appear in Appendix A, which also describes the weight selection and aggregation process. The Delphi-based weighting scheme returned similar index results to AHP and was ultimately chosen to assign weights to individual indicators given its simplicity and ease of use and replication.
Aggregation
Following the computation approach used for the Human Development Index (United Nations Development Programme, 2020) and Yang et al. (2020a), Yang et al. (2020b), we first calculated the sub-indices (i.e., sub-NTEVI) of six key NTE subsectors using Equation (2)

Robustness and sensitivity analyses
As advised by OECD and JRCEC (2008), robustness and sensitivity analyses should be performed to evaluate the robustness of composite indicators and to minimize the risk of producing a meaningless index. This analysis calls for choosing individual indicators, normalizing data and applying weighting schemes, dealing with missing data, and conducting aggregation (OECD and JRCEC, 2008). These steps collectively improve the accuracy, credibility, and interpretability of the final results. To lessen the risk of misinterpreting and misusing the proposed index, it was important to carry out sensitivity checks to distinguish between significant and insignificant differences, particularly given public and media interest in the ranking results (OECD and JRCEC, 2008). We therefore carried out a set of sensitivity and robustness analyses. First, the overall index was calculated using two aggregation methods: arithmetic mean and geometric mean (see Supplementary Appendix B). Second, the overall index was computed using two weighting schemes: equal weights (simple average) and unequal weights (weighted average with Delphi-based weighting scheme). By applying the equal weighting scheme, the weight of 0.125 was assigned to individual indicators when calculating the catering index; the same weighting scheme was applied to the remaining sub-indices. Based on the correlation analyses in Supplementary Appendix Table B1 of Online Appendix B and practical interpretation of our index results, the geometric mean aggregation of sub-indices and weighted average approach were adopted. Third, we compared the NTEVI with other established measures of economic performance to assess our index’s capacity to produce meaningful and relevant results (OECD & JRCEC, 2008). The relevance and interpretability of index results can be strongly reinforced by such a comparison. Fourth, government stakeholders assessed our index results to determine the extent to which findings reflected true NTE performance in individual cities and counties. A testimonial letter from the Department of Commerce of Zhejiang Province acknowledged our work as “gaining a keener understanding of the characteristics and dynamic changes of NTE” and “providing strong support for smarter policies and effectively promoting the development of local NTE in our province.” The general credibility and robustness of our index methodology was further verified through correlation analysis between the NTEVI and reference indicators (i.e., night light indices, economic indicators, and tourism demand measures). High correlations between the NTEVI and reference indicators demonstrated the index’s capacity to produce credible results.
Correlation analysis
Correlation analysis involved the NTEVI and relevant published economic and tourism-related indicators. We chose several types of variables for further analysis: (1) night light indices (i.e., the NLDI and NLI); (2) six traditional economic performance metrics, including GDP, GDP of the tertiary industry (TGDP), GDP per capita (PGDP), total retail sales of social consumption (TRSSC), per capita disposable income of urban residents (PDI_U), and per capita disposable income of rural residents (PDI_R); (3) night-time commercial electricity consumption (NTEC); and (4) four common measures of tourism development, namely inbound tourist arrivals (ITA), international tourism revenue (ITR), domestic tourism arrivals (DTA), and domestic tourism revenue (DTR). Related data for 2019–2020 were obtained from WIND (2021).
Results and findings
Overall NTEVI of Zhejiang Province
Figure 3 depicts the monthly trend of the NTEVI in Zhejiang Province for the years 2019 and 2020. Seasonality was observed in the 2019 provincial-level NTEVI: the summer period (June, July, and August) recorded the highest average score of 49.2, representing the peak season for night-time activities; and the winter period (December, January, and February) reported the lowest score of 43.8, as it was the low season for night-time activities. In 2019, the province’s average NTEVI (based on a sample of 90 counties) was lowest in February during the Chinese New Year period, a popular time for family reunions. The overall NTEVI climbed quickly and peaked in August but declined thereafter. Taking the city of Hangzhou as an example, the correlation coefficients of Hangzhou’s monthly average daily highest temperature and monthly average daily lowest temperature with its NTEVI in 2019 were 0.746 (p (one-tailed < 0.01) and 0.693 (p (one-tailed < 0.01), respectively, suggesting a strong pattern of seasonality. Monthly trend of night-time economy vitality index in Zhejiang Province.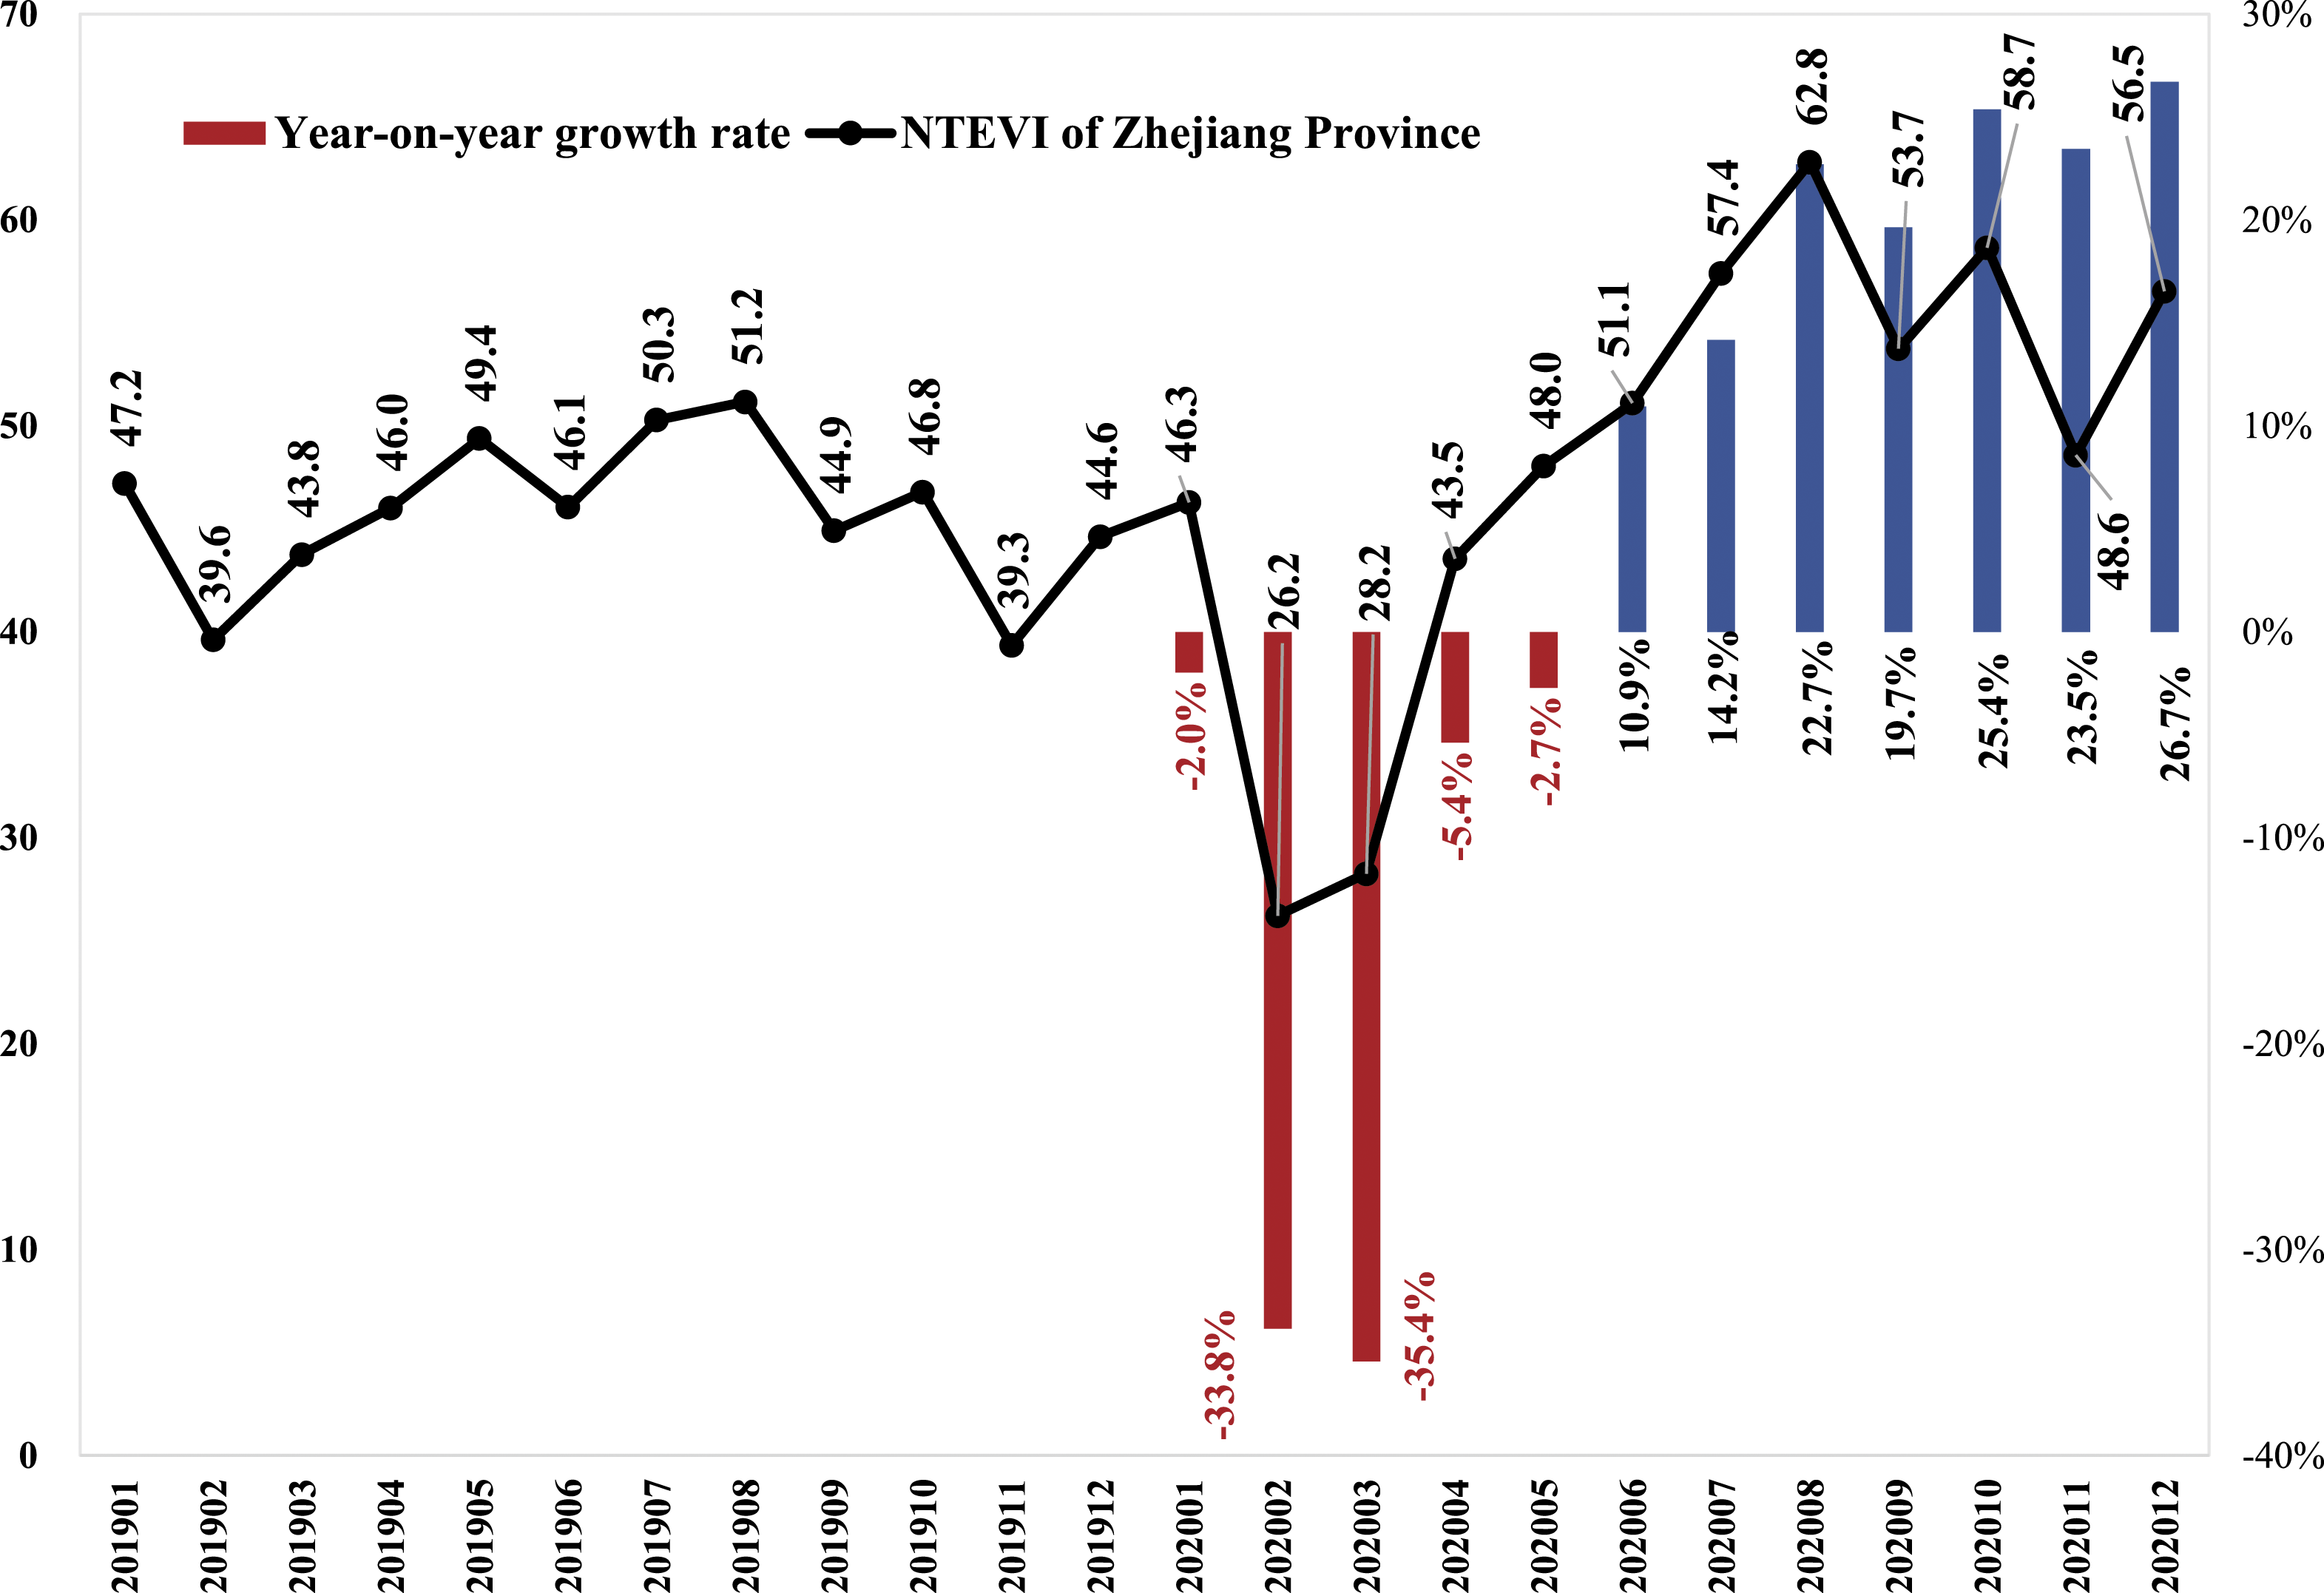
The unprecedented COVID-19 pandemic made 2020 a challenging year for many. The NTEVI was brought to a halt in late January 2020 as residents celebrated the Chinese New Year holiday. Figure 3 shows a clear V-shaped pattern for the NTEVI across the year 2020. A sharp decline occurred in February 2020, revealing a 33.8% drop compared with the same month in 2019. The central and local governments’ effective control of the COVID-19 outbreak allowed Zhejiang Province’s NTE to recover quickly from the pandemic-related recession. Positive NTEVI scores with double-digit year-to-year growth were reported from June 2020 onwards, implying that the adverse effects of COVID-19 on the NTE were short-lived.
Comparisons across service sectors
In this study, each of the six sub-indices was scored using a comparable scale of 1–100. Essentially, the higher the average sub-index score, the higher the calculated level of night-time economic vitality for that sector. Similar to the overall NTEVI at the provincial level, a V-shaped pattern was identified across the six sectors (see Figure 4) due to the devastating impact of COVID-19: February 2020 saw the lowest scores for the catering, accommodation, shopping, and recreation sectors, while March 2020 received the lowest scores for the touring and fitness sectors. The 2019 scores also reflected high seasonality across the six service sectors at the county and city levels. Monthly trends of six sub-indices of night-time economy vitality index in Zhejiang Province.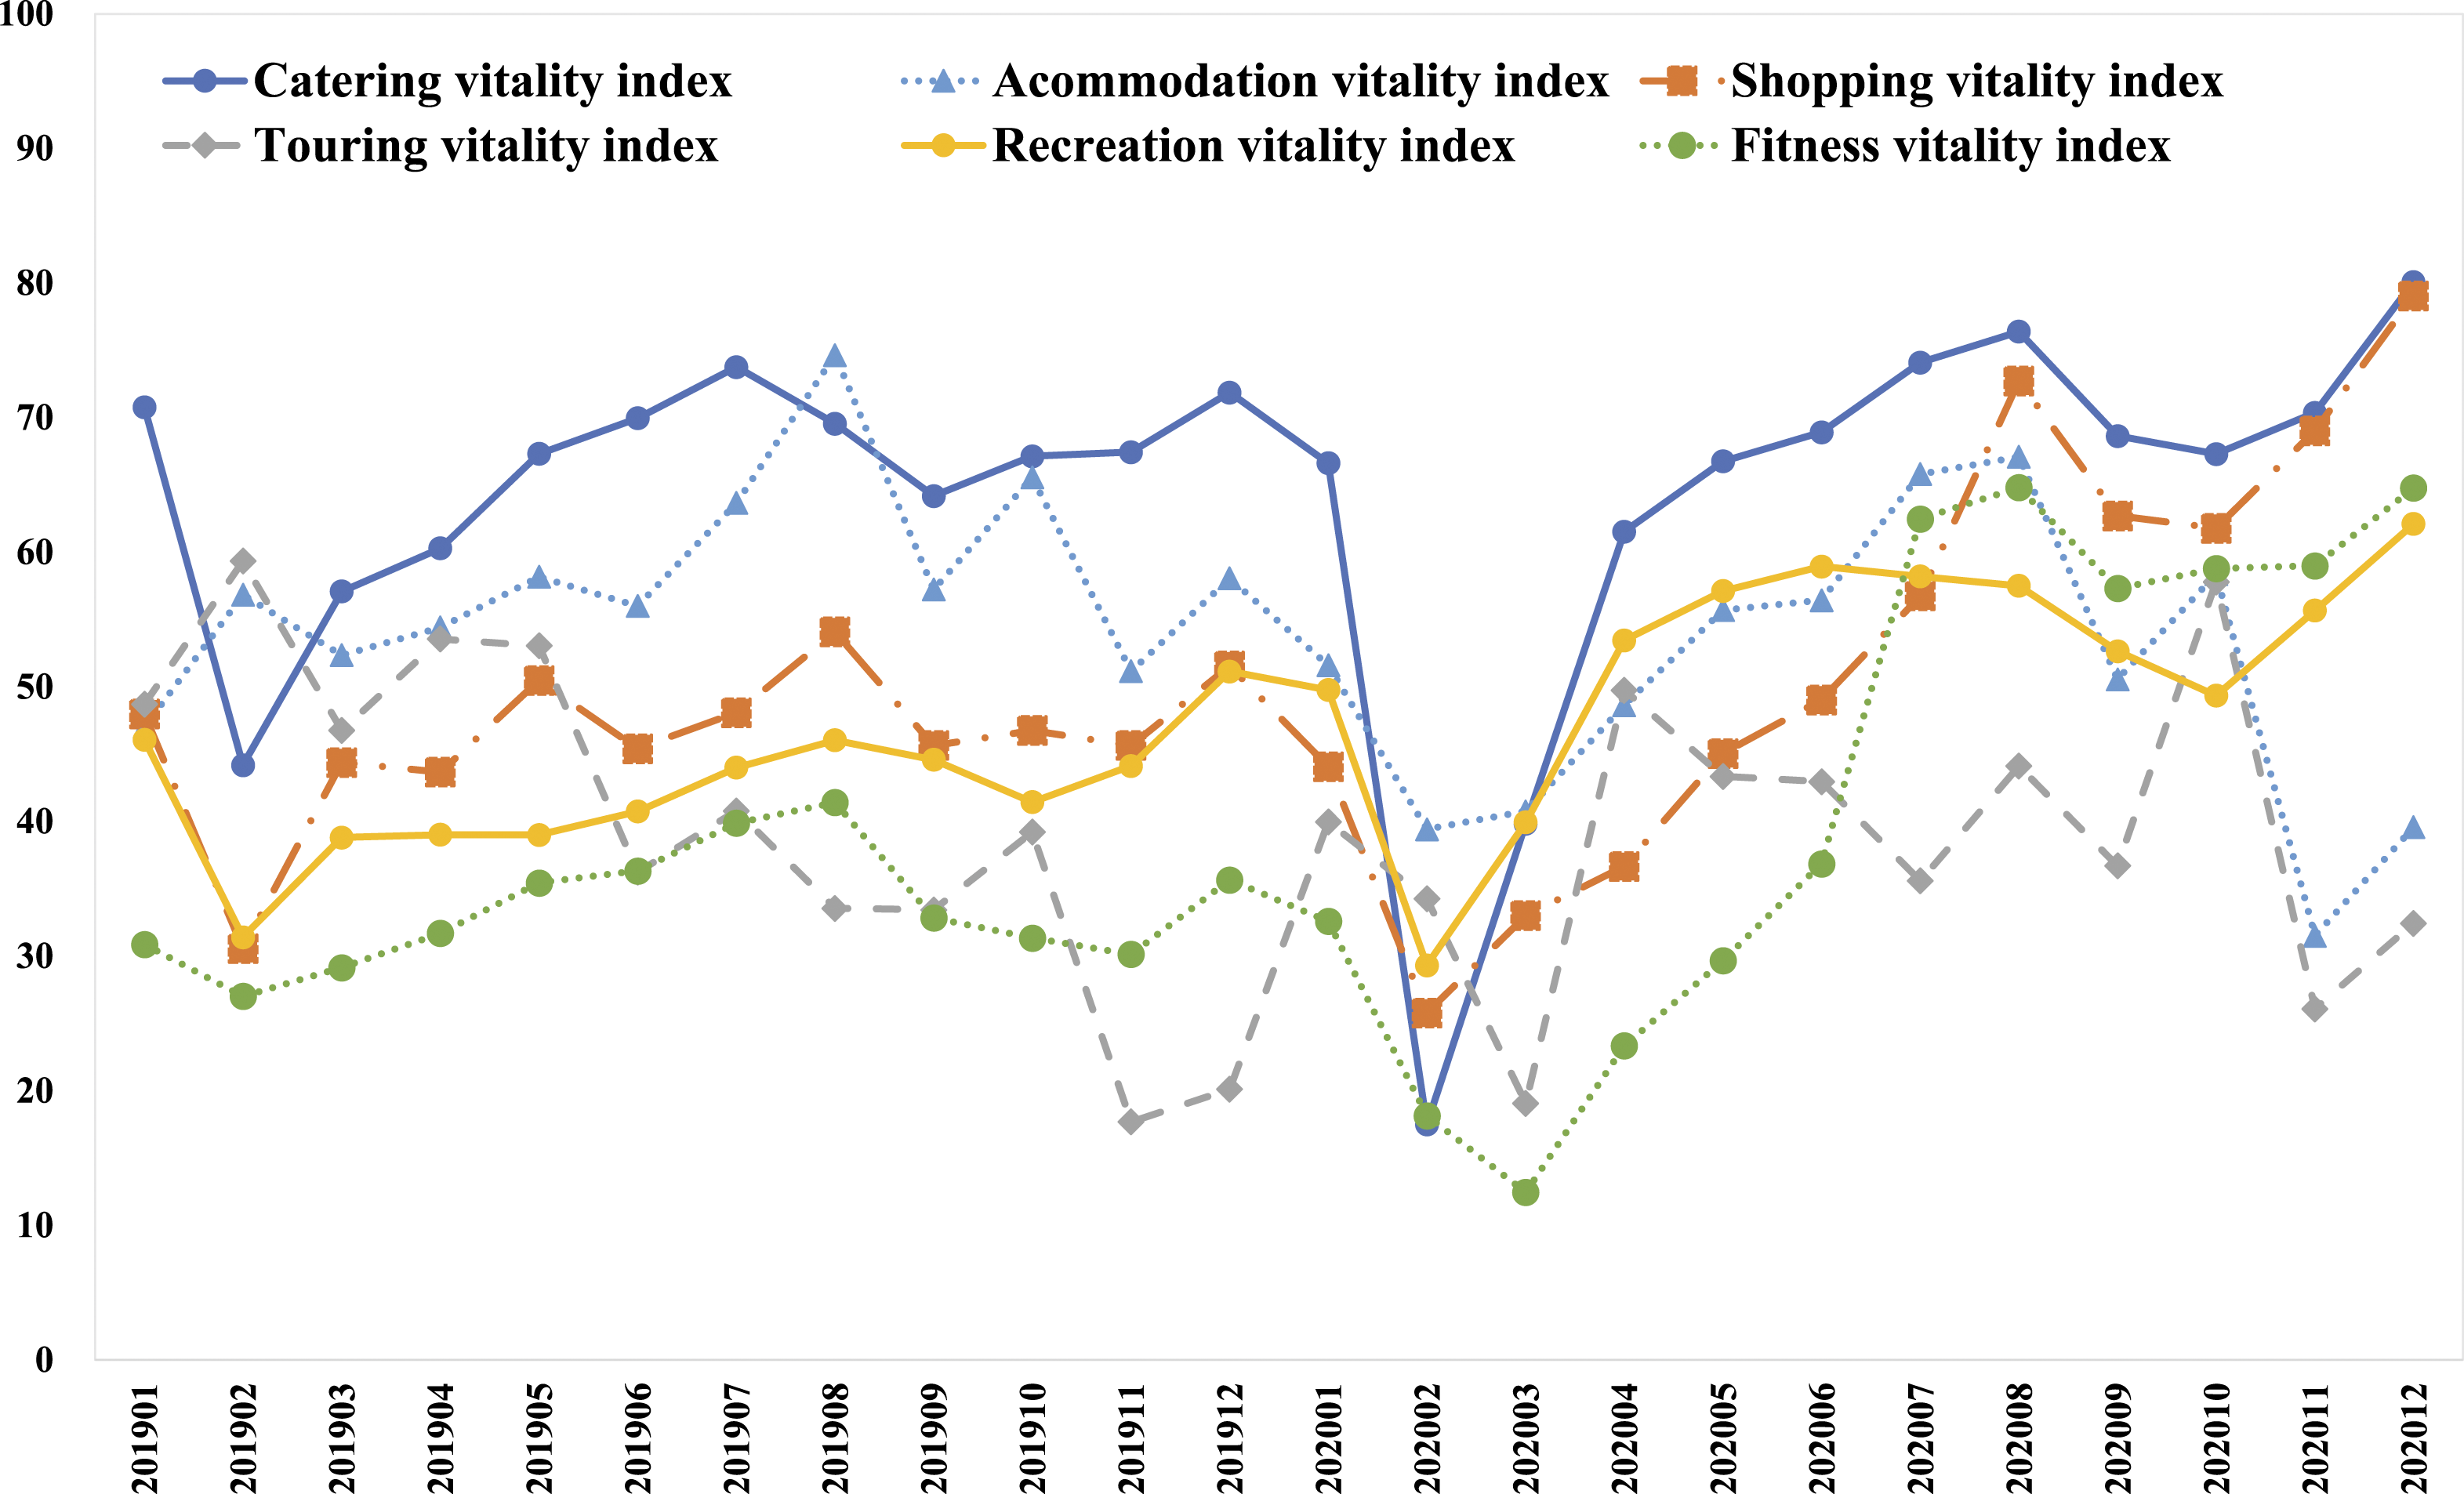
Across these six service sectors, the catering sector showed the highest average index score of 65.3 in 2019 with a moderate decline to 63.2 in 2020. However, the catering index also recorded the lowest score in February 2020, when China was most affected by COVID-19; this month saw the outbreak’s dramatic adverse impact on the catering industry. External factors that can affect restaurant sales include national economic conditions, socio-demographic characteristics, weather conditions, time availability, events, government policies, and various crises such as infectious diseases (Yang et al., 2020a, 2020b). The catering industry relies heavily on human interaction and gatherings and is particularly vulnerable to health crises such as COVID-19.
Tourism was one of the sectors hardest hit by the pandemic: the average accommodation vitality index score fell by 12.9% from 57.9 in 2019 to 50.5 in 2020. A similar decline was observed in the touring vitality index, which mainly evaluated night tours; its annual average score dropped from 40.2 in 2019 to 38.5 in 2020. Following this intense period of digital engagement and physical restriction, high-quality experiential and meaningful flagship destinations will be in greater demand than ever. Tourists have tended to be more cautious in this new era, initially gravitating toward destinations close to home, first locally and then nationally. For instance, high-net-worth individuals who may have traveled frequently for business or leisure pre-COVID-19 will now remain closer to home. The other three sub-indices indicated double-digit growth in 2020 over 2019, driven by strong annual growth of 29.5% in the fitness vitality index followed by the recreation vitality index (23.2%) and shopping vitality index (14.7%).
Comparisons across cities and counties
We then compared the monthly average NTEVI scores across 11 cities in Zhejiang Province between 2019 and 2020 (see Figure 5). NTE vitality developed unevenly among cities. Based on the quartiles of calculated index scores in 2019, the 11 cities could be classified into three levels: high (Hangzhou, Jinhua, and Ningbo), medium (Huzhou, Zhoushan, Jiaxing, Shaoxing, and Wenzhou), and low (Lishui, Taizhou, and Quzhou). As the capital of Zhejiang Province, Hangzhou is the provincial center of politics, economics, culture, science, and education. Hangzhou’s NTEVI scores topped the list, indicating that Hangzhou’s NTE was far more active and developed than that of other cities. The rankings of NTEVI scores were consistent with the rankings of GDP per capita among the 11 cities, providing additional evidence to validate the settings of our proposed index. Correlation analyses between the NTEVI and economic indicators appear in the next section to further justify our conclusions. Rankings of 11 cities’ night-time economy vitality index in Zhejiang Province.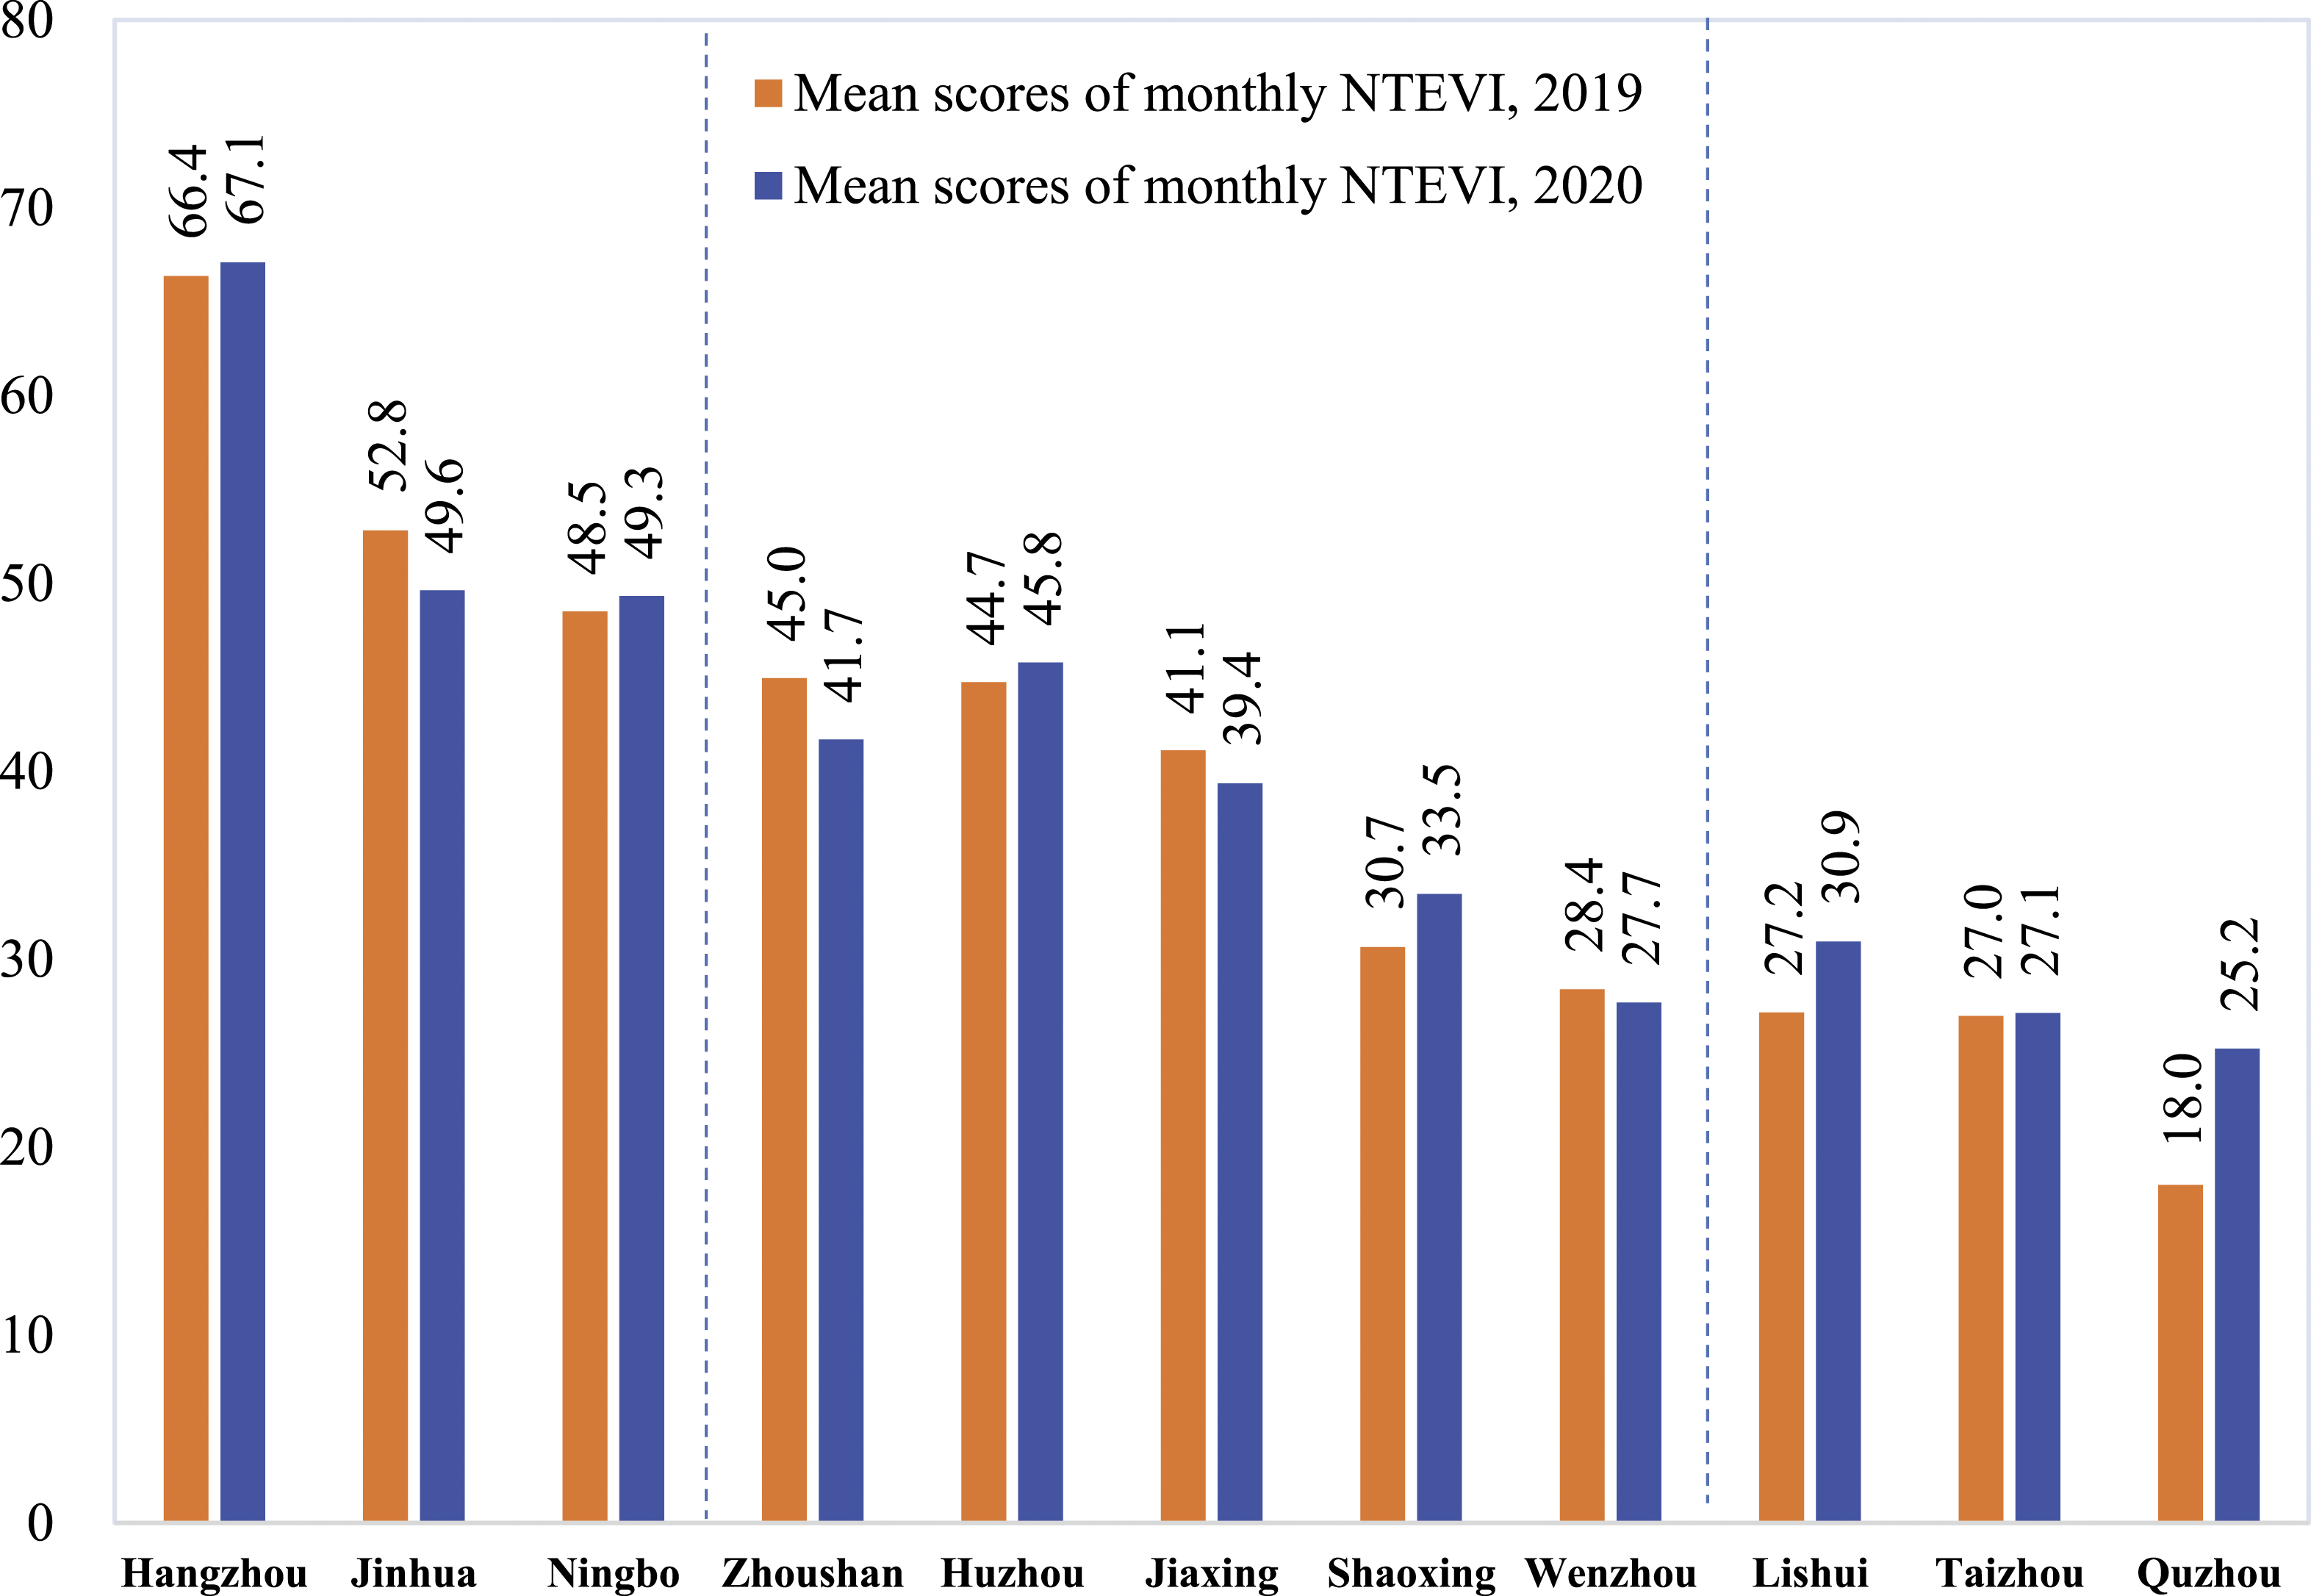
Hangzhou and Jinhua were selected to spatially compare various service sectors (see Figure 6). Monthly average scores for the catering and touring vitality indices in Jinhua were higher than those in Hangzhou, whereas the other four sub-index scores were lower in Jinhua. This trend implies that Jinhua’s night-time catering and touring sectors were much more developed than other sectors. More effort is therefore needed to encourage higher consumption in the other four service sectors. In terms of Hangzhou, related government sectors should act to bolster the catering industry. Comparison of sub-indices of Hangzhou and Jinhua, Zhejiang Province.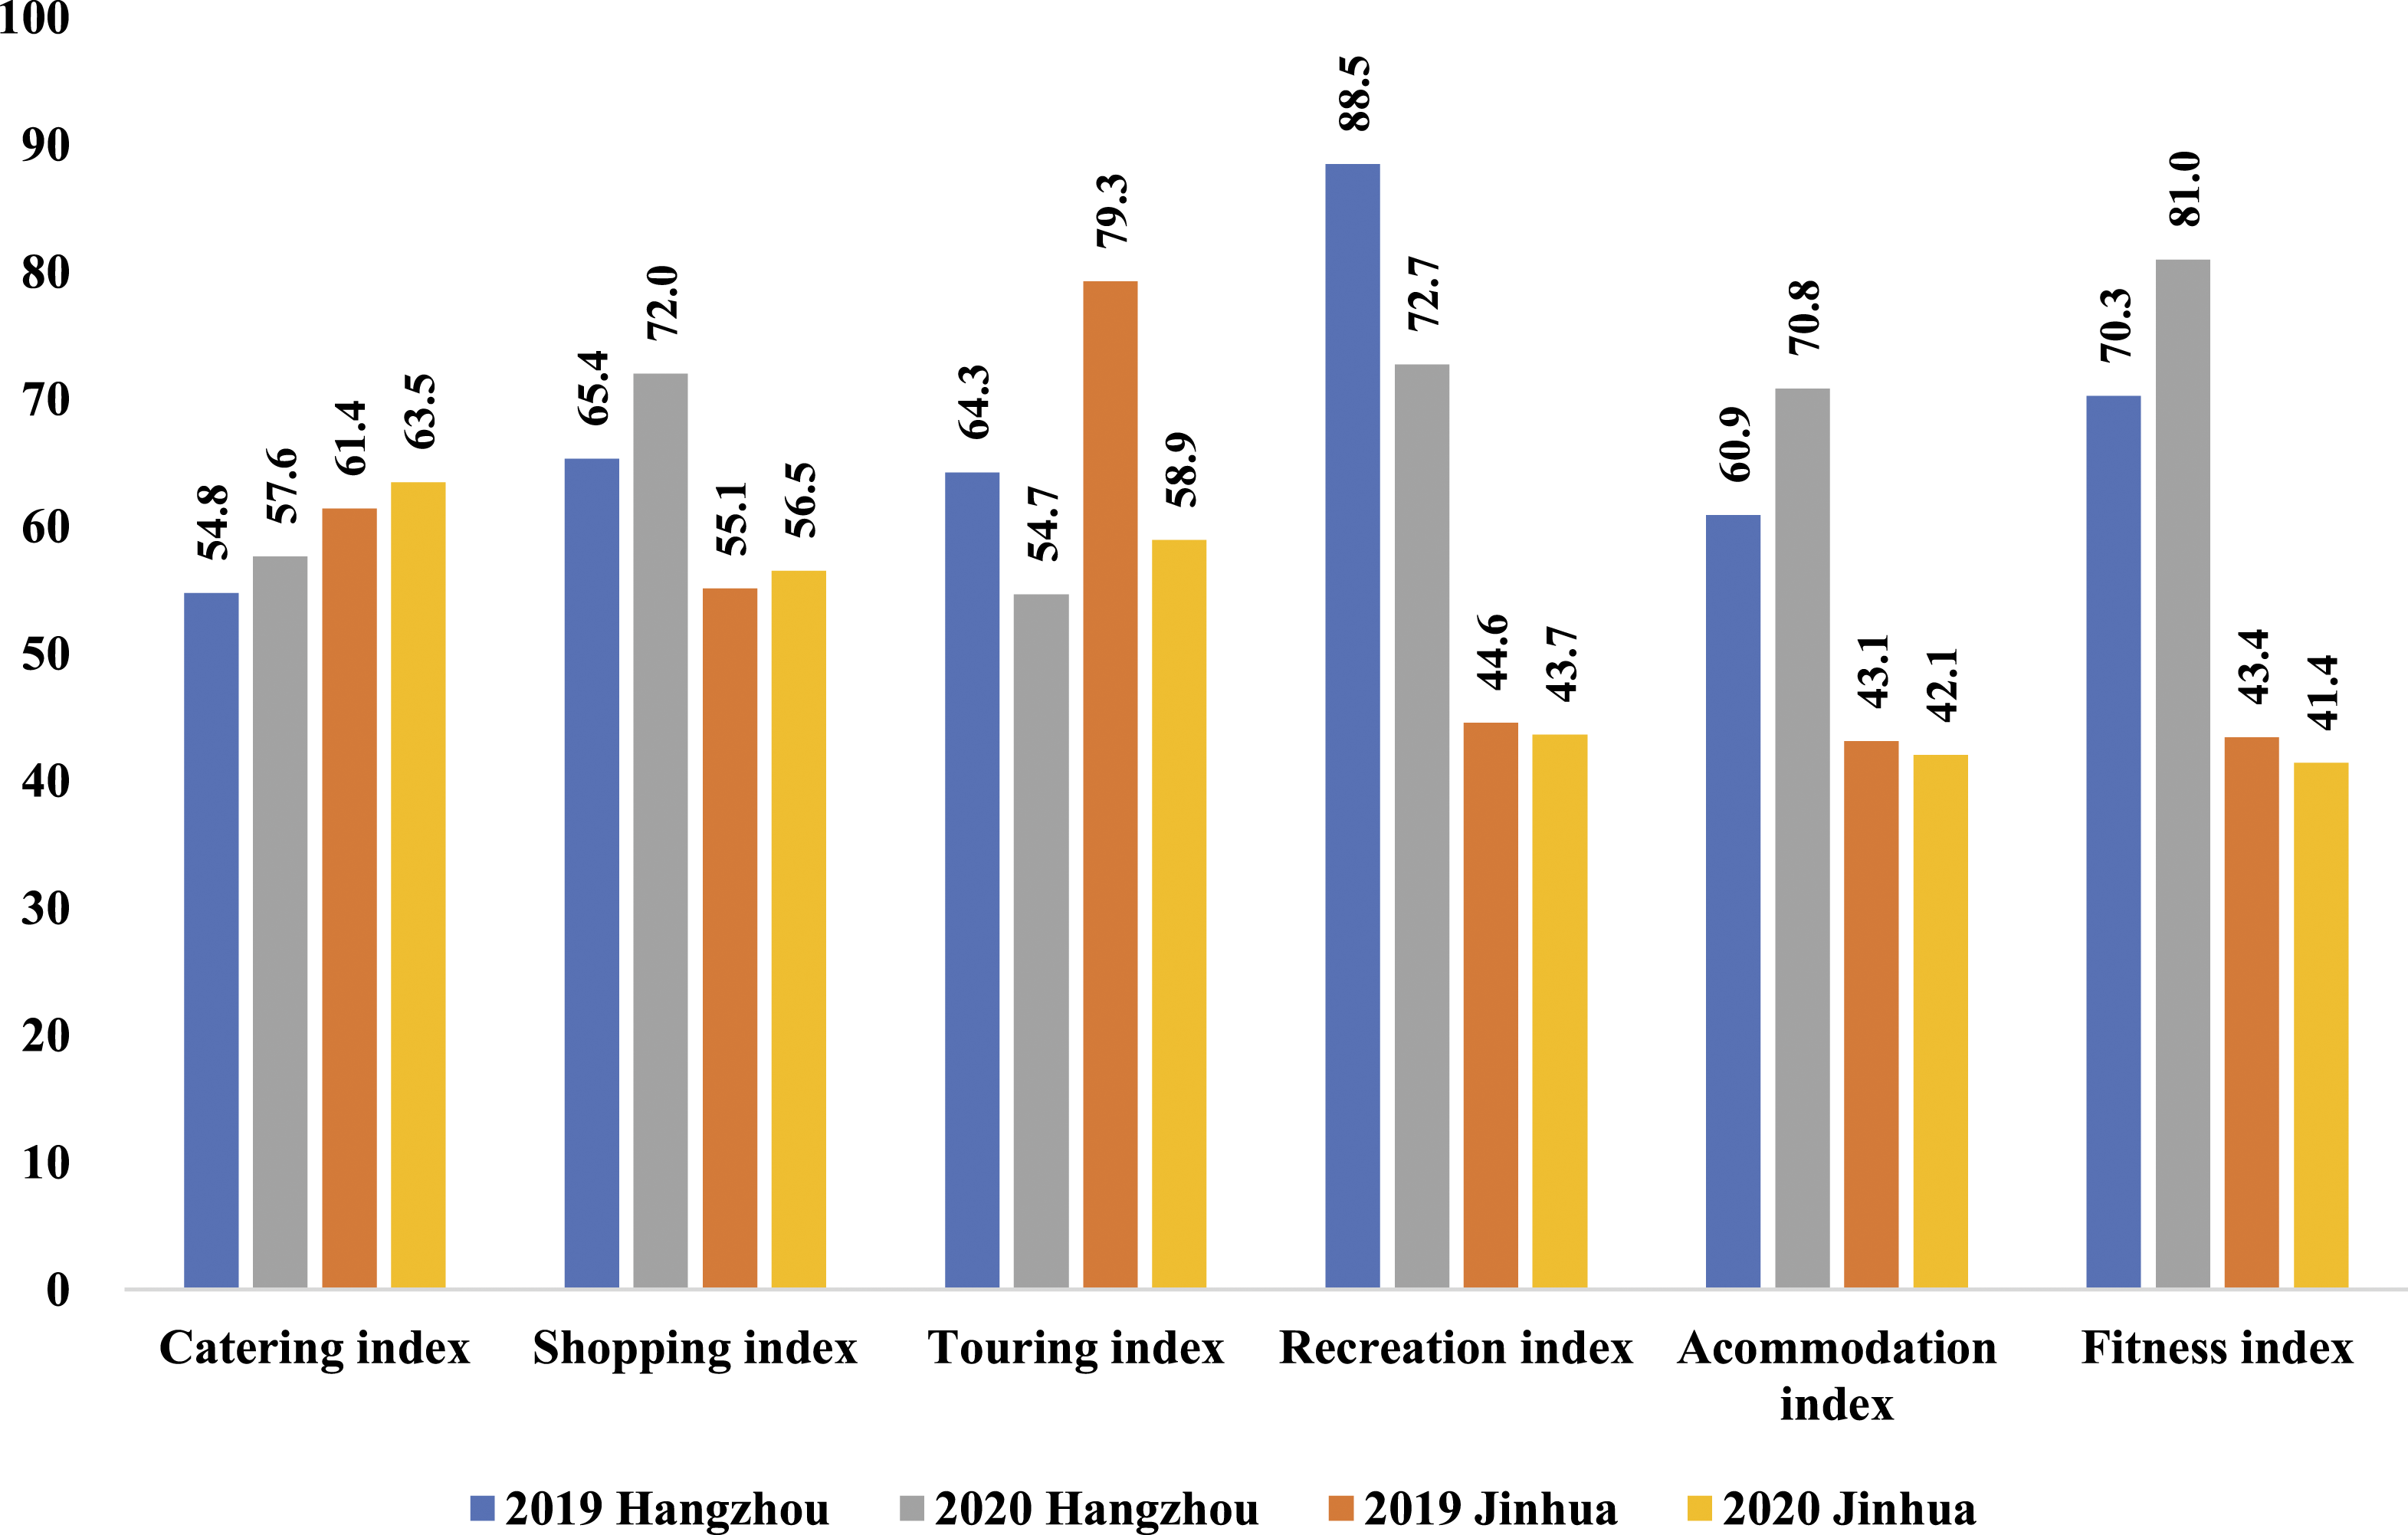
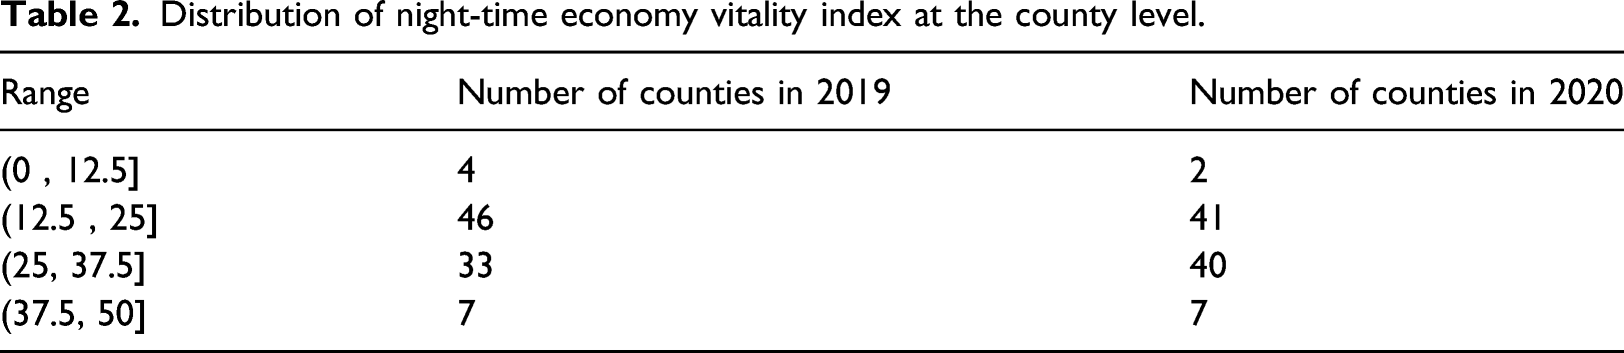
Distribution of night-time economy vitality index at the county level.
Correlation analysis
NTEVI and night light index
Relationship among city-level night-time economy vitality index, night light index, and economic performance.
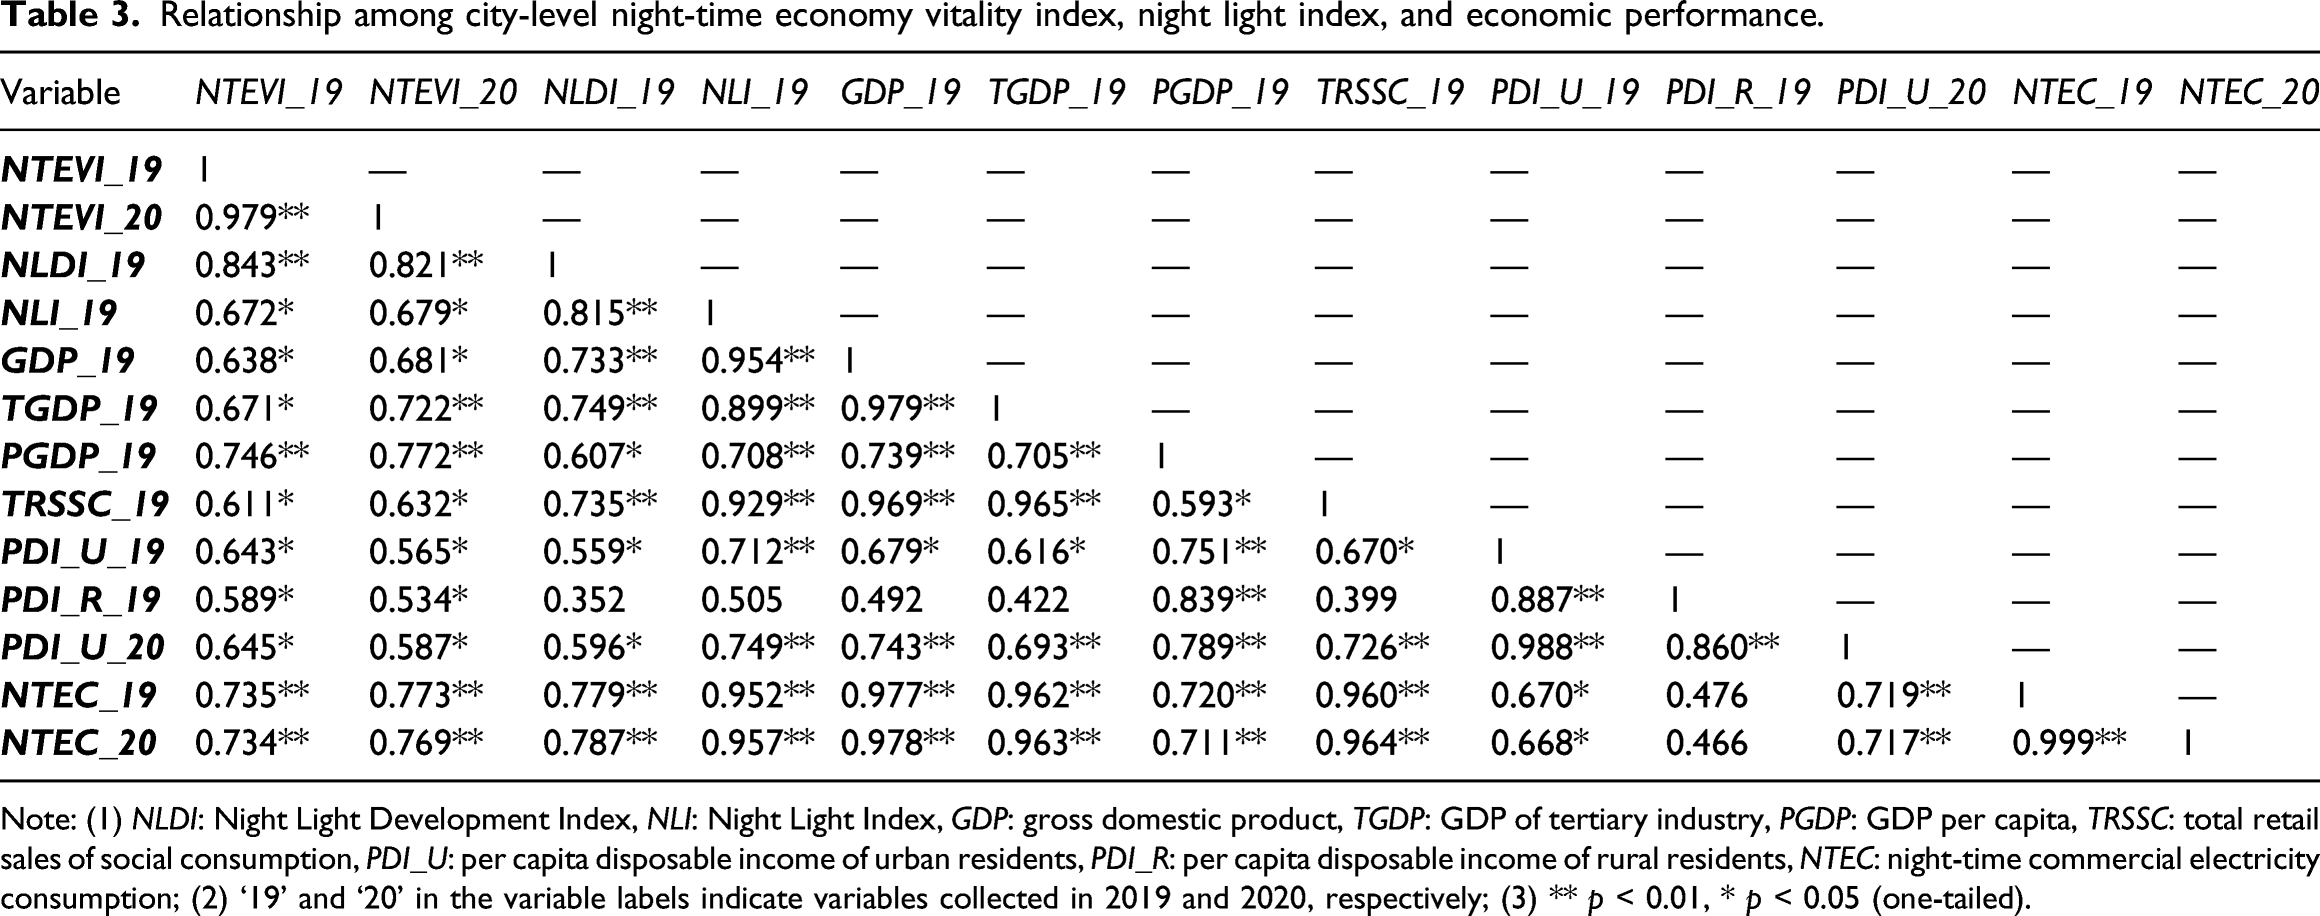
Note: (1) NLDI: Night Light Development Index, NLI: Night Light Index, GDP: gross domestic product, TGDP: GDP of tertiary industry, PGDP: GDP per capita, TRSSC: total retail sales of social consumption, PDI_U: per capita disposable income of urban residents, PDI_R: per capita disposable income of rural residents, NTEC: night-time commercial electricity consumption; (2) ‘19’ and ‘20’ in the variable labels indicate variables collected in 2019 and 2020, respectively; (3) ** p < 0.01, * p < 0.05 (one-tailed).
NTEVI and economic performance
In addition to the two night light indices, we carried out robustness checks via correlation analyses between the monthly average NTEVI of 11 cities in Zhejiang Province and 6 ‘classic’ economic indicators. Table 3 reveals that the NTEVI (NTEVI_19) was positively and significantly correlated with all six economic indicators: GDP (GDP_19), TGDP (TGDP_19), PGDP (PGDP_19), TRSSC (TRSSC_19), PDI_U (PDI_U_19), and PDI_R (PDI_R_19). The highest correlation coefficient was found between the NTEVI and PGDP (0.843); this relationship was significant at the 1% level (one-tailed). The other five pairs were significantly correlated at the 5% level (one-tailed), and their corresponding coefficients were all close to or above 0.6. The correlation between NTEVI_19 and PDI_R_19 was relatively lower but still significant, as the data used in this study mainly reflected urban NTE performance. Correlation analyses between the NTEVI in 2020 (NTEVI_20) and the same set of six economic indicators yielded similar results: correlations for the six pairs were all significant at least the 5% level (one-tailed) with corresponding coefficients above 0.5. Night-time commercial electricity consumption data (NTEC_19 and NTEC_20) were adopted to cross-verify the correlation between raw data and the calculated index. Results showed that the NTEVI and NTEC were significantly and positively correlated at the 1% level in 2019 and 2020. Findings from the above analysis further support the high credibility of our NTEVI.
NTEVI and tourism development
Relationship between city-level night-time economy vitality index and tourism development.
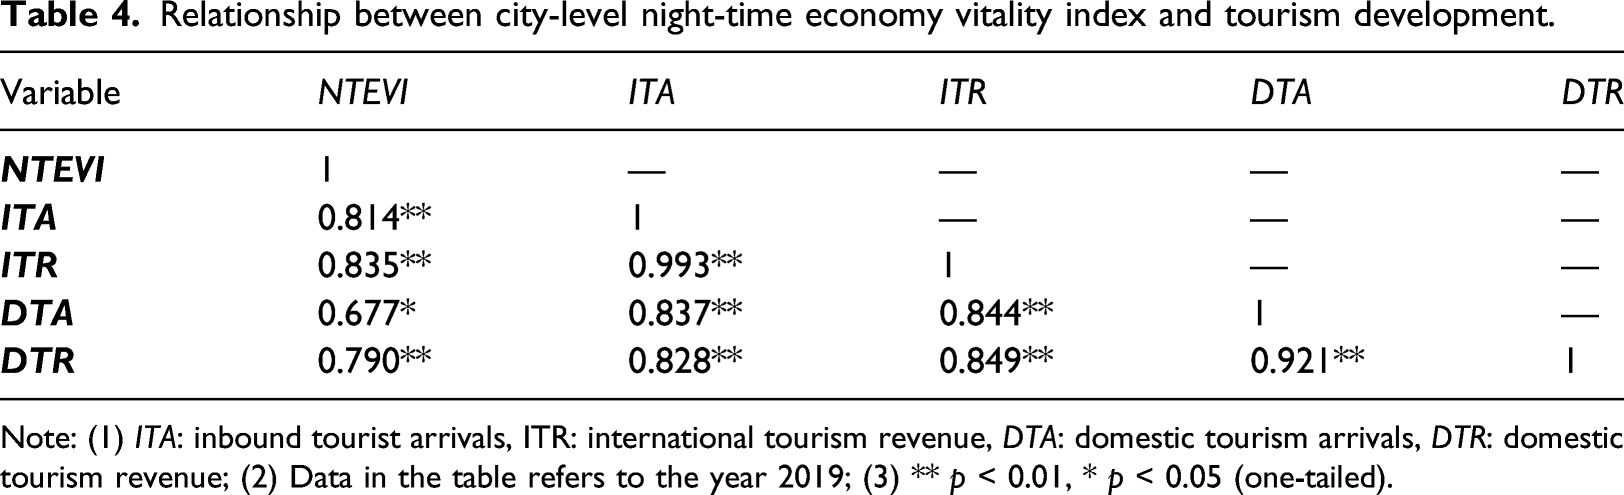
Note: (1) ITA: inbound tourist arrivals, ITR: international tourism revenue, DTA: domestic tourism arrivals, DTR: domestic tourism revenue; (2) Data in the table refers to the year 2019; (3) ** p < 0.01, * p < 0.05 (one-tailed).
Discussion and conclusions
As a modern urban consumption economy with tertiary industries as its main form, the NTE extends the time and space of urban residents’ and tourists’ consumption, which represents a primary driver of urban economic development. Especially in the context of the COVID-19 pandemic, the NTE is becoming a powerful engine to accelerate the recovery of consumption and urban economic revival. This study developed the NTEVI in a supply–demand framework of economics to empirically assess the degree of NTE vitality in Zhejiang Province’s 11 cities and 90 counties. As expected, high seasonality of NTE activities was observed in NTEVI trends, pinpointing summer as the peak season and winter as the low season. The NTEVI also demonstrated a clear V-shape caused by the severe shock of the COVID-19 outbreak. Recovery paths for the selected 90 counties and 11 cities were clearly delineated.
Among different service sectors, the catering sector was hit worst by COVID-19 in 2020. Double-digit annual growth in the shopping, recreation, and fitness indices in 2020 over 2019 could indicate changing consumer behavior patterns after the outbreak. The pandemic has inspired temporary or permanent behavioral shifts in people’s work, health, travel, shopping, lifestyle, interpersonal relationships, and social interaction, particularly in the domains of mobility, health, and finance (Puttaiah et al., 2020). Consumer behavior is also strongly dependent on time and location (Sheth, 2020); the pandemic has added complexity to this dimension and accelerated the adoption of behavior already gaining traction, such as the digitalization of shopping and banking. Due to social distancing and restricted physical movement, consumers are turning to virtual worlds to meet day-to-day needs at an unprecedented rate. The demand for value-based purchasing and online shopping also appears sustainable in the long term: the e-commerce sector has responded swiftly to the need to create positive and productive experiences in response to the pandemic (Puttaiah et al., 2020). A report from Gale (2020) indicated that the pandemic has revolutionized the fitness industry and ushered in a new normal. Consumers will now be connected to fitness activities at a deep and personal level. The results of our correlation analysis also revealed that the NTEVI was highly and significantly correlated with two night light indices, economic indicators, and tourism demand measurements. These conclusions reflect the index’s ability to produce credible results along with its applicability to economics, tourism, and related areas for additional econometric analysis.
By analyzing regional and temporal differences across service sectors over time, the NTEVI serves as a powerful numerical and visual tool to monitor NTE development at the county, city, and provincial levels. Findings can thus provide valuable insight for NTE-related policy formulation, resource allocation, and policy evaluation in Zhejiang Province. Regarding COVID-19, the index depicts post-pandemic recovery patterns. Our overall index implied imbalanced regional NTE development in Zhejiang Province. Subsequent sub-index analyses then contextualized underlying problems leading to such imbalance. Regional authorities can monitor index results over time and draft appropriate development policies to improve the local NTE more efficiently. Analyses of the NTEVI at the sectoral level, temporally and regionally, can also promote a clearer understanding of the regional NTE’s performance and competitiveness. Monitoring NTEVI results over time and across administrative regions will clarify a region’s poorly performing sectors that require improvement at any time. More resources may need to be allocated to these sectors to encourage NTE development. High-performing sectors that drive the local NTE should be enhanced to increase regional competitiveness. Furthermore, government officers may consider using the NTEVI as a proxy of economic indicators that reflect NTE development, given a general lack of confidence in the quality of official statistics. The NTEVI provides a trustworthy framework for measuring NTE vitality at the regional level by effectively combining multi-source big data and traditional official statistics. We found the index results to be highly credible and robust, underlining the NTEVI’s potential utility.
Although our proposed framework to develop a multi-dimensional night-time index provides meaningful insight into the NTE, several limitations of our index should be noted. First, we included six typical sectors but excluded transportation, a key driving factor of the NTE (Hobbs et al., 2003), due to data availability. Future research may calculate a transportation index based on the accessibility of local transportation (e.g., service time and quality of public transportation) to improve the index system. Second, all sub-indices contained roughly eight individual indicators; data availability and quality were contingent on the M company in our case. Online transaction records, reviews, and supply-side information of related service providers from the chosen company could lead to potential bias, even though we integrated electricity consumption data from an independent electric power company as well. Third, the NTEVI and its sub-indices can serve as input for various econometric models. We made initial attempts to carry out correlation analysis at the county and city levels, but our findings should be interpreted with caution given the small sample size. Further econometric analysis can be undertaken as more data points become available. Fourth, we took Zhejiang Province as an example to calculate the index; the province’s macro social and economic environment demonstrated a relatively high level of digitalization in NTE consumption compared to other provinces. The generalizability of the NTEVI may also be constrained by the extent of regional economic development. The NTEVI can be enhanced in the future by adding more region-specific NTE characteristics. Fifth, nightlife variables such as socio-economic status, age, gender, sexual orientation, or religious beliefs (Hae, 2011; Valentine and Holloway, 2010; Warren and Evitt, 2010) can be analyzed in subsequent work to allow for greater NTE understanding.
Supplemental Material
sj-pdf-1-teu-10.1177_13548166211042970 – Supplemental Material for Night-time economy vitality index: Framework and evidence
Supplemental Material, sj-pdf-1-teu-10.1177_13548166211042970 for Night-time economy vitality index: Framework and evidence by Vera Shanshan Lin, Yuan Qin, Tianyu Ying, Shujie Shen and Guangming Lyu in Tourism Economics
Footnotes
Declaration of conflicting interests
The author(s) declared no potential conflicts of interest with respect to the research, authorship, and/or publication of this article.
Funding
The author(s) disclosed receipt of the following financial support for the research, authorship, and/or publication of this article: This work was supported by the National Natural Science Foundation of China under Grant number 71973126 and Natural Science Foundation of Zhejiang Province under Grant number LY19G030029.
Supplementary material
Supplementary material for this article is available online.
Author’s biographies
References
Supplementary Material
Please find the following supplemental material available below.
For Open Access articles published under a Creative Commons License, all supplemental material carries the same license as the article it is associated with.
For non-Open Access articles published, all supplemental material carries a non-exclusive license, and permission requests for re-use of supplemental material or any part of supplemental material shall be sent directly to the copyright owner as specified in the copyright notice associated with the article.