
Abstract
Aims: Research on the effect of unmet health-care needs on mortality at follow-up is scarce. This study investigated whether unmet health-care needs in 2008 were associated with a higher risk of mortality during a five-year follow-up period in a population in southern Sweden, and whether the association was stronger for particular subgroups of cause of death. Methods: The 2008 public-health survey in Skåne was used as baseline. The survey included variables such as unmet health-care needs, risk behaviours and social and socio-economic variables, and had 28,198 respondents aged 18–80 years. The study was longitudinal. Mortality data for the period 27 August 2008 (start of the survey) to 31 December 2013 were provided by the National Board on Health and Welfare. Analyses were run using Cox proportional hazard models. Mortality was analysed as the total and in subgroups: cardiovascular disease (CVD), cancer and other causes. Results: In the time period studied, 946 (3.4%) people had died. Unmet health-care needs increased the hazard ratios (HRs) of total mortality after adjusting for age, particularly for people aged 65–80 years (HR=1.53; confidence interval 1.24–1.88). Unmet health-care needs were associated with death due to cancer and other causes but not with CVD. Adjusting for self-rated health attenuated the HRs. For the age group 18–64 years, there was no significant association between unmet health-care needs and mortality.
Introduction
Advances in medicine have improved quality of life and prolonged lives generally, as well as for the aging population. Bunker et al. reported that by the end of the last century, about half of the increase in life expectancy could be attributed to medical care [1]. However, the quality of and access to health care differs between countries, regions and socio-economic groups. While data are easily attainable for mortality worldwide as well as for unmet health-care needs in developed countries and regions [2–4], to date little research has been done on the relationship between those who considered themselves in need of health care but did not seek or receive health care and mortality at follow-up.
Countries with strong primary-care provision have healthier populations [5], and healthy citizens generate higher productivity [6]. Despite the 2010 health-care reform of facilitating health-care privatisation in an attempt to improve health-care availability, Swedish health care continues to struggle with long waiting times for elective surgery and specialist appointments. Today, 40% of primary care is private, while most hospitals are still public [7]. The nationally legislated health-care guarantee limits the waiting time to a general practitioner to a maximum of seven days and to a specialist appointment and to elective surgery within three months [8]. However, not everyone receives health care within the health-care guarantee. Between July and September 2018, 35–40% (results are updated monthly) of patients had not received elective surgery within 90 days in Skåne, the most southern region in Sweden [9].
The current health-care system of 21 county councils, which independently govern the health care in each region, also creates geographical inequalities. The best results (highest percentage of cases achieving the health-care guarantee) occur in Stockholm and Halland [9]. Today, there is an effort to refer or steer patients whose health-care guarantee cannot be achieved within the county council where the patient is listed to other county councils or even abroad [8].
One way to reduce the waiting time for a specialist evaluation is to sign up for private health-care insurance. Today, about 10% of Swedes aged 16–64 years have private health-care insurance. More than 70% of these insurance policies are paid by people’s employers. A person with private insurance is guaranteed quick access to private health care, but has no priority to the highly specialised university hospitals, which are publicly run. Private health-care insurance is said not to compete with but to be a complement to public health care [10].
Despite a universal and egalitarian health-care system, several studies have shown that certain socio-economic groups gain better access to health care than others [11,12] and that socio-economic disparities in life expectancy have also increased over the last decades in Sweden [13]. Socio-economic differences in health are multifactorial and can to some extent be explained by different risk behaviours but also by economic and social factors. While smoking and lack of physical activity are known risk factors, the association between social participation and trust and health is not as clear. A previous study showed a higher incidence of acute myocardial infarction for people with low social participation, but not for those with low trust in other people [14].
The most commonly used measure of access to health care is self-assessed unmet need during the past 12 months [15]. This subjective assessment of unmet health-care needs assumes the patient to be the best assessor of their health status and whether they have received the most appropriate health care. The Survey of Health, Ageing and Retirement in Europe and the Survey of Income and Living Conditions (SILC) are two European surveys that have investigated subjective unmet needs in Europe over the years. Data from the SILC study suggest that Sweden has higher unmet health-care needs (9.2%) compared to the European average (6.7%). However, most of the unmet needs in Sweden were reasons not related to the health-care system (e.g. patients who decided to wait and see if the problems subsided). Economic reasons for not seeking care were fairly low in Sweden [2].
The measure of unmet health-care needs is complex and multifactorial. It includes such factors as the individual’s perception of their health condition in relation to their expectations of health services, the aspects of self (e.g. gender, socio-economic status (SES) and age), the typifications staff use in categorising people and diseases, the availability of health services such as opening hours, appointment scheduling, permeability, accessibility by means of transportation and parking, knowledge of what the health-care service can offer, what can be referred, communication and language barriers, and the availability of the health-care seeker such as time and economic resources [16].
There are few prospective studies regarding unmet health-care needs and overall mortality. One paper on the elderly in Spain demonstrated higher mortality for those with unmet needs after a median follow-up of 60.3 months adjusting for several confounding factors. However, unmet needs were defined and assessed differently from those in the present study [17].
The aim of this study was to determine whether and to what extent unmet health-care needs assessed by the 2008 public-health survey in Skåne affected mortality during a five-year prospective period, and if particular causes of death are more prevalent among those with unmet health-care needs. This could hint at certain problem areas within Swedish and regional health care.
Methods
Study population
Data from the 2008 public-health survey in Skåne were used. The survey was cross-sectional and was based on a stratified random sample of people aged 18–80 years living in Skåne according to the public register of residents. The sample is weighted to increase the statistical power in municipalities and city parts. Data were collected from 27 August to 30 October 2008 initially via an online survey and later by mail to non-respondents. Three reminders were sent to non-respondents. In the 2008 survey, 28,198 people (54.1%) responded to the questionnaire. The study was approved by the ethical committee in Lund (2010/343).
Definitions
Dependent variables
Mortality was assessed from 27 August 2008 to 31 December 2013, which amounts to a period of 5.3 years. Mortality data for the respondents in the 2008 questionnaire were received from the National Board on Health and Welfare (Socialstyrelsen). Personal data were unencrypted by an external unit (Tieto) to ensure anonymity and subsequently encrypted to maintain the integrity of the subjects in this study. Out of the 28,198 respondents in the survey, 135 could not be traced, which left a cohort of 28,063 people. In the follow-up period, 946 people had died.
Cause of death was assessed according to the International Classification of Diseases 10th revision, and was grouped into three categories: (a) cardiovascular causes of death, including myocardial infarction, stroke, pulmonary emboli, arrhythmias and diseases of the heart valves (ICD I109–I729), (b) death from cancer (C019–C979) and (c) all other causes (A047–B999, C329–G931 and J101–Y869), including infections, lung diseases, neurological conditions, gastrointestinal conditions, injuries and exposures. The reason not to divide the third group any further is that the number included would be too small for sufficient statistical power.
Independent variables
Unmet health-care needs during the past three months were assessed with the subjective item: ‘Have you during the past three months considered yourself to be in need of health care by a physician, but not sought such care?’ Response options were ‘yes’ or ‘no’. Reasons for not seeking health care are listed in Table II.
Age was analysed in ranges (18–34, 35–44, 45–54, 55–64 and 65–80 years) in Tables I and III. In Table IV, age was stratified into 18–64 and 65–80 years. Age was adjusted for as a continuous variable in Tables III and IV.
Tables I–III were stratified by sex.
Prevalence (%) of age groups, country of birth, SES, self-rated health, smoking, physical activity, BMI, social participation, trust and unmet health-care needs.
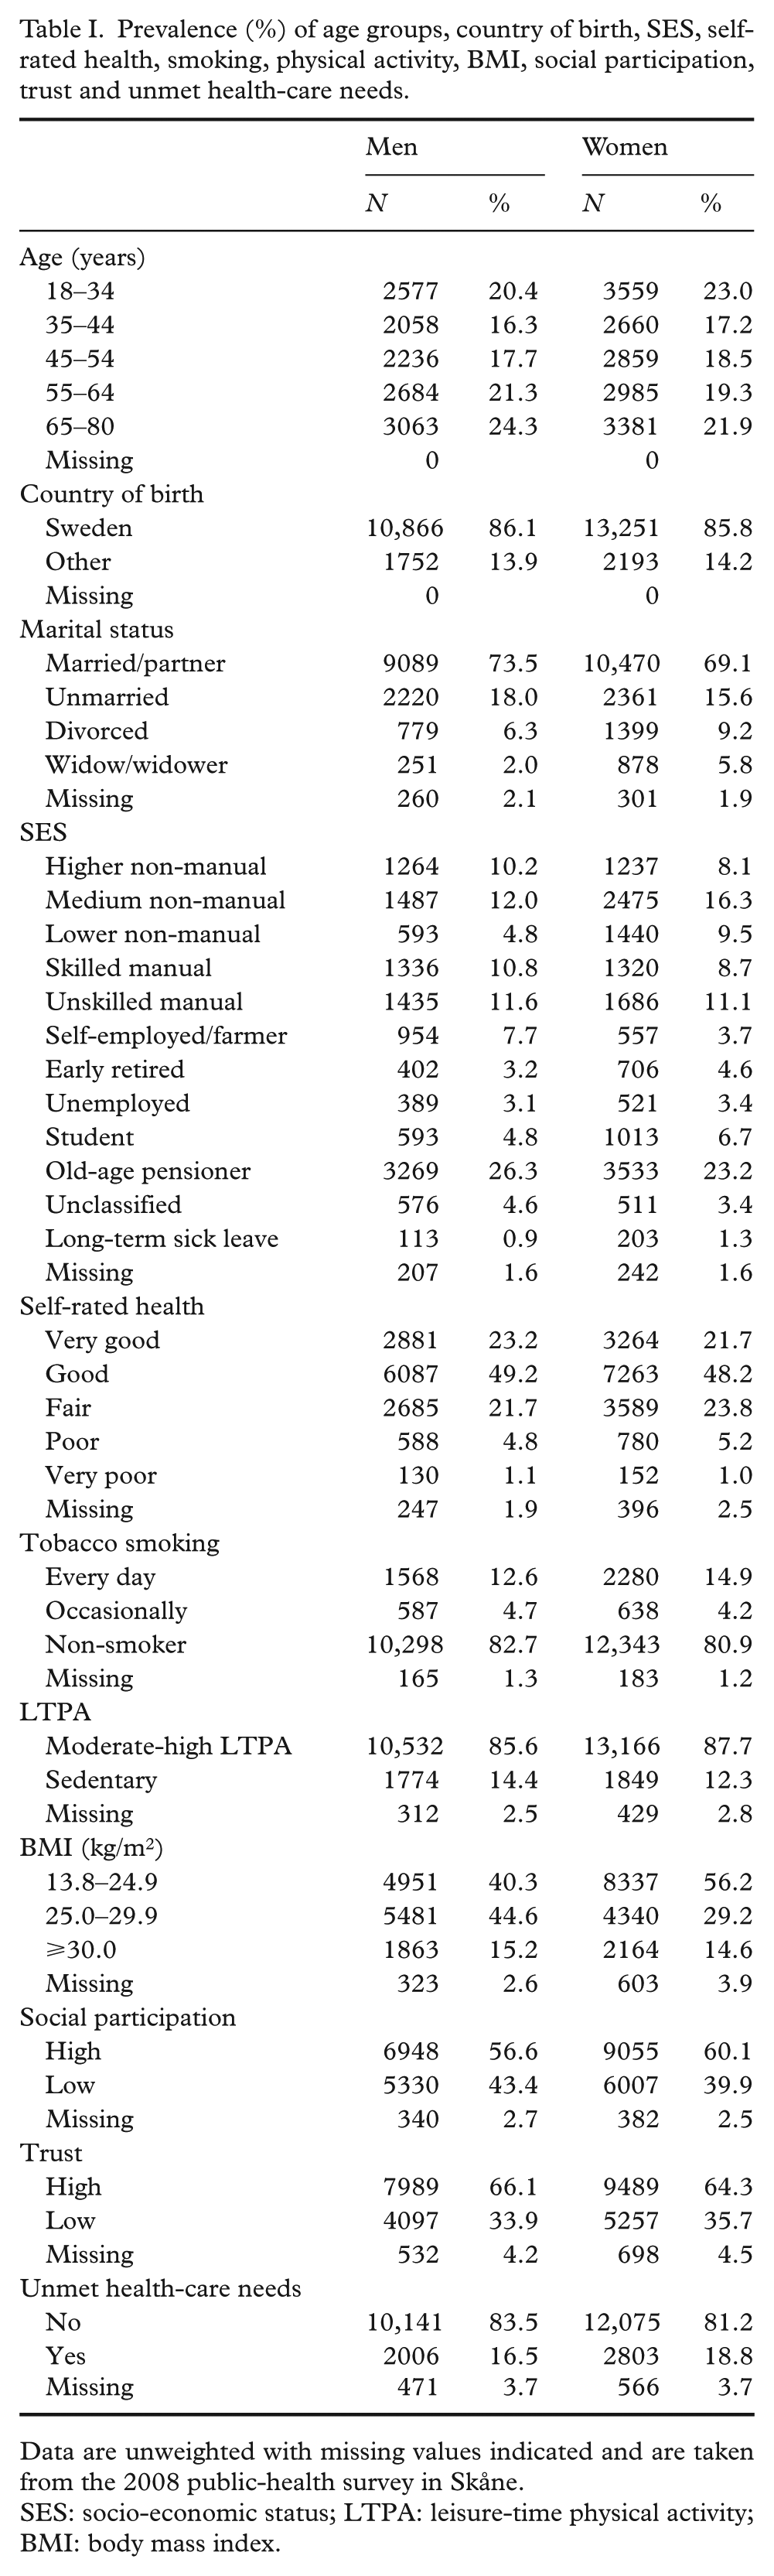
Data are unweighted with missing values indicated and are taken from the 2008 public-health survey in Skåne.
SES: socio-economic status; LTPA: leisure-time physical activity; BMI: body mass index.
Frequency (%) of reasons for not seeking health care among those with unmet health-care needs.
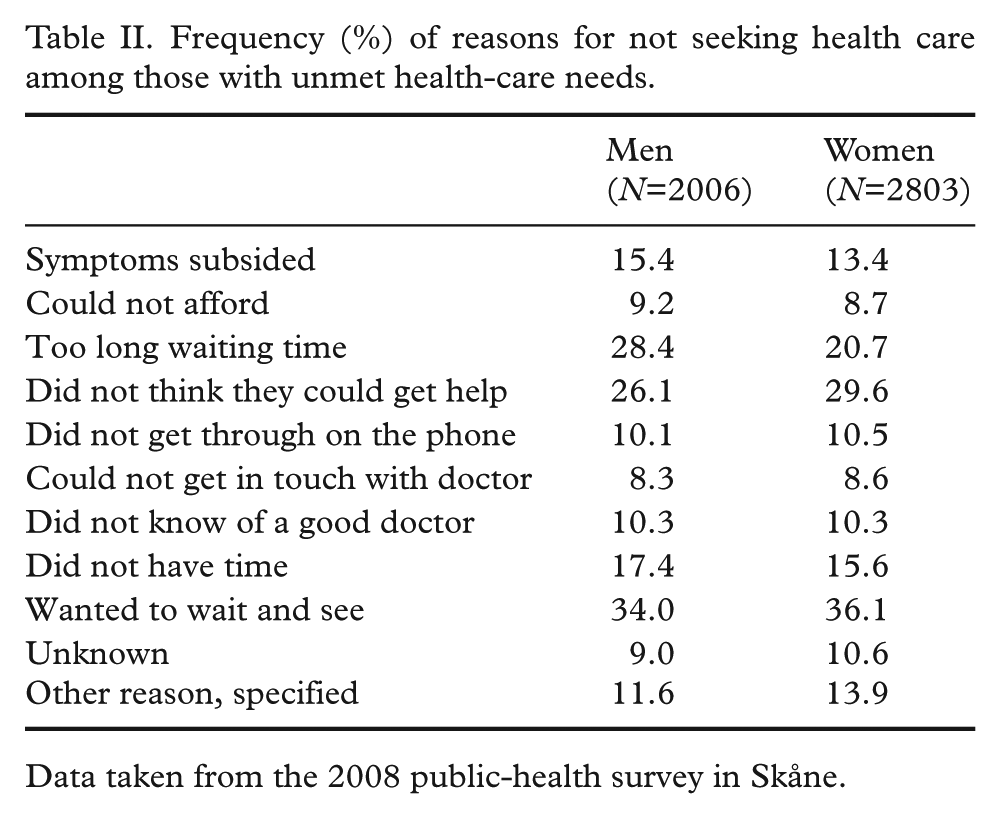
Data taken from the 2008 public-health survey in Skåne.
HRs of total mortality with 95% CI according to age groups and age-adjusted HRs for country of birth, marital status, SES, SRH, smoking, LTPA, BMI, social participation, trust and unmet health-care needs.
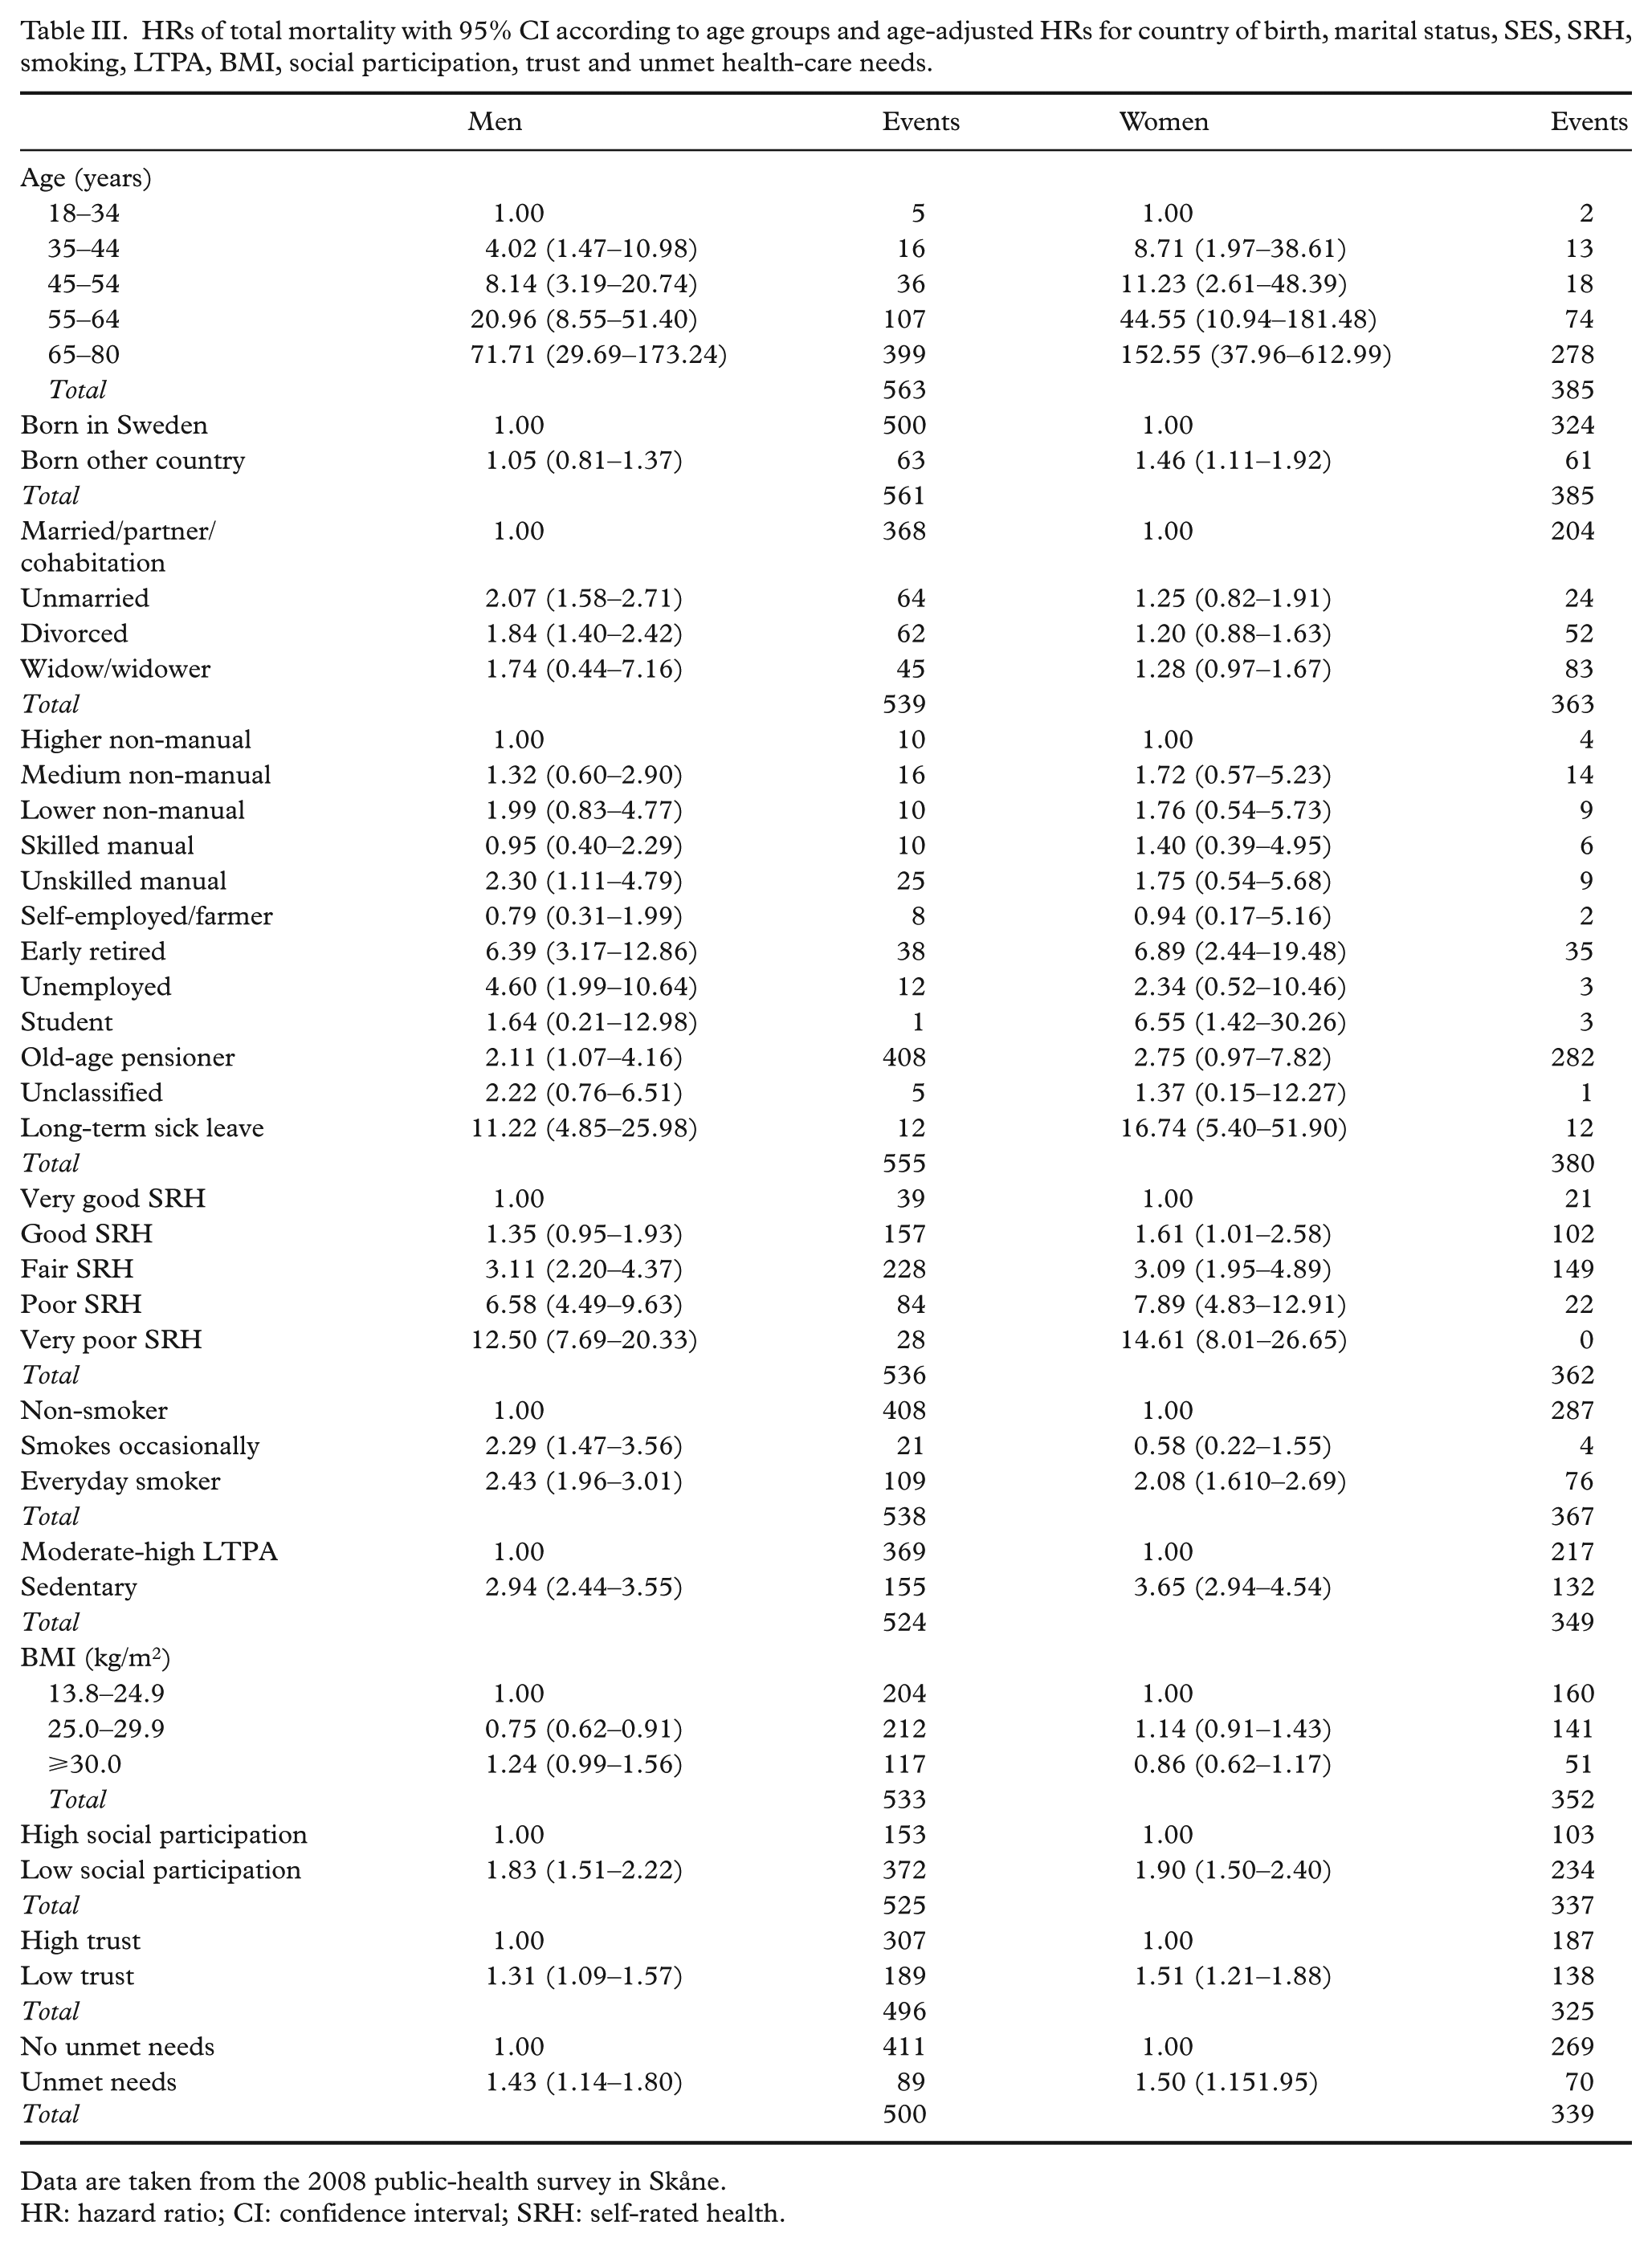
Data are taken from the 2008 public-health survey in Skåne.
HR: hazard ratio; CI: confidence interval; SRH: self-rated health.
Country of birth was dichotomised into ‘born in Sweden’ and ‘born in a country other than Sweden’.
Marital status was determined with the question: ‘What is your civil status?’ Response options were ‘married, registered partnership, or cohabiting’, ‘unmarried’, ‘divorced’ and ‘widow/widower’.
SES by occupation was divided into 12 categories: higher non-manual employees, medium-level non-manual employees, low-level non-manual employees, skilled manual workers, unskilled manual workers, self-employed/farmers, early retired (before the age of 65 years, for health reasons or entitlement), unemployed, students, old-age pensioners (older than 65 years), unclassified and those on long-term sick leave.
Self-rated health was assessed with the question: ‘How do you consider your general health status?’ There were five response options: ‘very good’, ‘good’, ‘neither good nor poor’, ‘poor’ and ‘very poor’.
Smoking contained three options: ‘non-smoker’, ‘intermittent/non-daily smoker’ and ‘daily smoker’.
Leisure-time physical activity (LTPA) was assessed from four alternatives, where the first alternative, less than two hours of easy to moderate activity per week, indicated sedentary leisure time and the other three, categorising more than two hours of physical activity per week, indicated physically active leisure time.
Body mass index (BMI) was a continuous variable with values between 13.68 and 73.96 kg/m2. The values were divided into three groups: underweight and normal weight (BMI 13.68–24.99 kg/m2), overweight (25.00–29.99 kg/m2) and obese (BMI ⩾30.00 kg/m2).
Social participation during the past year involved how active the person was in formal and informal groups in society. Participation in three or fewer of 13 alternatives indicated low social participation [14].
Generalised trust in other people (horizontal trust) was self-reported and was assessed by the item: ‘Generally, I can trust other people’. There were four response options: ‘do not agree at all’, ‘do not agree’, ‘agree’ and ‘completely agree’. It was dichotomised into low trust (the first two alternatives) and high trust (the latter two responses).
Statistics
Prevalence (%) of age, country of birth, marital status, SES, tobacco smoking, LTPA, BMI, social participation, trust, self-rated health and unmet health-care needs were calculated, stratified by sex (Table I). Reasons for not seeking health care are presented as frequencies (%) of those with unmet health-care needs, stratified by sex (Table II). A Kaplan–Meyer graph showed proportionality when comparing unmet and no unmet health-care needs with regard to mortality. Analyses were run using Cox proportional hazard models. Hazard ratios (HRs) of mortality with 95% confidence intervals (CI) were calculated for all variables stratified by sex, for the time period studied (from 27 August 2008 to 31 December 2013; Table III). Crude and multi-adjusted HRs (95% CI) were calculated for all deaths and the three subgroups – CVD, cancer and other deaths – for the age intervals 18–80, 18–64 and 65–80 years (Table IV). All analyses were unweighted.
Crude, sex-adjusted and multiple adjusted HRs (95% CI) of mortality when having unmet health-care needs.
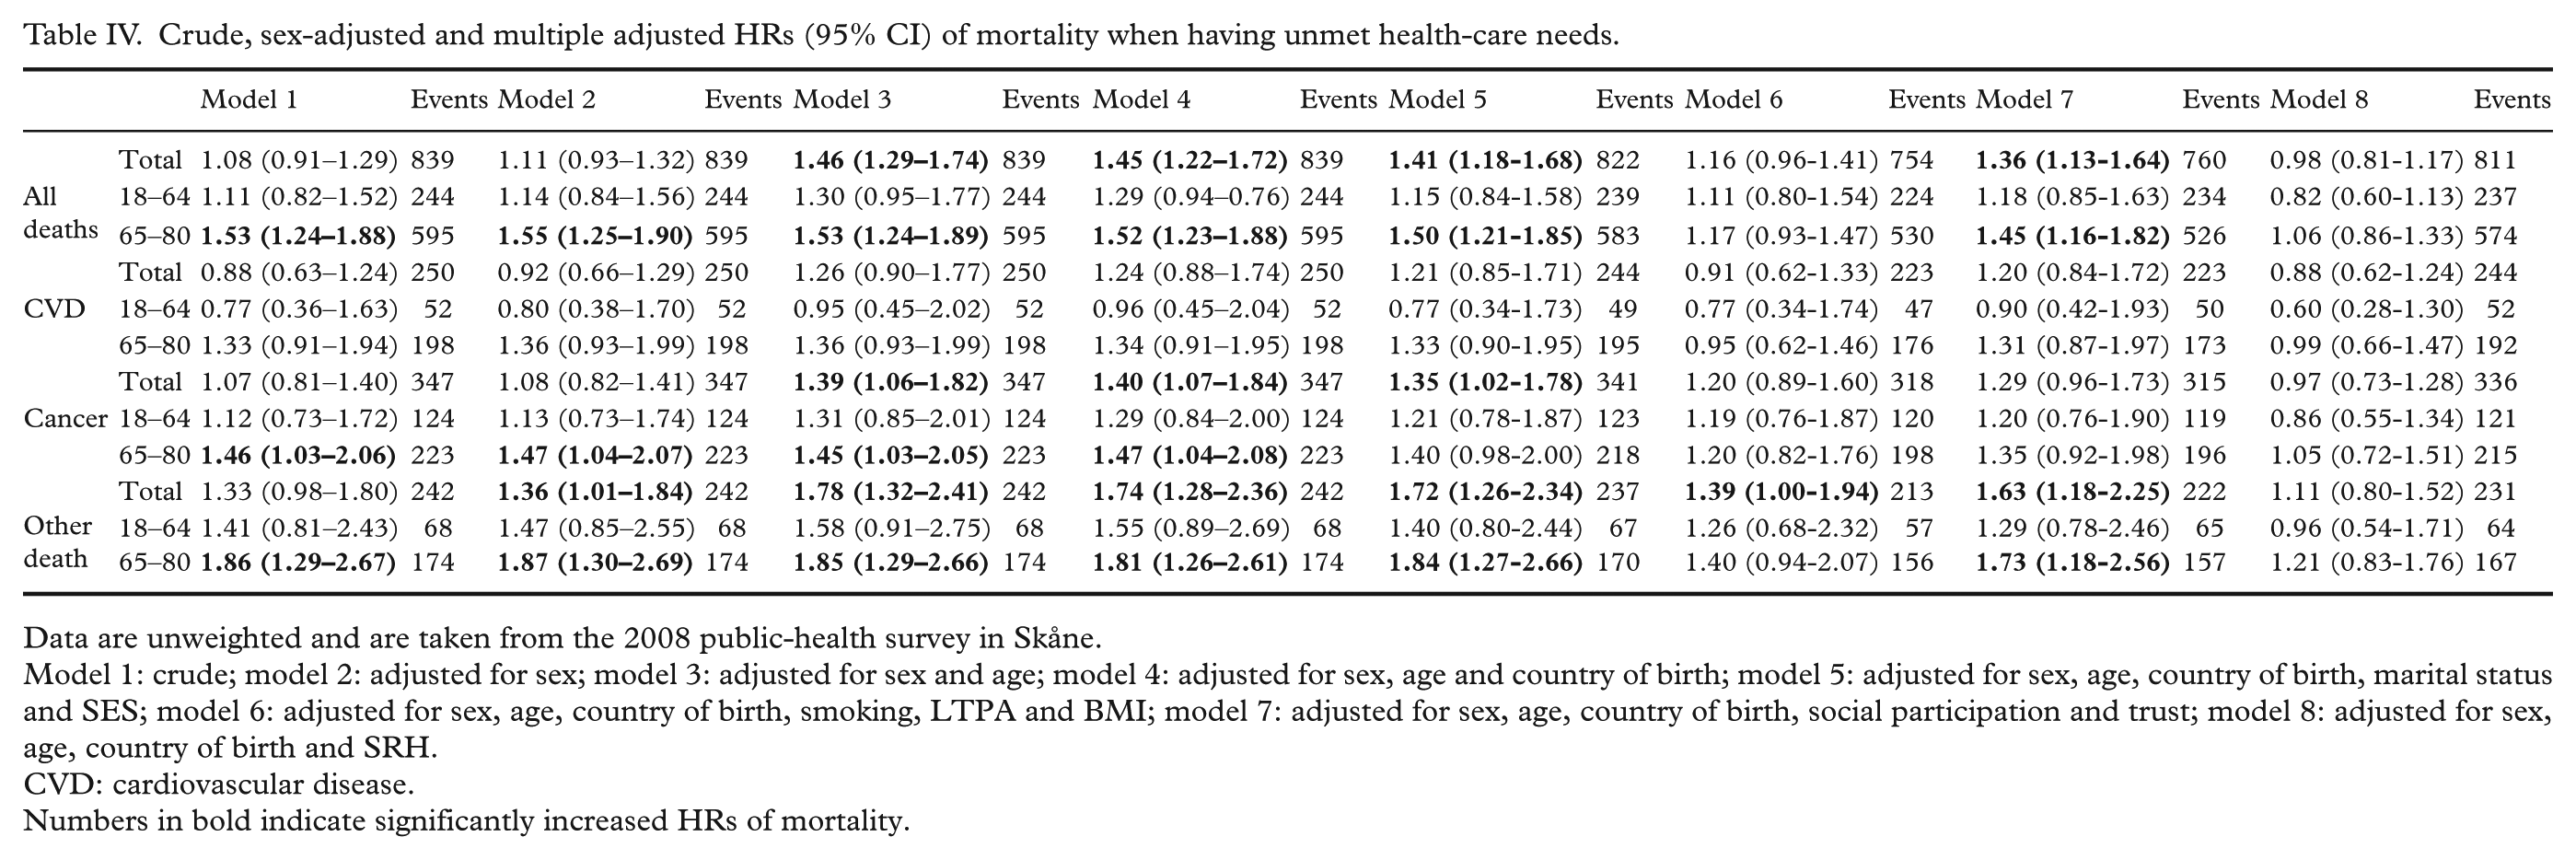
Data are unweighted and are taken from the 2008 public-health survey in Skåne.
Model 1: crude; model 2: adjusted for sex; model 3: adjusted for sex and age; model 4: adjusted for sex, age and country of birth; model 5: adjusted for sex, age, country of birth, marital status and SES; model 6: adjusted for sex, age, country of birth, smoking, LTPA and BMI; model 7: adjusted for sex, age, country of birth, social participation and trust; model 8: adjusted for sex, age, country of birth and SRH.
CVD: cardiovascular disease.
Numbers in bold indicate significantly increased HRs of mortality.
The statistical analyses were performed using IBM SPSS for Windows v25 (IBM Corp., Armonk, NY).
Results
Table I shows the prevalence (%) of age groups, born in Sweden or other country, marital status, SES by occupation, self-rated health, smoking status, LTPA, BMI, social participation, generalised trust and unmet health-care needs.
Table II lists the frequencies (%) of reasons for not seeking health care among those with unmet health-care needs.
Table III demonstrates the HRs of mortality in bivariate analyses with 95% CI according to age groups and age-adjusted HRs for all other variables. For men and women, the HRs increased significantly with age, poorer self-rated health, everyday smoking, sedentary life-style, low social participation, low trust and unmet health-care needs. The SES groups early retired, unemployed and people on long-term sick leave had a higher risk of mortality. Female students also had a significantly higher HR, despite only accounting for three events. The mortality risk did not differ between Swedish-born and foreign-born men, while women born outside Sweden had significantly higher mortality compared to Swedish-born women.
Table IV shows significantly increased HRs with underlying unmet health-care needs for all deaths, cancer and other deaths, but not for CVD. This was also the case when adjusting for sex, age and country of birth. The older population (those aged 65–80 years) had significantly higher HRs, while the result was non-significant in the age group 18–64 years. After adjusting for behavioural confounders and self-rated health, the HRs were attenuated to close to 1.
Discussion
Unmet health-care needs were strongly associated with mortality for total deaths, cancer and other deaths, but not CVD, particularly for the older population (those aged 65–80 years). While the increased mortality risk remained after adjusting for sex, age and country of birth, as expected, the significance attenuated when adjusting for risk behaviours (model 6) and self-rated health (model 8). It can be speculated that adding several risk behaviours into the formula will over-adjust the association, which for some CVD age groups resulted in a negative risk, and that self-rated health itself is a powerful predictor of mortality, hence also resulting in a negative association. The only exception, which remained elevated despite adjusting for risk behaviours, was other deaths. Since this is a heterogenous group of causes of death, it is difficult to determine the underlying reason.
Women born outside Sweden had significantly higher HRs of mortality compared to women born in Sweden, which indicates that foreign-born women may experience more barriers in accessing health care. This study does not investigate the reasons behind this further, and the causes can therefore only be speculated (e.g. language barriers where non-Western women often depend on interpreters or their spouses when accessing health care, or cultural differences in presenting symptoms). In addition, the fact that the response rate differs significantly (31.1% of those born outside Europe compared to 56.5% of those born in Sweden) may also affect the results.
Analyses stratified for men and women show a similar pattern for ages 18 –80: HR=1.10 (95% CI 0.87 –1.38) crude and HR=1.43 (95% 1.14 – 1.80) age adjusted for men, and HR=1.12 (95% 0.86 – 1.46) crude and HR=1.50 (95% 1.15 –1.95) age adjusted for women. Due to a limited number of events and similar incidence levels, men and women were collapsed in Table III. The incidence (death per 100,000) is similar to the national statistics from the National Board of Health and Welfare 2013 [18]. Although too few events to be significant, neurological causes of deaths (N=29) adjusted for age and sex had a HR of 2.02 (95% 0.74–5.51) of mortality with underlying unmet health-care needs, and the suicide group (N=21) a HR of 2.43 (95% 0.92–6.42).
The mortality subgroups cancer and other deaths had the highest risk of mortality with underlying unmet health-care needs, while no increase in HR was seen for the CVD group. This could be due to the chronic nature of the diseases where patients have increased health-care needs and therefore are more likely to experience barriers and exhaustion towards the health-care system.
Chronic conditions are more prevalent in the older population. It could therefore be assumed that older patients access health care more often and are more likely to develop unmet health-care needs. However, this survey and the survey from 2012 showed that people aged 65–80 years in fact have the lowest unmet health-care needs [4].
Longitudinal studies on unmet health-care needs and mortality are scarce. More research has been conducted on the relationship between health-care expenditure and longevity. Research has shown an association between higher spending on health care by governments, mostly assessed by percentage of gross domestic product (GDP), and better health outcomes such as life expectancy [19]. The paradox is the USA, which despite having the highest health expenditure (17% of GDP in 2015) only ranked 42nd in life expectancy in 2016 [20]. Several explanations why higher health-care spending does not necessarily generate better health outcomes have been proposed, such as over-reliance on private financing [21], disparities in quality of care [22], high medical expenses [23], too few primary-care providers [24] and lower social spending [25].
The baseline for this longitudinal study is 2008 – the year when the economic crisis affected Europe and most of the Western world. Between 2010 and 2014, several EU countries dramatically reduced their health-care spending as a result of the economic crisis. However, Sweden’s health-care expenditure steadily increased during these years and even increased dramatically between 2010 and 2011 [26]. Studies have shown that crises increase health inequalities, which is often measured as socio-economic inequalities [27], but these findings have not been confirmed in the Nordic countries [28]. We thus do not assume that the economic crisis that took place around the time of the survey affected unmet health-care needs or mortality significantly.
According to the European SILC survey, Sweden has higher unmet health-care needs than the European average (9.2% vs. 6.7%) [2]. The Skåne population in this study demonstrates even higher unmet health-care needs than the Swedish average in the cross-country survey. However, the two surveys differ in how the questions pertaining to unmet needs are composed and use different time windows. The question pertaining to unmet needs in the SILC survey also translates somewhat differently between countries. In the UK SILC survey asks whether the responder did not receive medical care, while the Swedish SILC questionnaire asks whether the responder did not seek it [29]. Any conclusions that Swedes have higher unmet needs than most Europeans and that patients in southern Sweden have higher unmet needs than Sweden overall may therefore be erroneous.
Strengths and limitations
The study population is large. The study was a random, weighted sample of the population, which gives a representative view of the general population. The total participation rate was 54.1% after reminders. The non-response analysis showed that women, older people, people born in Sweden, those who were married, those with a higher income and those with a higher level of education responded to a somewhat greater extent. The mortality rate across age intervals in this study was similar to national data [18]. The risk of selection bias is thus limited. The study is longitudinal, which facilitates causal inference.
The item investigating unmet health-care needs is subjective and asks whether the respondent in the last three months considered themselves to be in need of medical care by a physician but did not seek it. The question does not take into account whether the respondent actually experienced barriers to health care or just decided to wait and see if symptoms disappeared. The time window is also fairly small (three months), and therefore only deals with the respondent’s refrainment from health care in the months preceding the questionnaire.
Conclusions
Unmet health-care needs in Skåne are associated with higher total, cancer and all other cause mortality, but not with CVD mortality, particularly in the older population (those aged 65–80 years), while being non-significant in the age group 18–64 years. Adjusting for self-rated health and behavioural factors attenuated the HR to <1, suggesting that people with poor self-rated health and behavioural risk factors have higher mortality and/or seek health care more frequently and have higher unmet health-care needs. This study may indicate problems in assessing cancer treatment for the elderly, while a larger material/longer follow-up period is needed to make conclusions about certain specialty areas (e.g. neurological and psychiatric causes of death).
Footnotes
Declaration of conflicting interests
The author(s) declared no potential conflicts of interest with respect to the research, authorship, and/or publication of this article.
Funding
The author(s) disclosed receipt of the following financial support for the research, authorship and/or publication of this article: this study was supported by the Swedish Research Council grant K2014-69X-22427-01-4, and the Swedish ALF Government Grant Dnr M 2014/354.