






Abstract
This study numerically examined the propellant flow from gunfire using the kω-SST turbulence model and their sound attenuation using the Ffowcs-Williams and Hawkins equations (FW-H). For simulation, a pressure-based solver and 3D axisymmetric geometry were used. The second-order implicit time approach and the second-order upwind scheme spatial discretization were used in the simulation. The maximum exit pressure was 3.748 MPa for the suppressor with a length of 70 mm and diameter of 20 mm. However, when the diameter suppressor increased by 1/6, the maximum exit pressure was reduced to 3.4961 MPa. When the length increased by 1/6, the maximum pressure became 3.3636 MPa. Lastly, when the diameter and length were increased by 1/6, the maximum exit pressure became 3.177 MPa. For this suppressor, 20.835 dB (12.29%) sound pressure level attenuation was achieved with 16.823 MPa (84.115%) overpressure reduction and 484.86 K or 32.32% temperature reduction. Generally, the attenuation increased with the increase in the suppressor’s internal volume.
Introduction
Sound is a change in pressure, density, and temperature propagating through a medium like air or water. The speed of sound is mainly determined by the medium through which the waves propagate and environmental conditions. Since the nineteenth century, overpressure suppression devices for firearms have been known and used. In 1902, American inventor Hiram Percy Maxim invented and sold the first commercially successful suppressor. 1
The ignition when the gun is fired creates high temperatures and high pressure. This high-pressure wave generates a muzzle blast wave of high-intensity sound pressure. 2 The noise level rises as the gun system's muzzle energy increases. The study of sound levels at different distances from the gun firing place confirmed that impulsive noise created by the propellant gas could be noticed from ten miles distance. 3 Suppressors are used to reduce the noise generated by the muzzle blast. For maximum efficiency, the suppressor must be specially designed to allow the weapon gases to expand in the chambers.
According to Maccarthy et al., 4 using suppressors has several advantages. Such as hearing loss and tinnitus prevention, increased accuracy (in many but not all cases), limiting the capacity of the weapon to blow on shooting and affecting the discharge of gas in the wake of a leaving projectile, and a decrease in perception recoil (by up to 40%), and little interruptions to livestock, particularly hunting animals. The disadvantages mentioned in this study are the possibility of falling on criminals, the additional cost and weight of the Silencer, shifting the centre of gravity further away from the weapon user, and an undesirable moment of force.
Flow phenomena like compression waves, expansion waves, shear layers, shocks, and pressure waves complicate the fluid flows around the muzzle of a gun barrel5,6 as muzzle energy increases, impulse noise increases. 6
Hudson et al. 1 studied suppressors with one straight baffle using the Navier-Stokes equation as the governing equation, a multispecies chemically reacting gas as a firing gas. Rehman et al. 7 also studied suppressors with three straight baffles using the same method as Hudson et al. 1 Both studies observed significant overpressure reduction and sound pressure level attenuation. Clear et al. 8 applied the CFD method in 2-D to study the explosion in a small calibre gun. Because the main propellant flow of CFD results did not match, the study recommended using axisymmetric and 3-D grids when possible.
Lee et al. 9 performed a firing test and CFD analysis for a 40 mm suppressor. The CFD result agreed with the results of the shooting test. Zhao et al. 10 also used CFD and CAA to study suppressors. Hristov et al. 6 used the unsteady κ-ε turbulence model for overpressure reduction for the small calibre analysis, and a 74% reduction was achieved. According to studies by Lister 11 and Arslan et al., 12 the baffles’ geometry, the number of baffles, and the baffles’ position influence the mufflers’ performance.
In the transportation sector, noise from the exhaust is a difficult issue. A study by Mohamad in 2019 covered new techniques of muffler design and the most recent advancement in exhaust systems. The chamber and PPiP diameter, the principal diameter of the perforated tube holes, are among them. In this study, a Reynolds-averaged Navier-Stokes (RANS) simulation was used for an initial statistically steady turbulent flow. The Ffowcs Williams-Hawking (FW-H) acoustic analogy was used to forecast the muffler’s radiated far-field noise. By combining the FEA method with the two-load experiment method, the research conducted introduced an effective method to study the transmission loss of a hybrid silencer. The effect of the structure characteristics, including absorptive materials, on the acoustical performance of the silencer was studied, and the structure parameters optimization was obtained. Hybrid methods based on the integration of 1D modelling and 3D tools had been investigated to demonstrate flow effects on engine exhaust chamber acoustic level. Transfer matrix method (TMM) technique was used in the study. The study's findings suggested that using sound-absorbing material could lower SPL by 15% to 20%.13–15
For automotive engines, Vasiraja and Saravana Sathiya Prabhahar 16 designed a muffler with perforated inner pipes and nozzles to reduce the sound pressure level. The investigation looked at the effect of convergence angle and nozzle number. Artūras et al., 17 examined various gun suppressors by varying the angle of the baffles’ inclination from 60° to 135°. The study emphasised three acoustic properties: sound pressure, spectrum distribution of sound pressure, and zonal suppression efficacy. Min-Chiu and Chang, 18 investigated an internally located multi chamber silencer with expansion cones and perforated pipe ducts to improve the acoustic performance of pistol silencers. The purpose of this study is to present an optimal design technique for gun mufflers using the Finite Element technique (FEM), Artificial Neural Network, and Genetic Algorithm. Generally, the simulated results from the three studies showed that the properly formed gun silencer may effectively reduce the gun’s shooting noise.16–18
When a propellant gas is in a turbulent flow, parameters like pressure, temperature, velocity density, and specific entropy continuously change. Experiment research findings are costly and do not demonstrate the detailed fluctuation of the fluid flow, nor do they sufficiently reproduce the evolution and diffusion of the firing acoustic field. Most numerical analyses on this topic are focused on only acoustics by FEM. This study investigated the effects of changing suppressor volume in overpressure reduction and acoustic attenuation using the hybrid CFD-CAA method.
Materials and methods
This study designed four different-sized suppressors with five curved baffles. First, the base suppressors with a diameter and length of 20 × 72 were modelled. Then the diameter of the suppressor was increased by 1/6 by keeping the length and the number of baffles types constant. Thirdly, the length of the suppressor was increased by 1/6, keeping the diameter and the number of baffles types constant. Lastly, both the diameter and length of the suppressor were increased by 1/6, keeping other parameters like time type and the number of baffles constant. As the selected geometries are suitable for symmetry boundary conditions, half of the geometry was used in the study to minimize the computational cost. A schematic representation of the suppressor model investigated in this study is given in Figure 1. Suppressor detail dimension.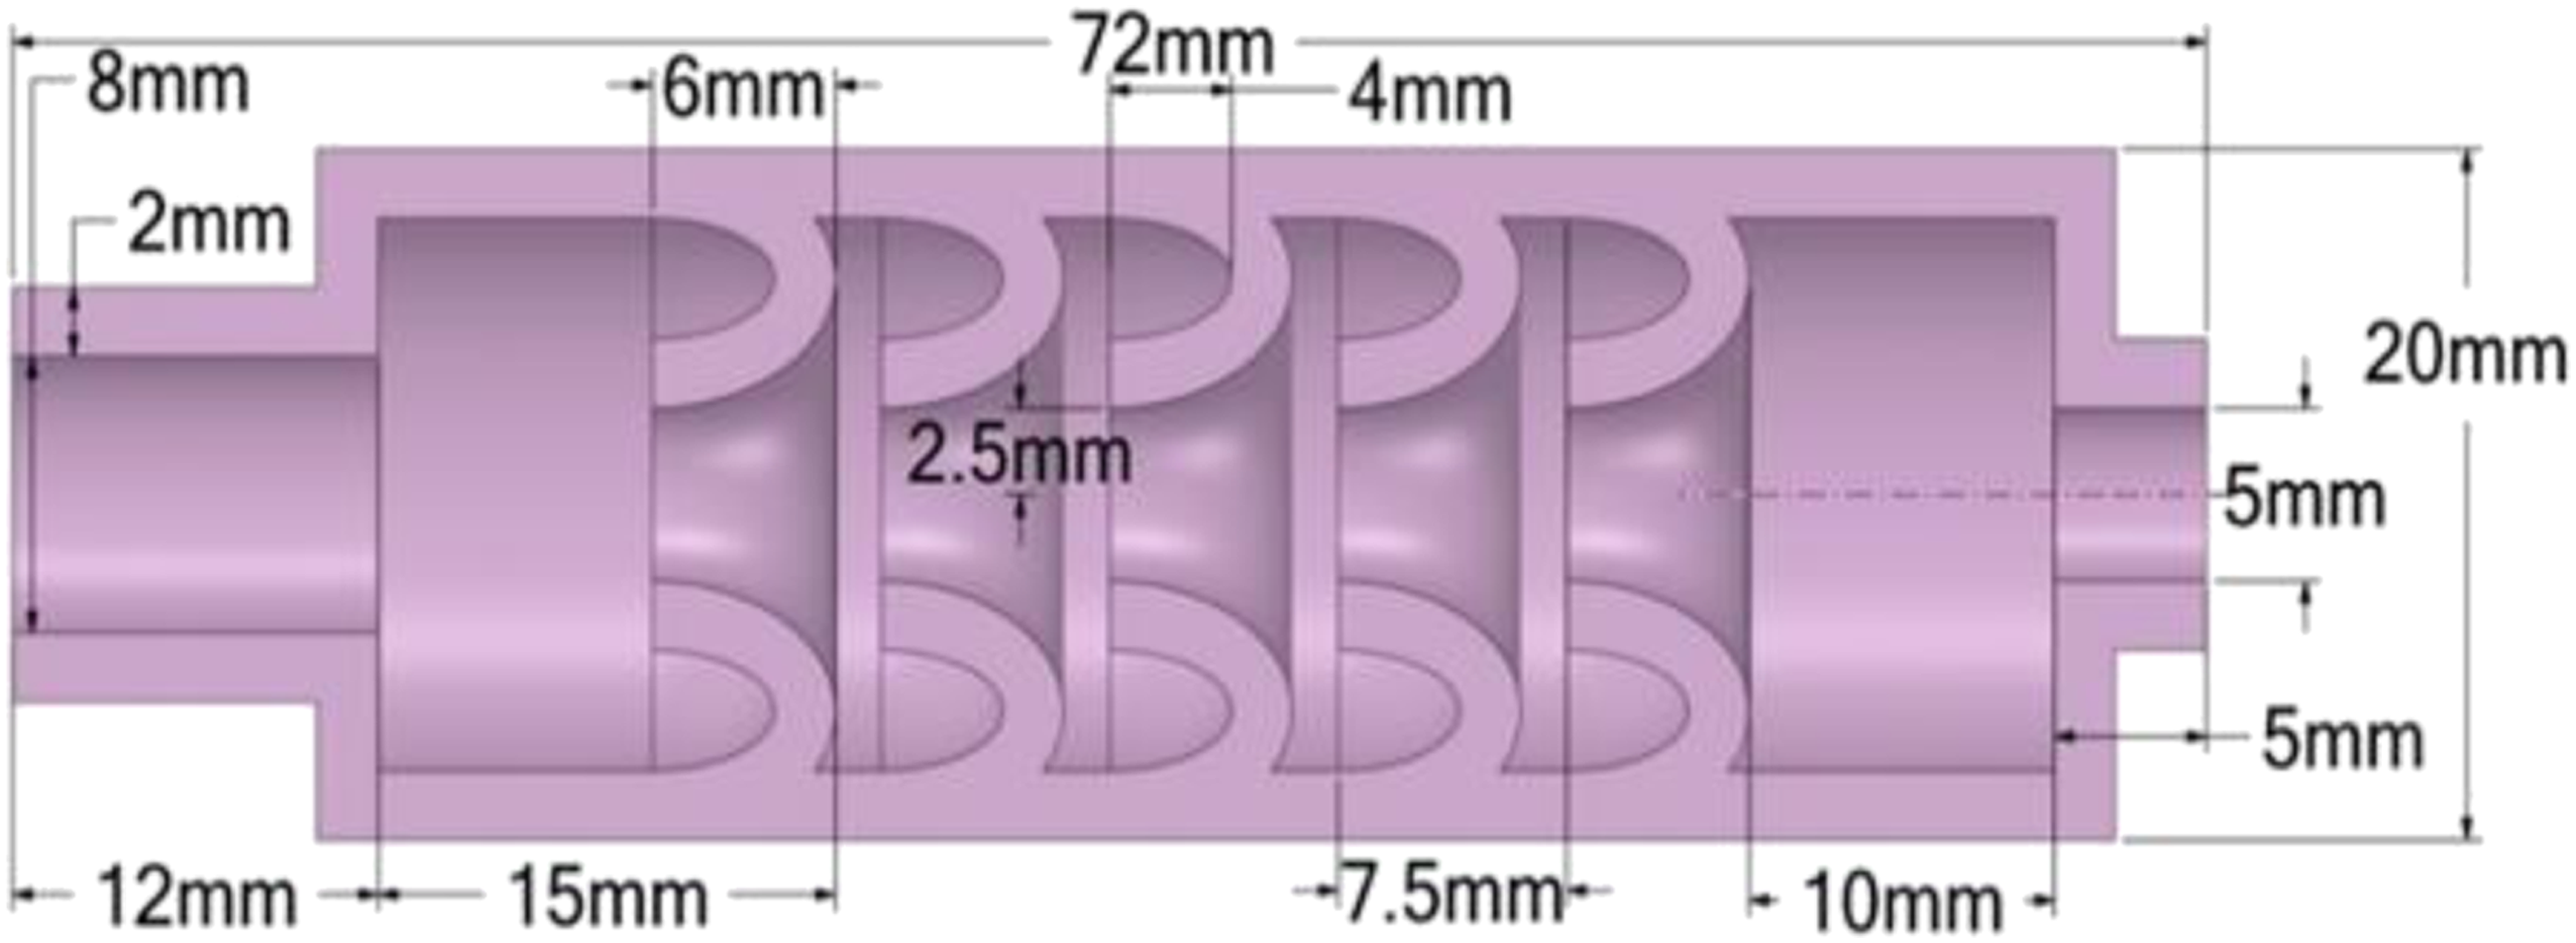
For all geometries, a fluid body was introduced for both suppressor flow and far-field flow to analyze the blast wave outside the suppressor. The analysis was made by keeping the far-field control volume and boundary condition constant and changing the suppressor’s size. The far-field control volume was 425 mm by 90 mm in length and diameter, respectively. From the total length, 25 mm was for backflow. A separate mesh was done for different regions of the flow.
The finite element method and the finite volume method
Differential equations arising in heat transfer and fluid dynamics problems can be solved using the FEM and the FVM. The geometric region of the issue (on which a differential equation is to be solved) is represented as a group of subregions, known as a mesh or a grid, in both the FEM and the FVM. These subregions are known as finite elements in the FEM, and each element has an associated interpolation function defined on it.
A node is normally deployed at the geometric centre of each control volume, which is how the FVM divides the domain into control volumes. By discretizing flux balance equations (namely, mass, momentum, or energy) over each control volume that surrounds the node, discretization equations are produced at each node. Unlike the FVM, where the discretized equations for each control volume include the nodal values of control volumes that are close to the control volume being considered, the discretized equations over a finite element in the FEM only involve the nodal values of that element.
Sensitivity of the meshes
A trial-and-error mechanism was performed using several meshes and simulations until mesh independence was achieved. Body size, inflation, mesh refinement, Multizone mesh method, and mesh adoption were applied to obtain a good quality mesh. The average orthogonal mesh quality was more than 0.92 for all geometries. The change of the maximum exit pressure according to the number of mesh elements is shown in Figure 2. Maximum exit pressure versus number of mesh elements.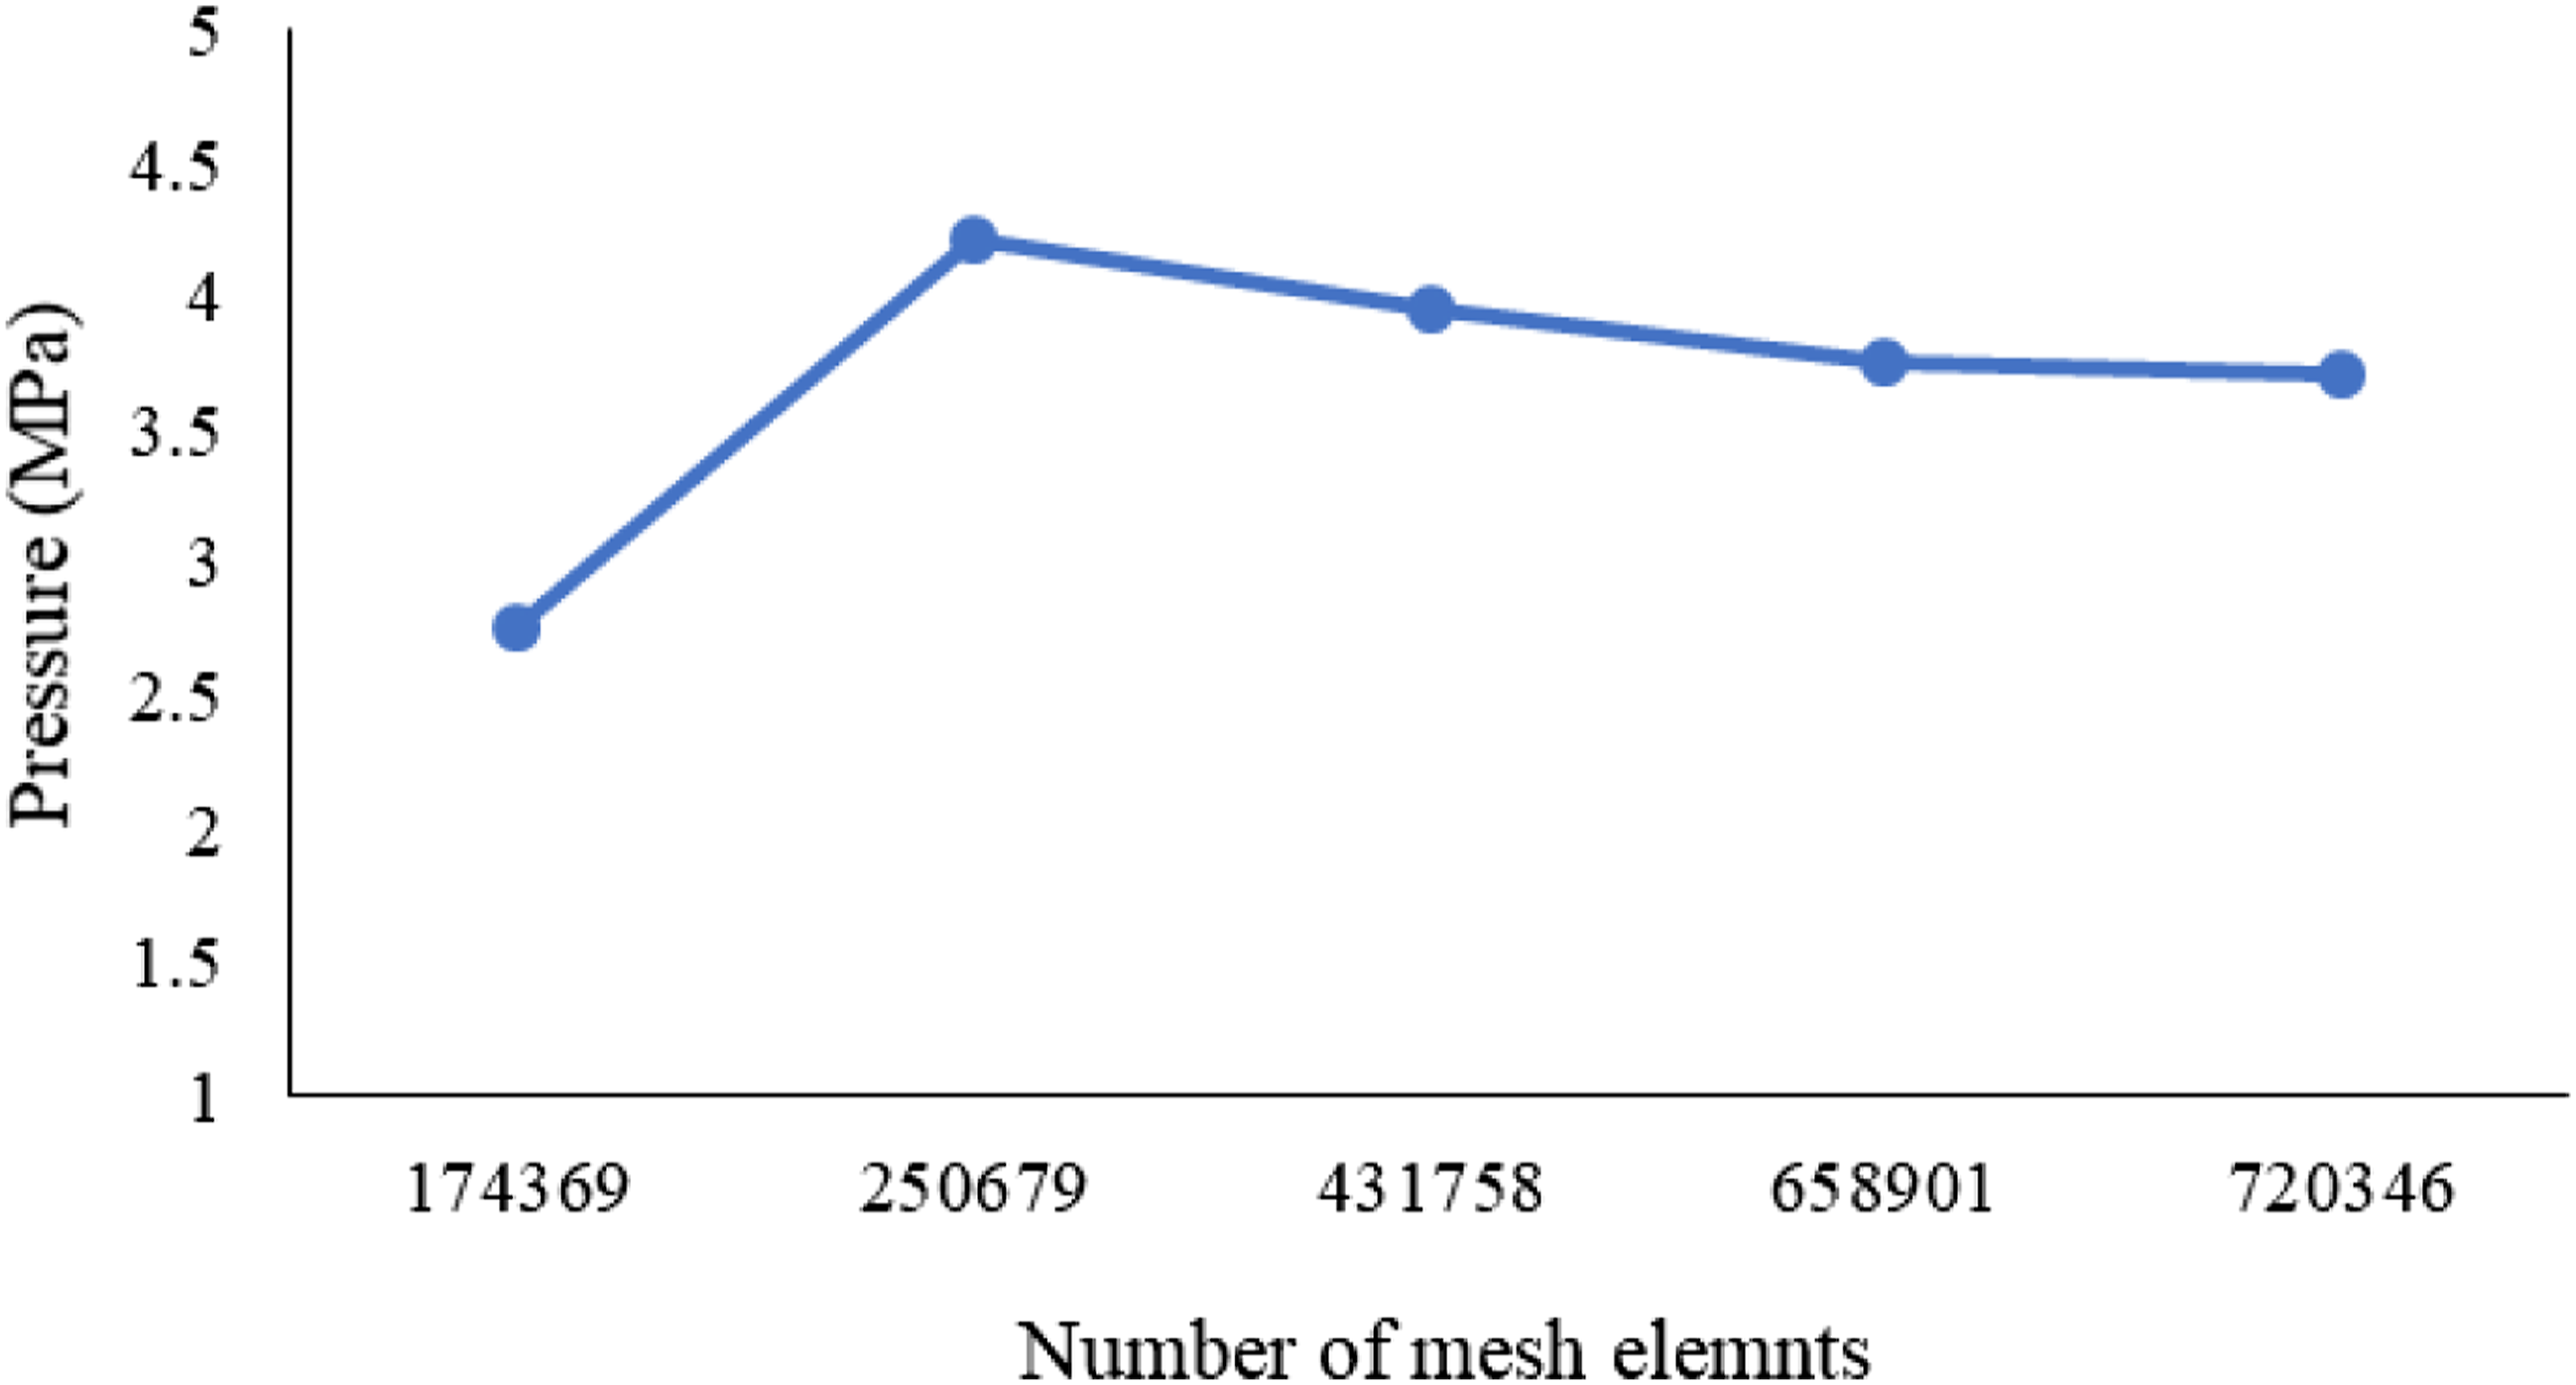
The overpressure when the number of mesh elements is 658,901 is 3.82 MPa and when the number of mesh elements is 720,346 the overpressure at the outlet of the suppressor is around 3.81 MPa. After this, the increase in the number of mesh elements will not have too much effect on the result of overpressure.
Figure 3 shows the mesh structure used. Mesh structures starting from faces were created with 20 inflation meshes and an initial layer thickness of 0.00,011,448 mm, which was determined with the y+ calculator to achieve y+=1. Two different local scalings were used to consider the essential parts separately. The fluid inside the suppressor was mashed with a grid size of 0.7 mm. The grid size for the fluid in the middle of the far-field control volume was 0.9 mm. Global meshing was used with an element size of 1.5 mm and adaptive sizing. The meshing of suppressor fluid.
Time step size
Kω-SST was first performed for the fluid flow analysis using commercial software Fluent in obtaining instantaneous fluid data. Next to CFD, CAA analysis was done by Ffowcs-Williams and Hawking’s equation (FW-H) to construct the combustion noise source from the Kω-SST data.
It has been observed that similar studies in the literature6,11,19 have used ideal gas air for such cases. Therefore, ideal gas air was chosen as the material in this study. Pressure and temperature of 20 MPa and 1500 K were used as inlet boundary conditions, while for the far-field outlet boundary conditions, the atmospheric condition of 1 atm and 300 K were used. After several trials, an optimum time step size of ΔT = 1.5 × 10⁻⁶ second was selected for this study. The change of exit pressure with the time step is given in Figure 4. Pressure versus time graph of time for time-independent analysis.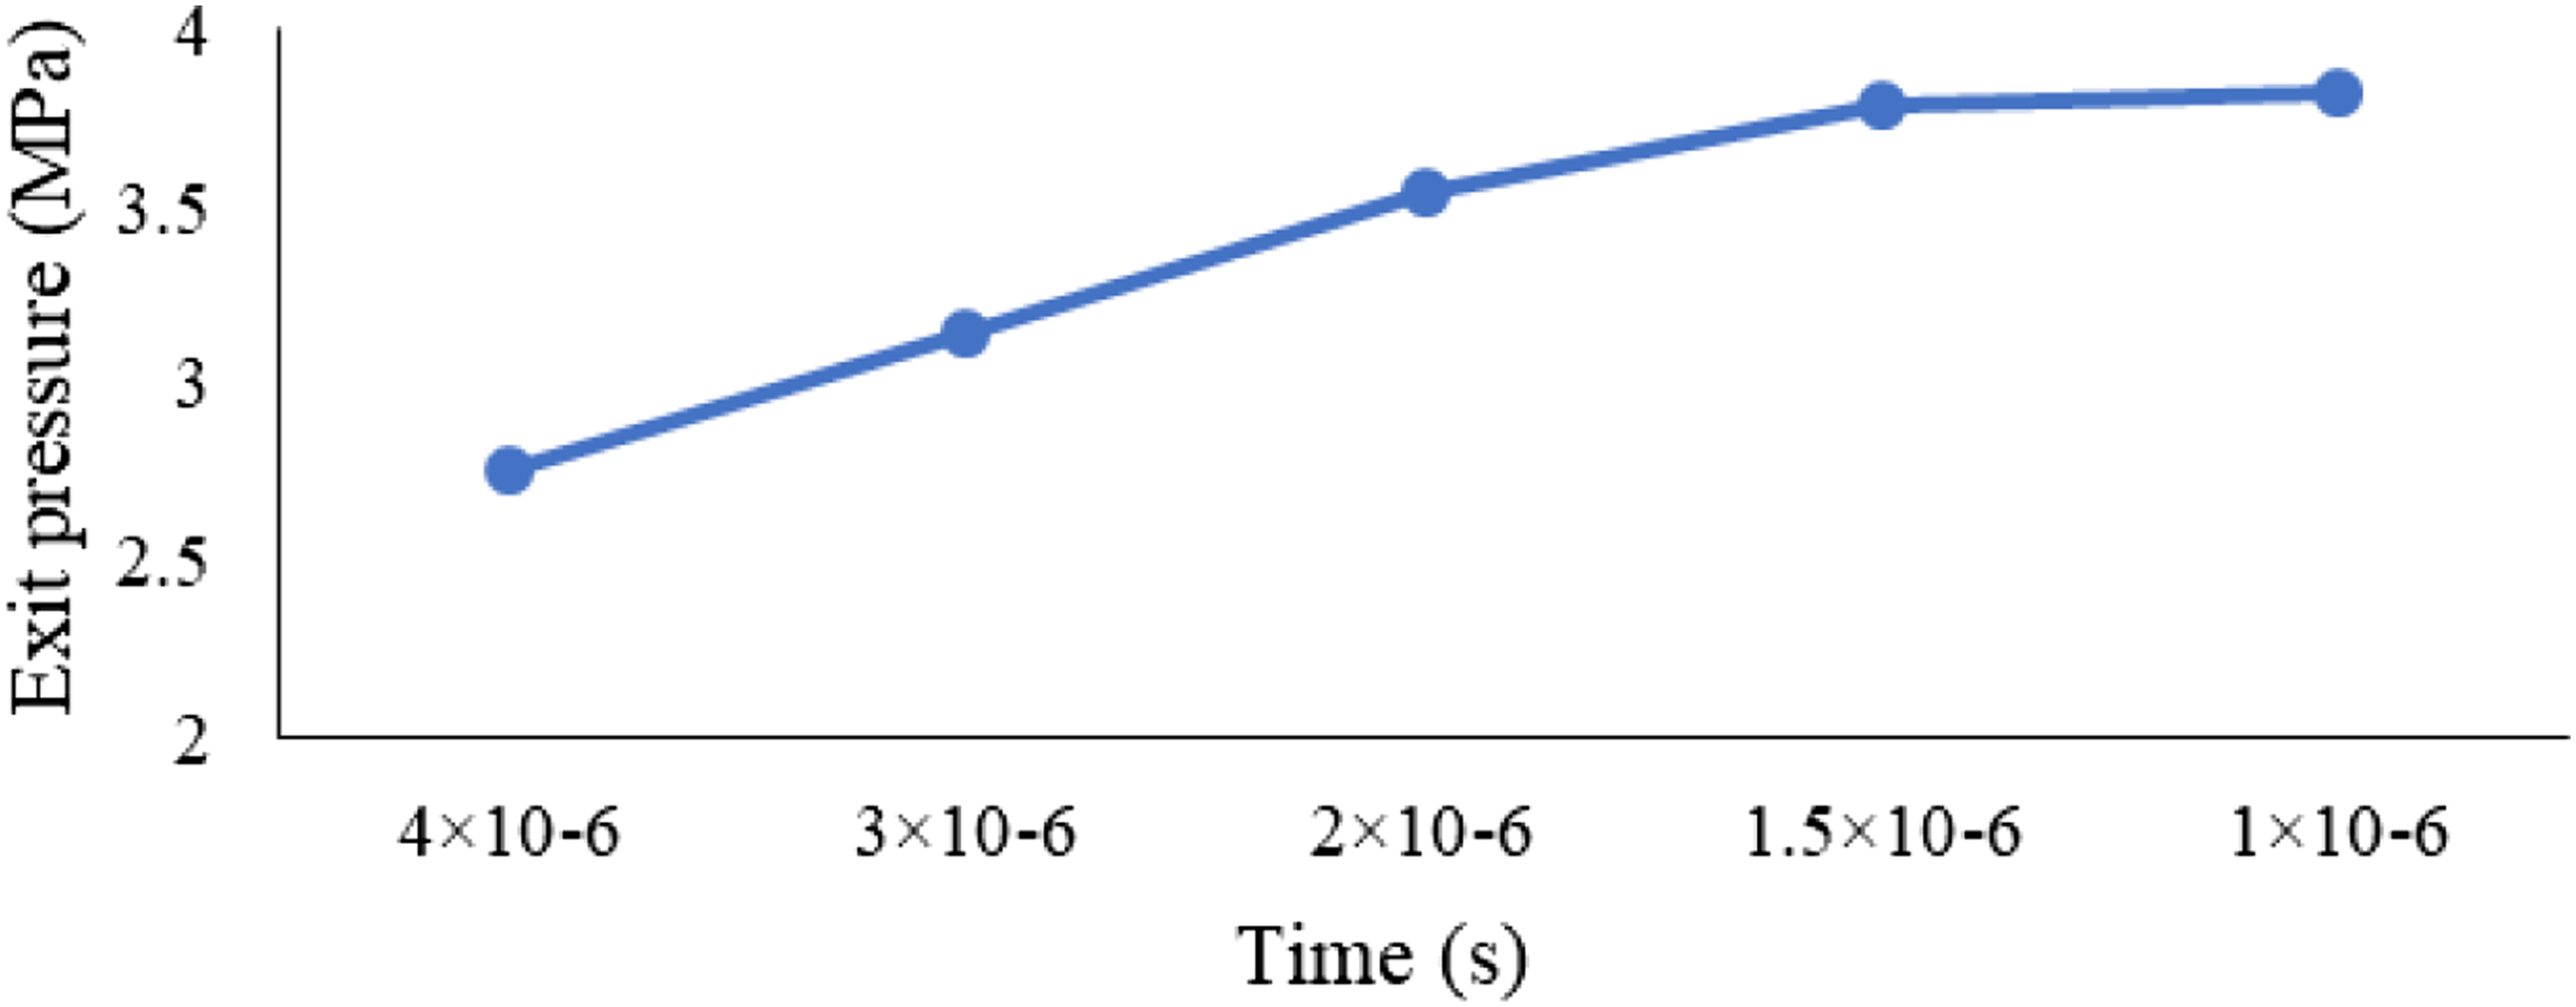
Validation
The validation analysis was done for the acoustic analysis by comparing the numerical result of the experimental development results made by Bozdemir.
20
The acoustic validation analysis was done for both unsuppressed and suppressed conditions with 72 × 20 suppressors. The results of both studies are shown together in Figure 5. Average sound amplitude with and without the suppressor.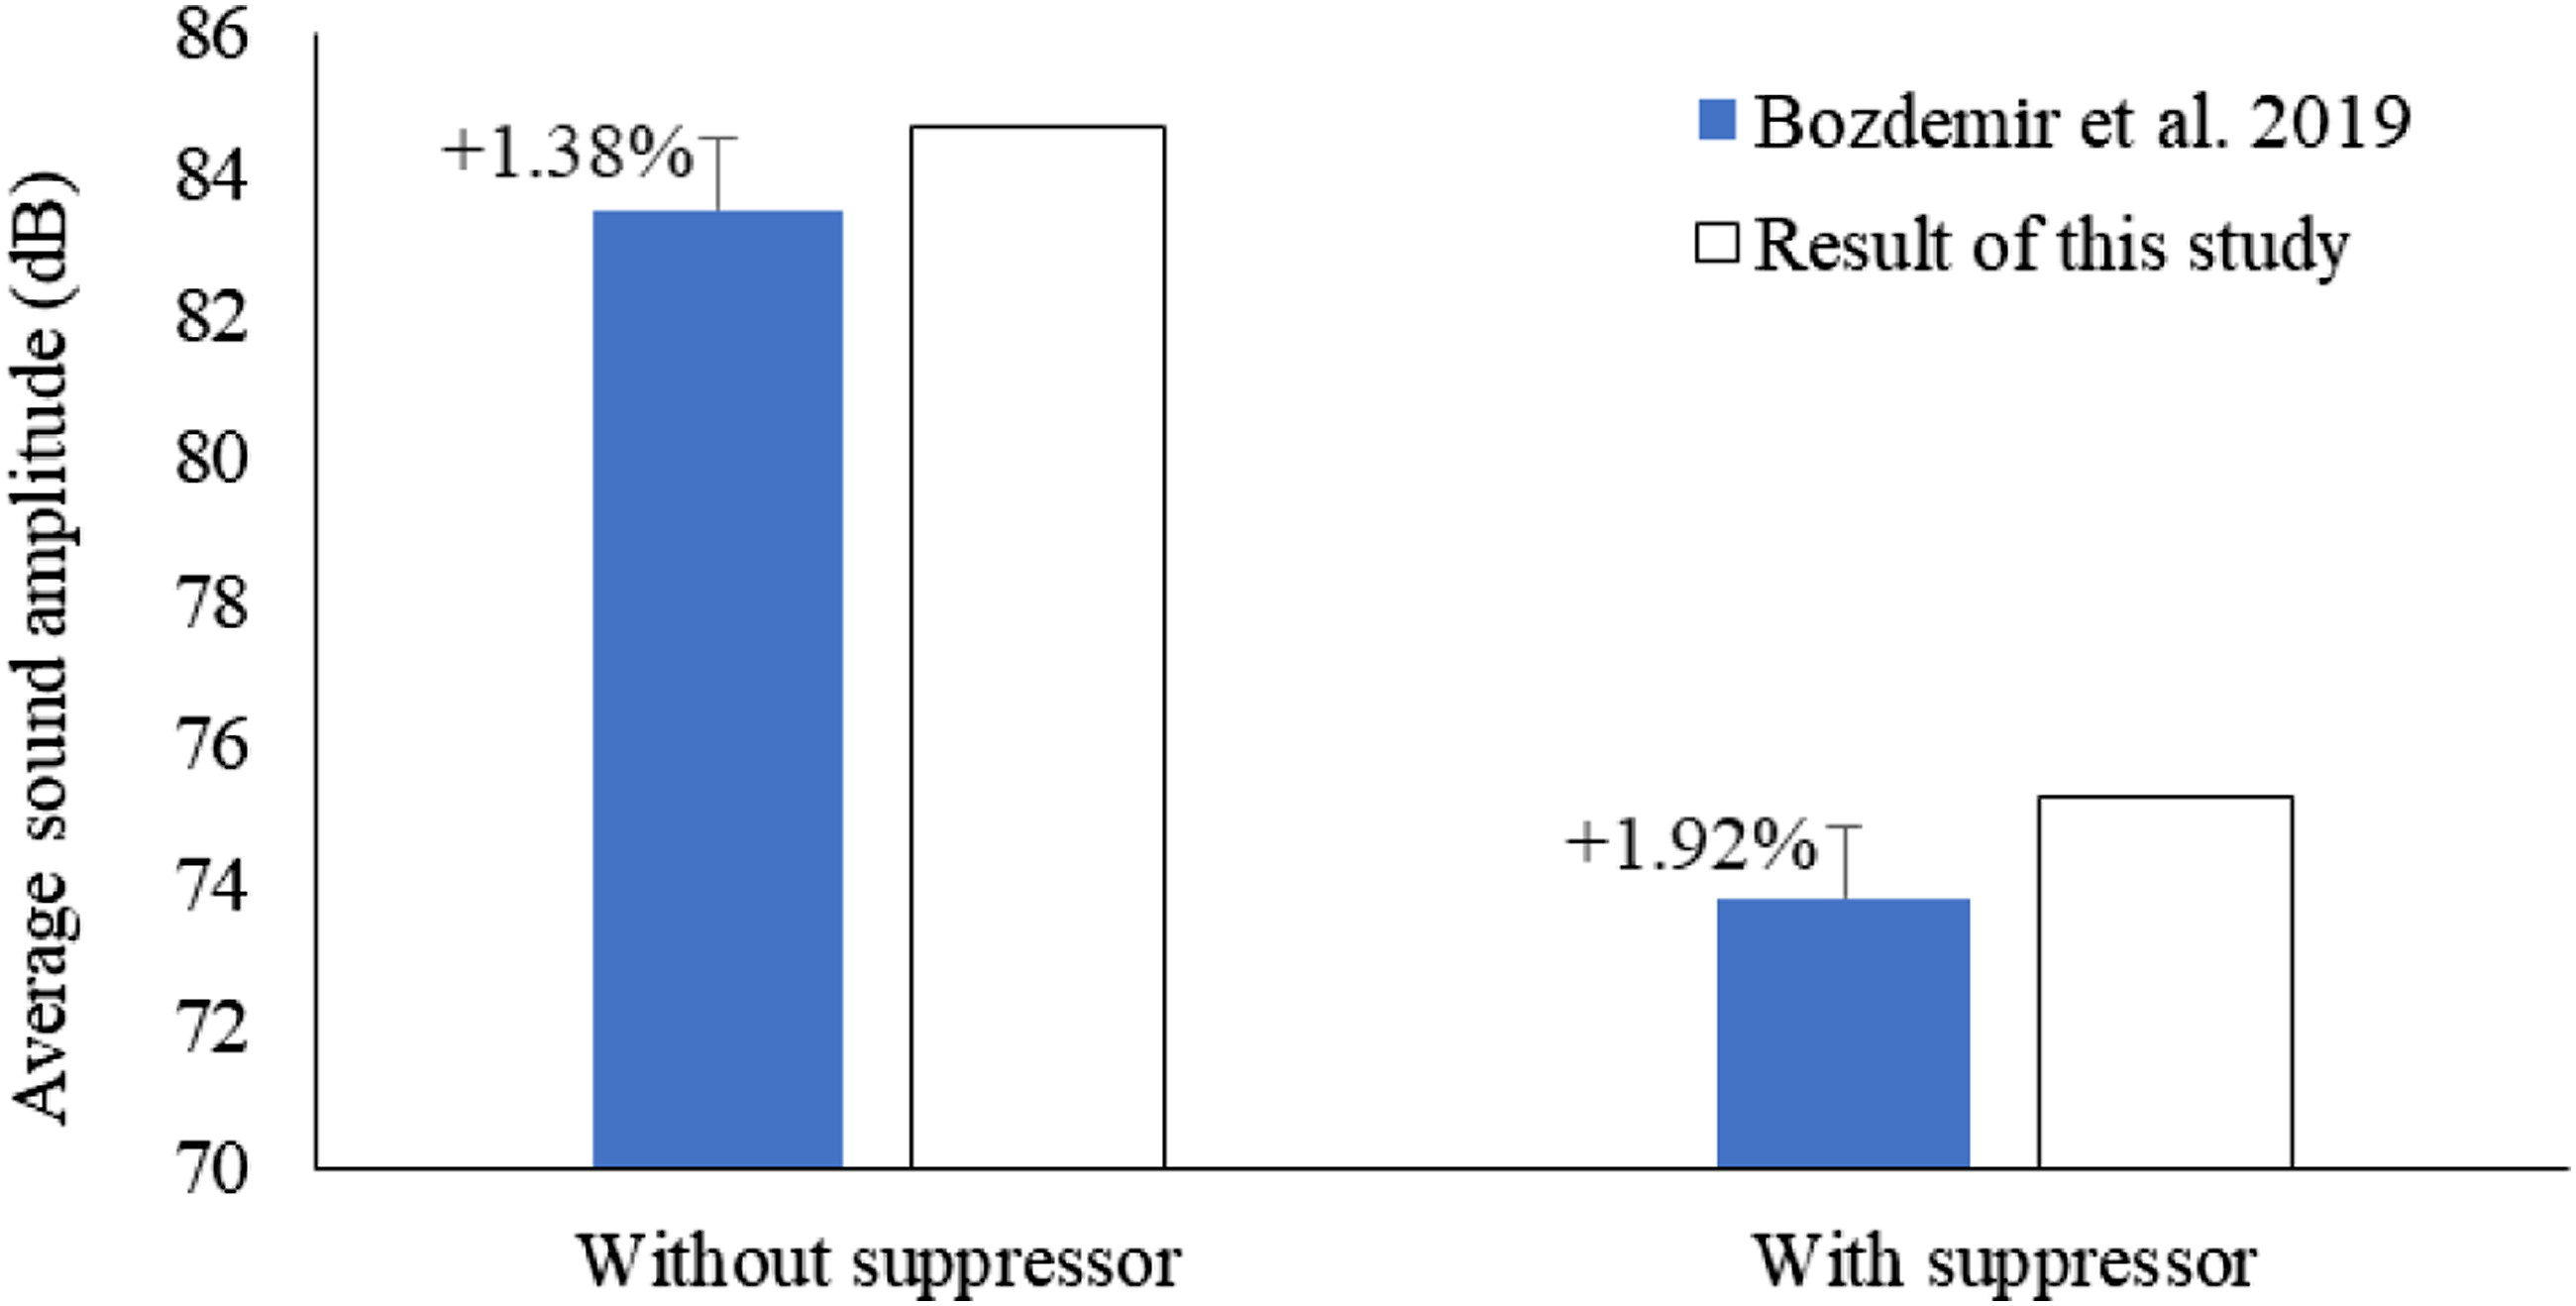
In both suppressed and unsuppressed cases, the error of numerical analysis results compared to Bozdemir (2019) was +1.38% and 1.92%, respectively. This result shows that the numerical method can be valid for such problems.
Governing equations
Modelling turbulence
K-ε calculates the flow in open space with high accuracy, and K-ω calculates the flow near the walls with high accuracy; the combination of these two models Kω-SST model, was used to get the best result. A blending function ensures that models are used correctly throughout the fluid domain by activating the K-ω model in the near wall region and the K-ε model in free flow.
The Navier Stokes and continuity equations are 21 :
Continuity equation
Navier Stokes equation
The variables are defined as follows: • • t is the time • • • • •
SST k-omega Governing Equation22–24
Kinematic Eddy Viscosity
Turbulence Kinetic Energy
Specific Dissipation Rate
Were • Note: F1 = 1 in the boundary layer and F1 = 0 in the free stream • P K (Production limiter) • S is the sum of the source terms by volume of energy
Flows-Williams and Hawking’s acoustic analogy method
The biggest challenge in numerically estimating sound waves is that sound has significantly less energy than flow fields. This flow field was recorded using the Kω-SST turbulence model in this simulation. Acoustic waves propagation was determined by calculating using the FW-H) approach. The (FW-H) equation is a non-homogeneous wave formula developed by combining the continuity and Navier-Stokes equations.
25
The FW-H equation is presented below10,26
Evaluation parameters of noise
The sound pressure level (SPL) assesses a sound wave caused by pressure fluctuations as it travels through the air.
27
Were,
Findings and discussions
This section presents the analysis of suppressors with five curved suppressors and different volumes. For the easiness of understanding, the models of the suppressor are represented by model numbers as follows: • Model 1: Suppressor with five curved baffles • Model 2: Increasing the diameter of the suppressor by 1/6, keeping the length and the number of baffle types constant • Model 3: Increasing the length of the suppressor by 1/6, keeping the diameter and the number of baffle types constant • Model 4: Increasing both the diameter and length of the suppressor by 1/6, keeping other parameters like time type and number of baffles constant
Propellant flow analysis
The velocity volume rendering figure shows that the fluid in front of the suppressor has a high velocity. From this, it can be concluded that propellant flow is directional. Figure 6 also shows that the velocity varies when the diameter and the length of the suppressor change. Velocity volume rendering of suppressor.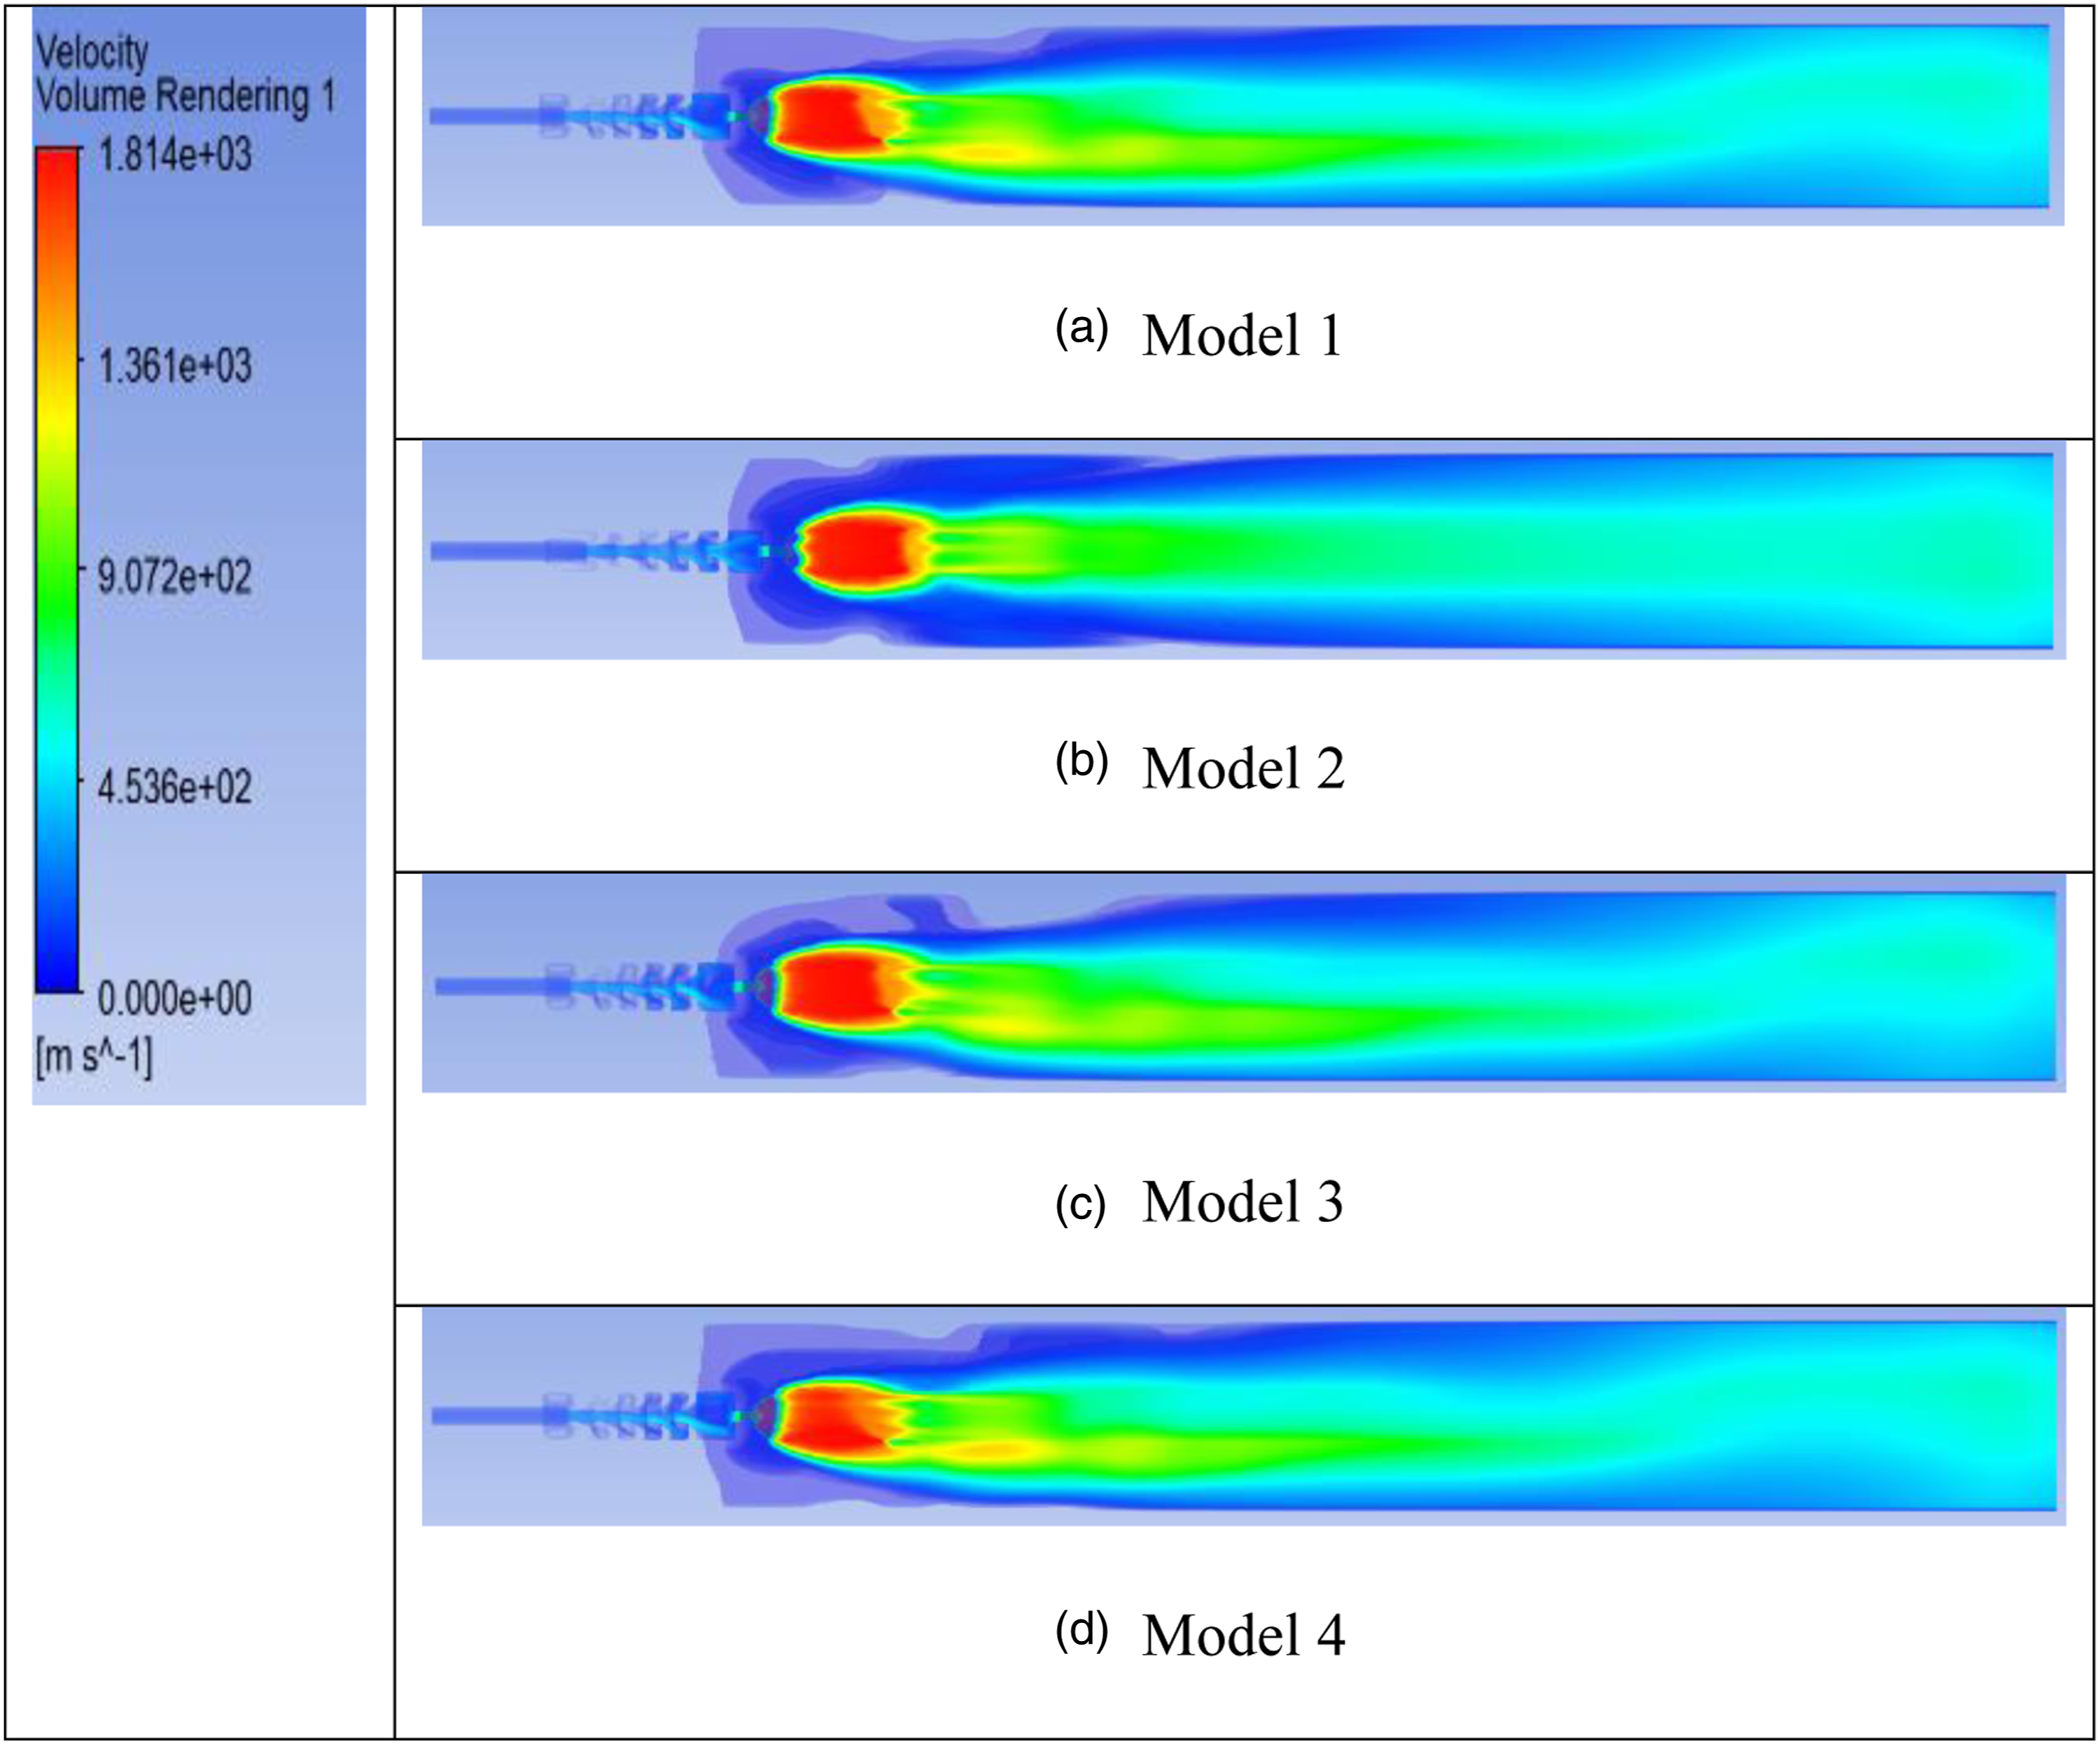
This section discusses the overpressure reduction result and the discussion of suppressors with five curved baffles. The change of pressure concerning time is shown in Figure 7. As can be seen from the figure, the pressure increases rapidly in the first 1 ms in all models. After this moment, the pressure value does not change much. Pressure versus time graph of suppressor.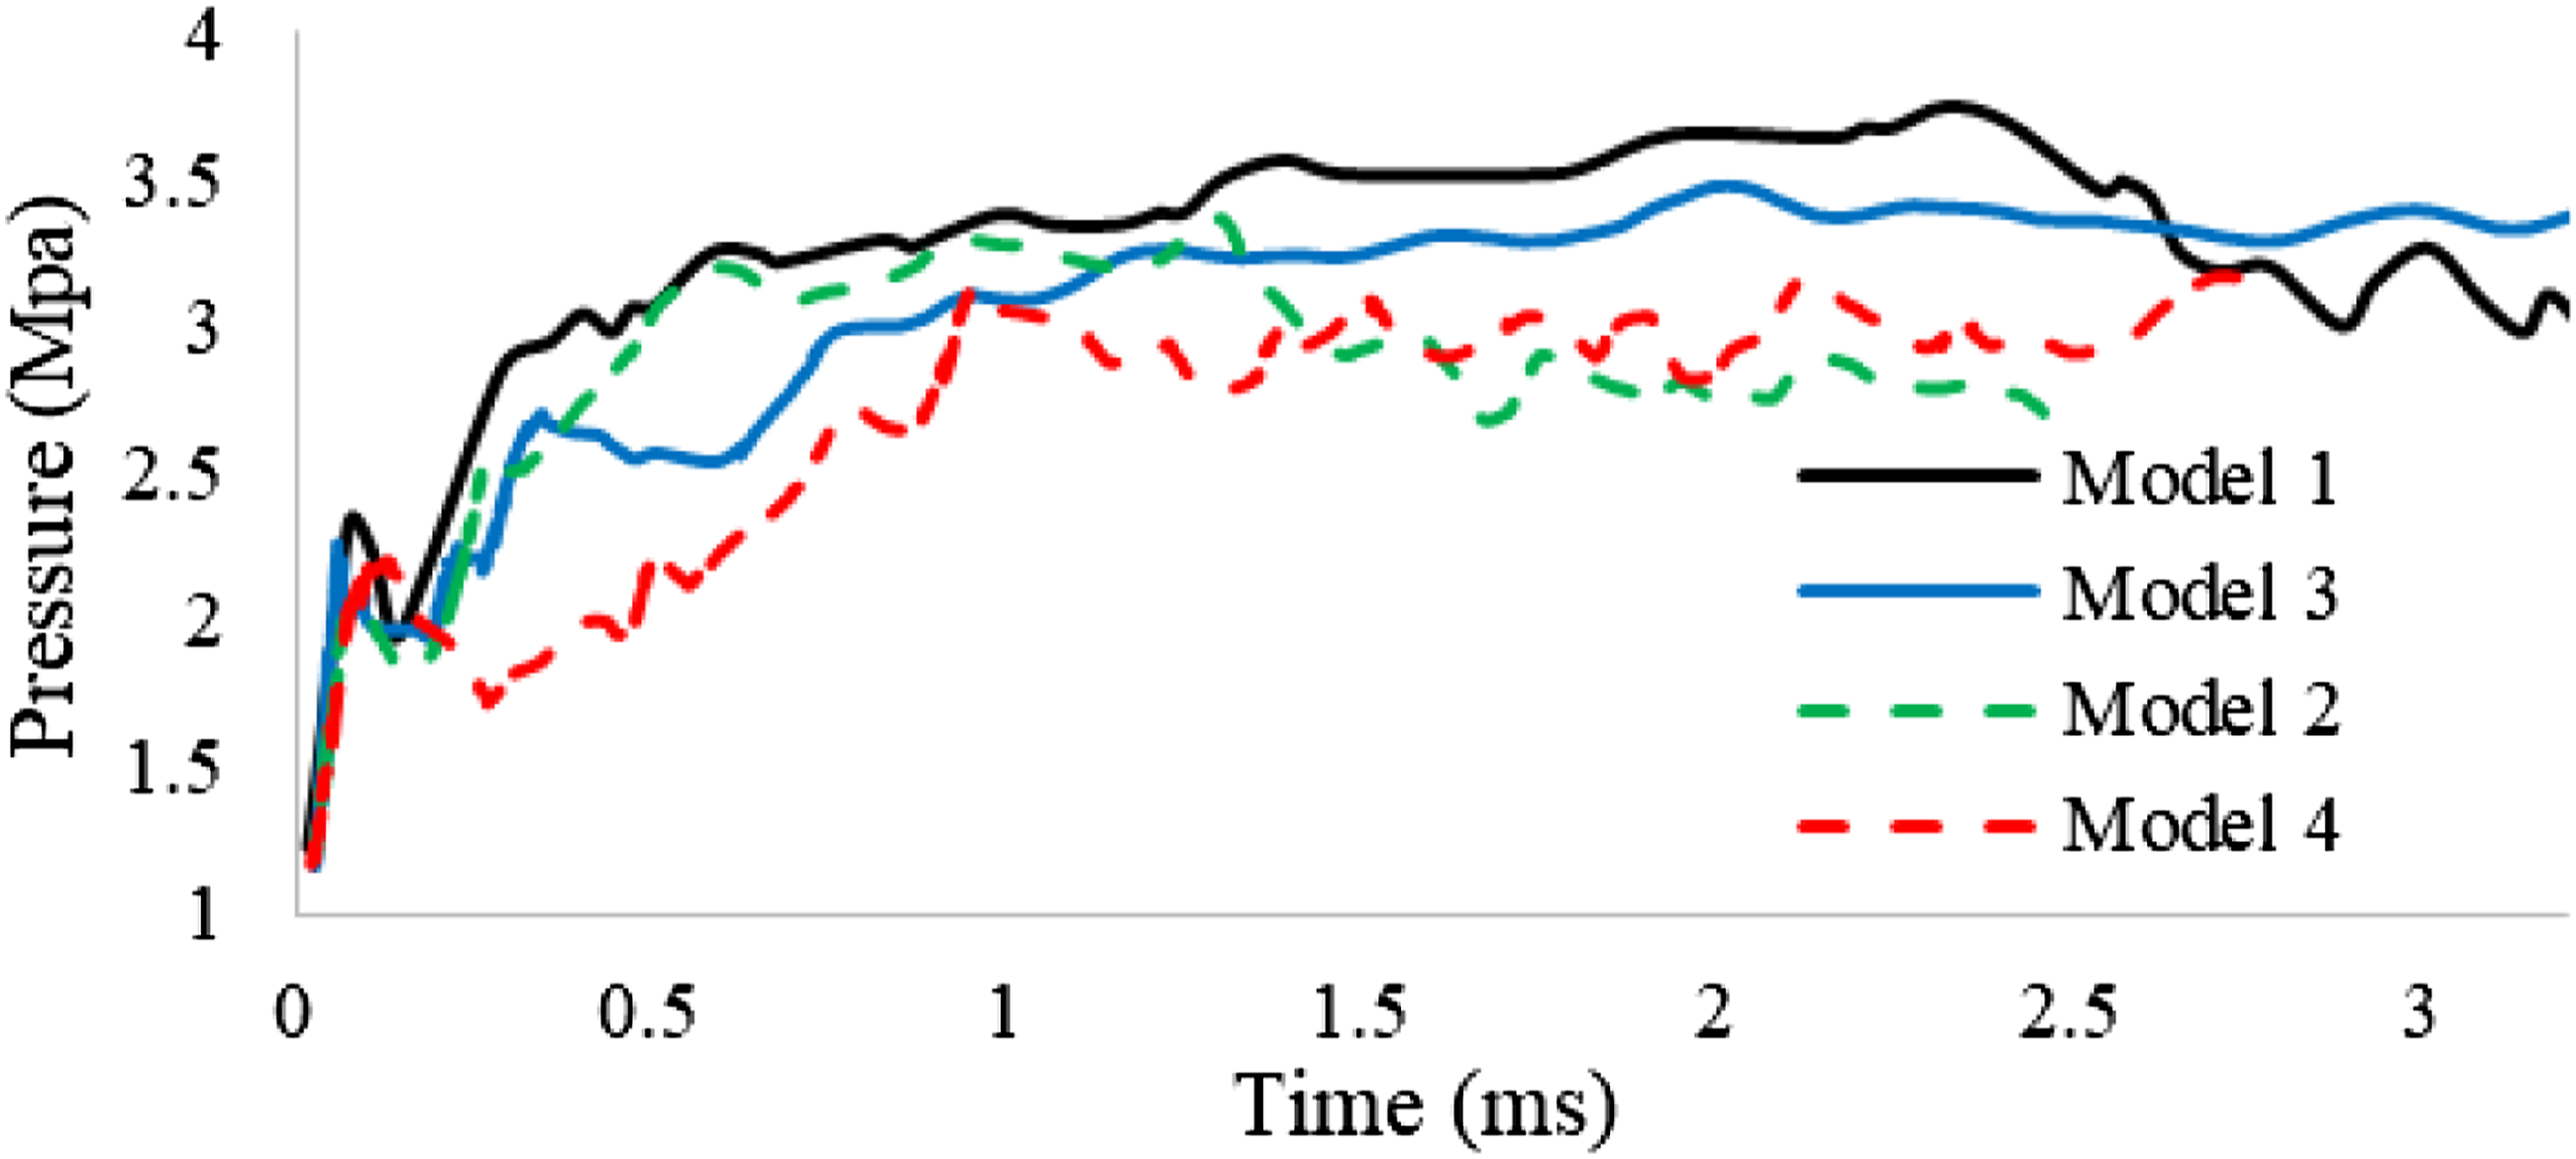
The change of the maximum exit pressure with the suppressor model is given in Figure 8. The value of peak overpressure at the exit of Models 1, 2, 3, and 4 was 3.748 MPa, 3.4961 MPa, 3.3636 MPa, and 3.1766 MPa, respectively. The change of the pressure along the suppressor length is given in Figure 9. The first baffle, which receives the maximum pressure, reduces this maximum pressure and passes it on to the next baffle. Pressure versus suppressor models. Pressure versus suppressor length.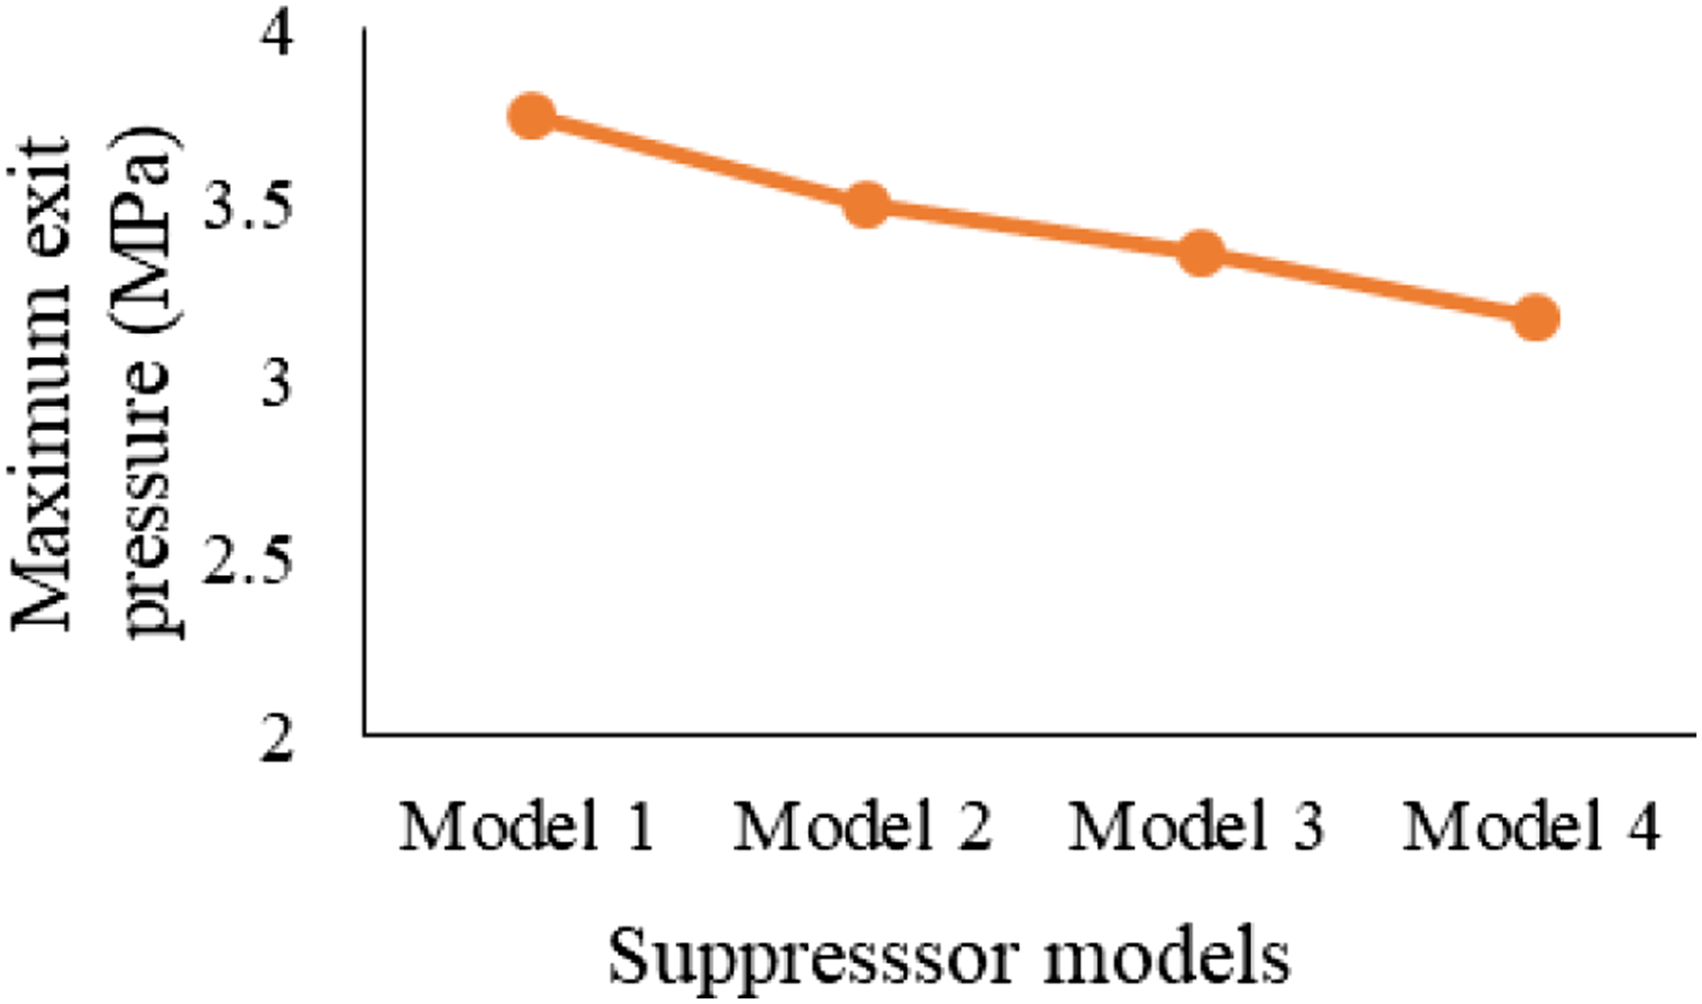
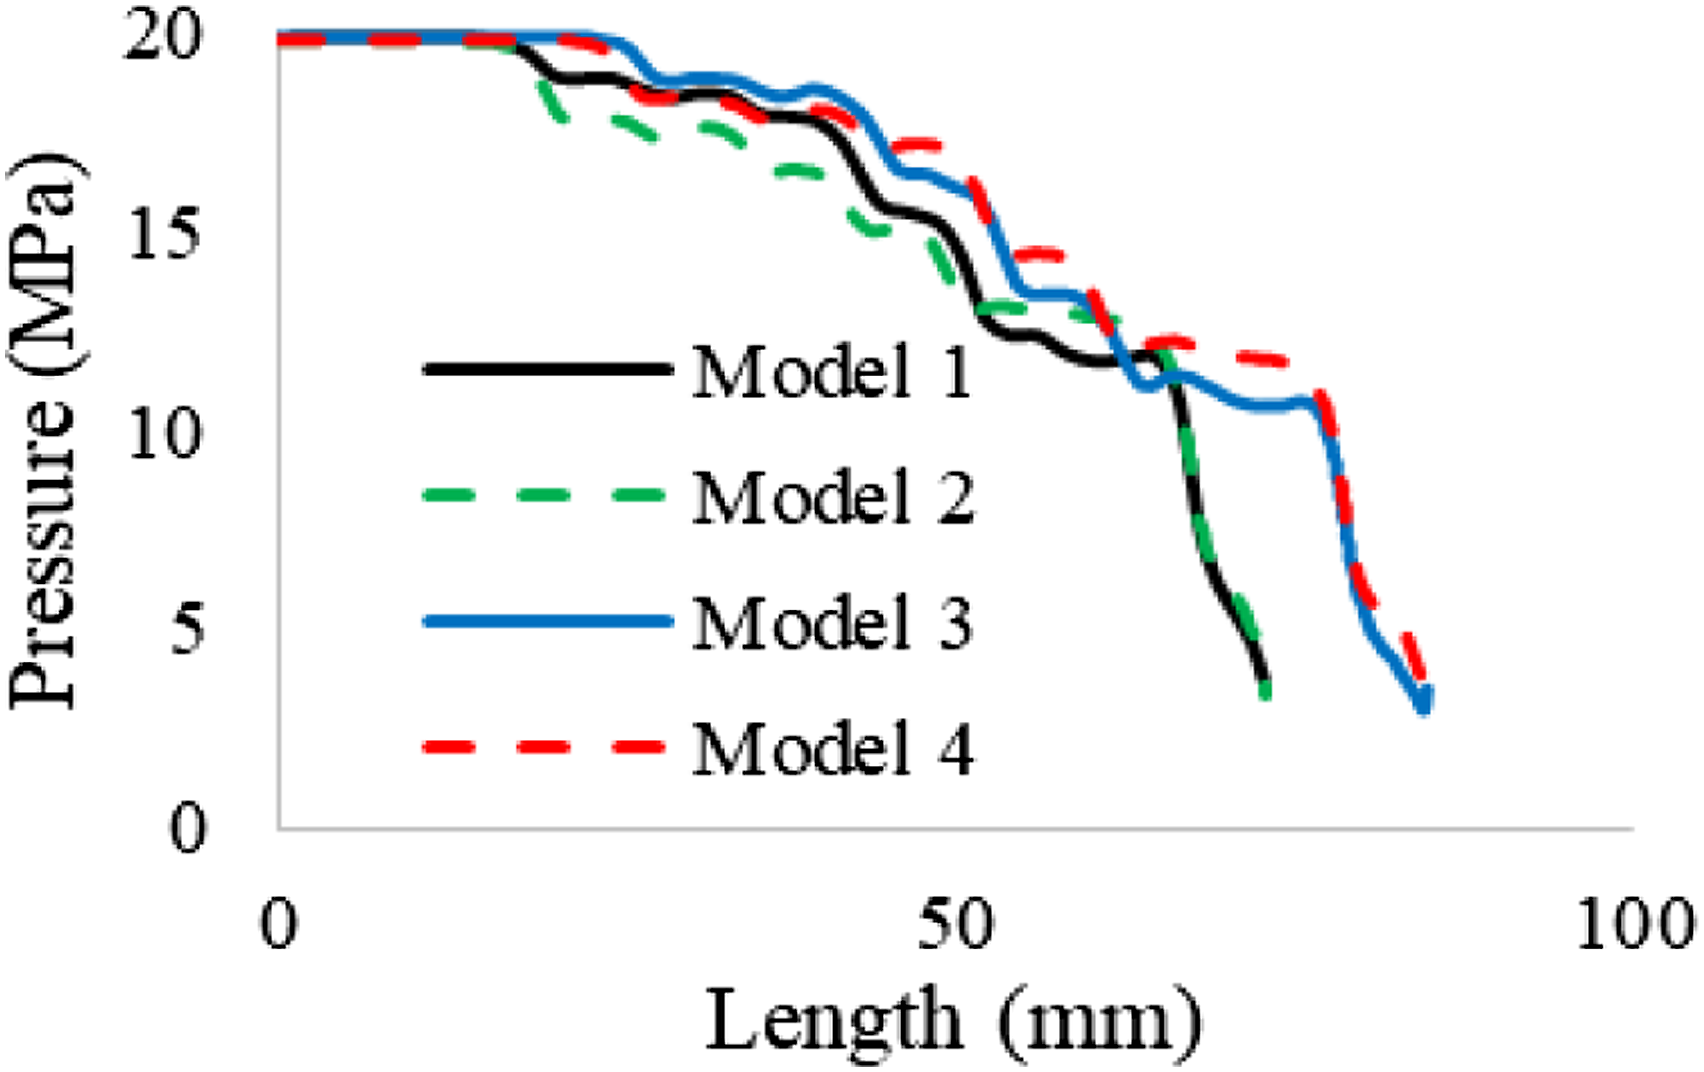
As shown in Figure 9, there is an overpressure reduction inside the muffler. The overpressure reduction was 16.251 MPa for Model 1. When the diameter was increased by one-sixth, the overpressure reduction increased to 16.503 MPa. When the length was increased by one-sixth, the overpressure reduction became 16.636 MPa. Lastly, when both increased by 1/6, the overpressure reduction increased by 0.572 MPa and became 16.823 MPa.
Reducing the temperature lowers the energy content of the gas, resulting in batter attenuation of sound. Figures 10 and 11 show the temperature with five curved suppressors with different suppressor volumes. Temperature versus time chart. Temperature versus length.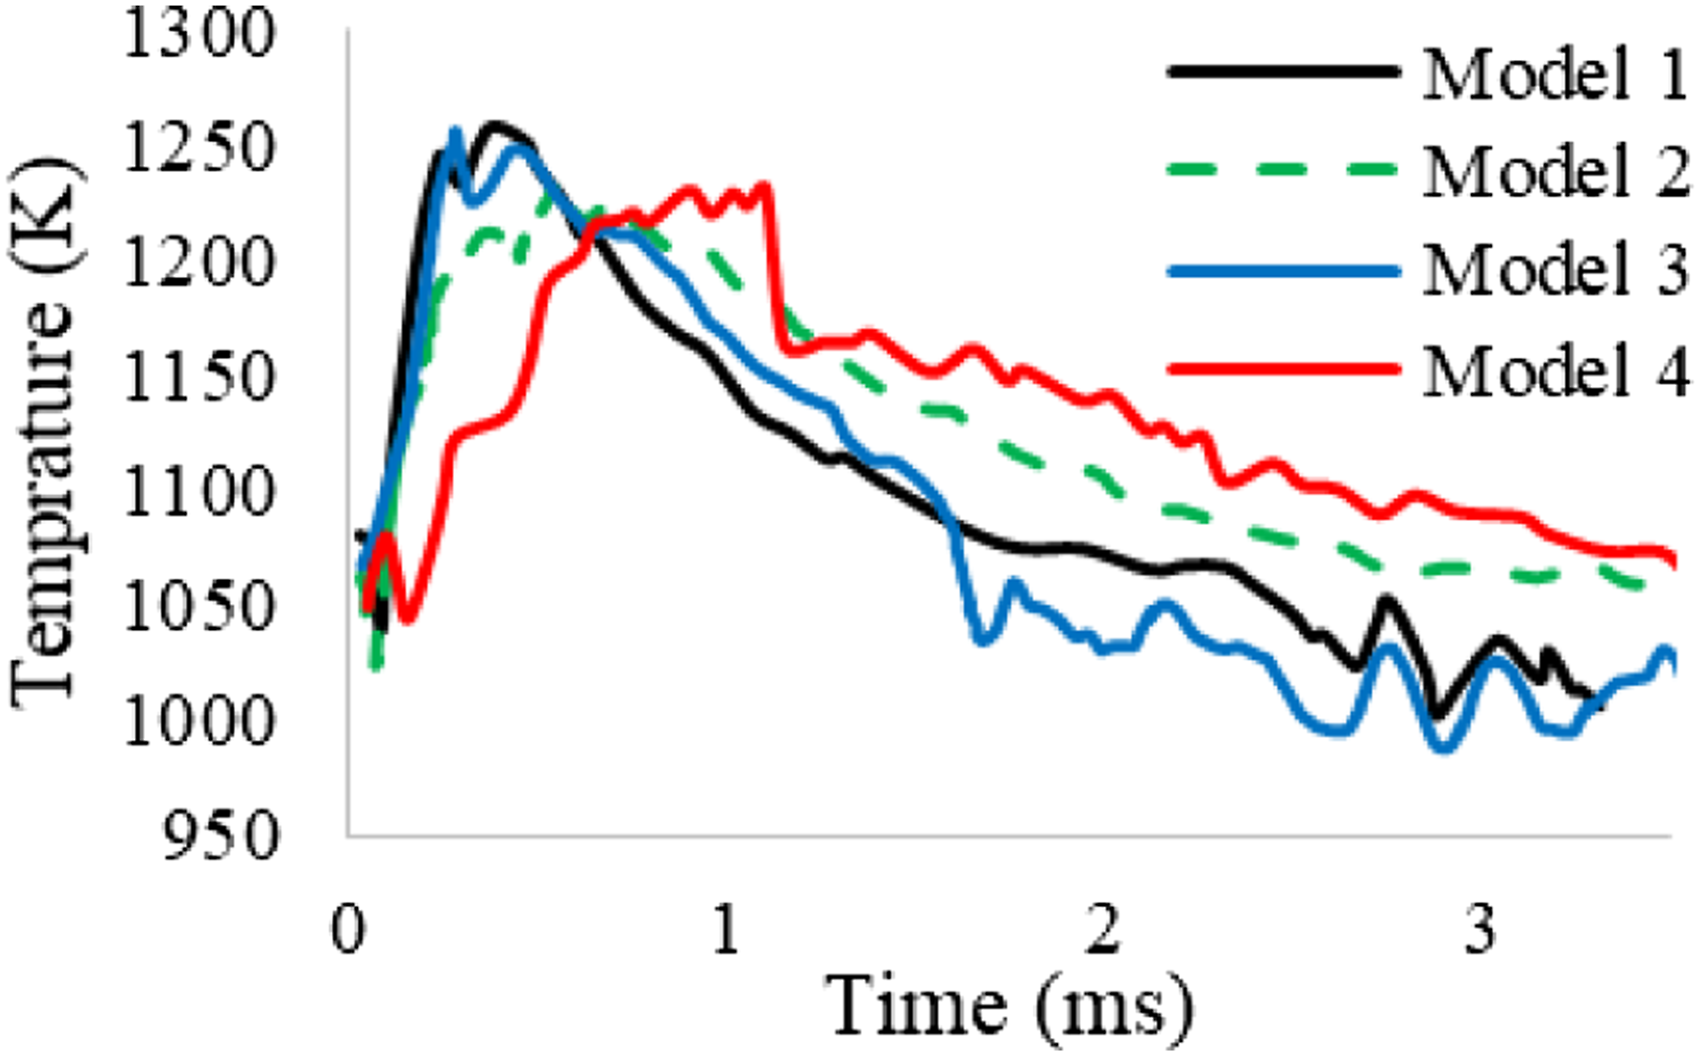
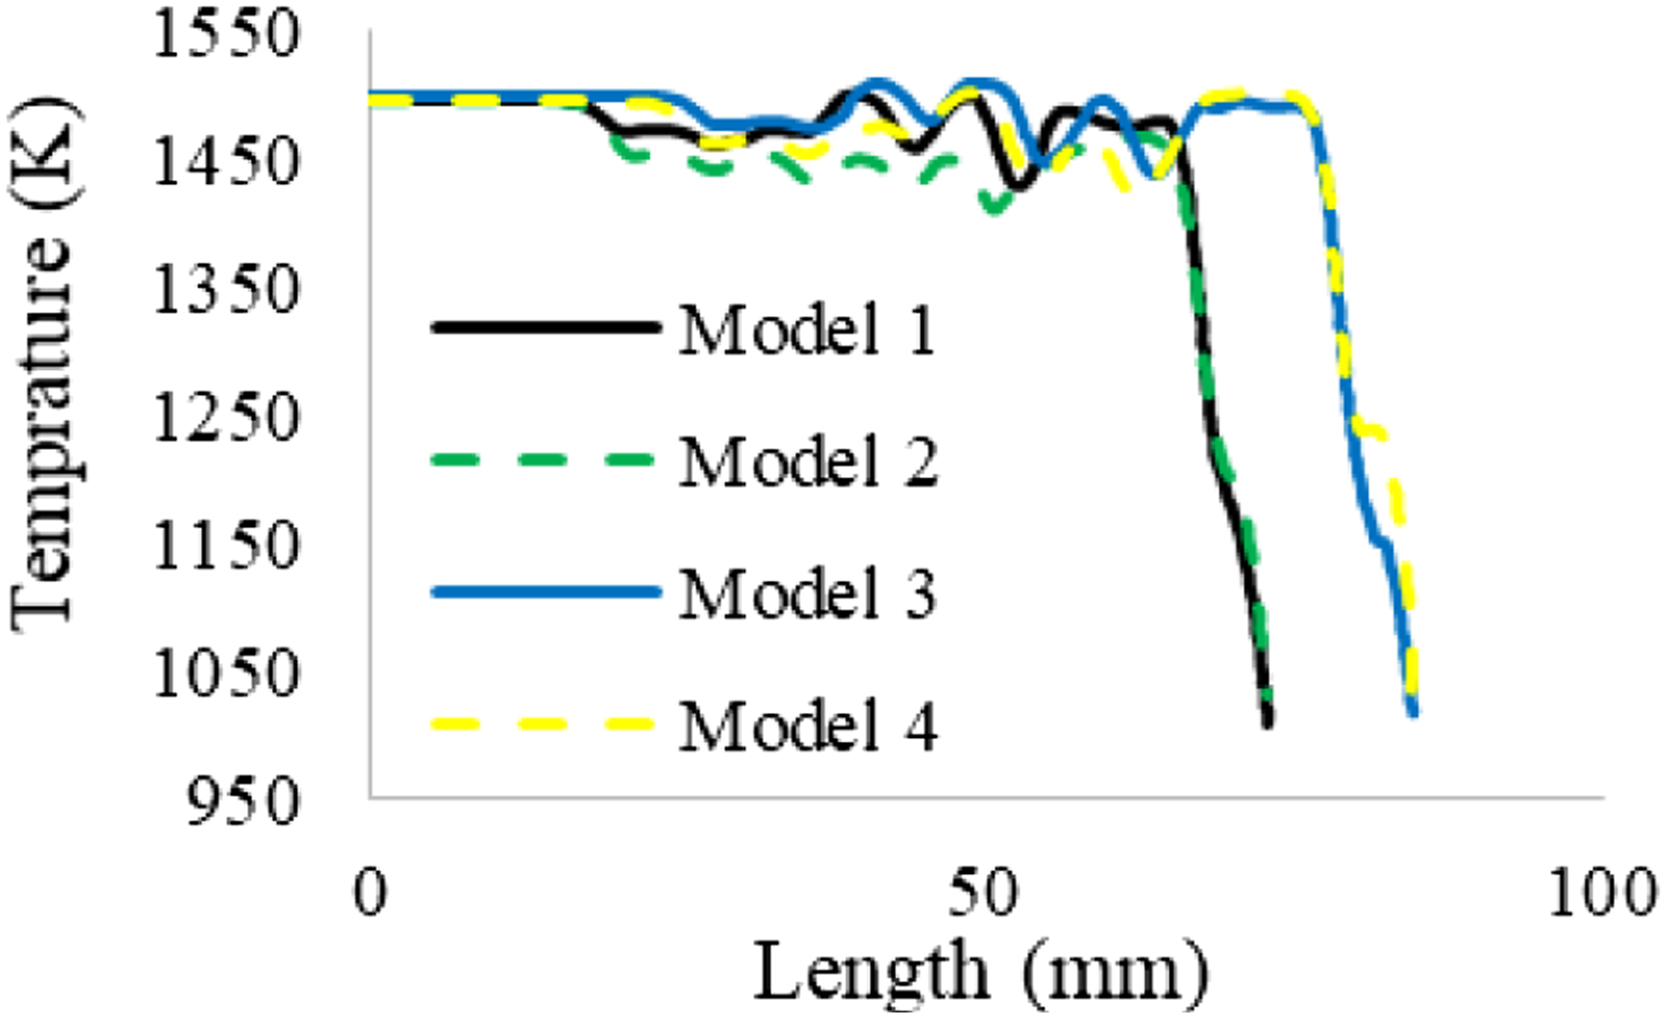
As compared to the initial temperature, there is a reduction in temperature. The effect of suppressor models on temperature reduction is shown in Figures 10 and 11. The temperature reduction when both diameter and length increased by 1/6 becomes 484.86 K or 32.32%. The combined effect of temperature reduction and overpressure reduction gives maximum sound attenuation.
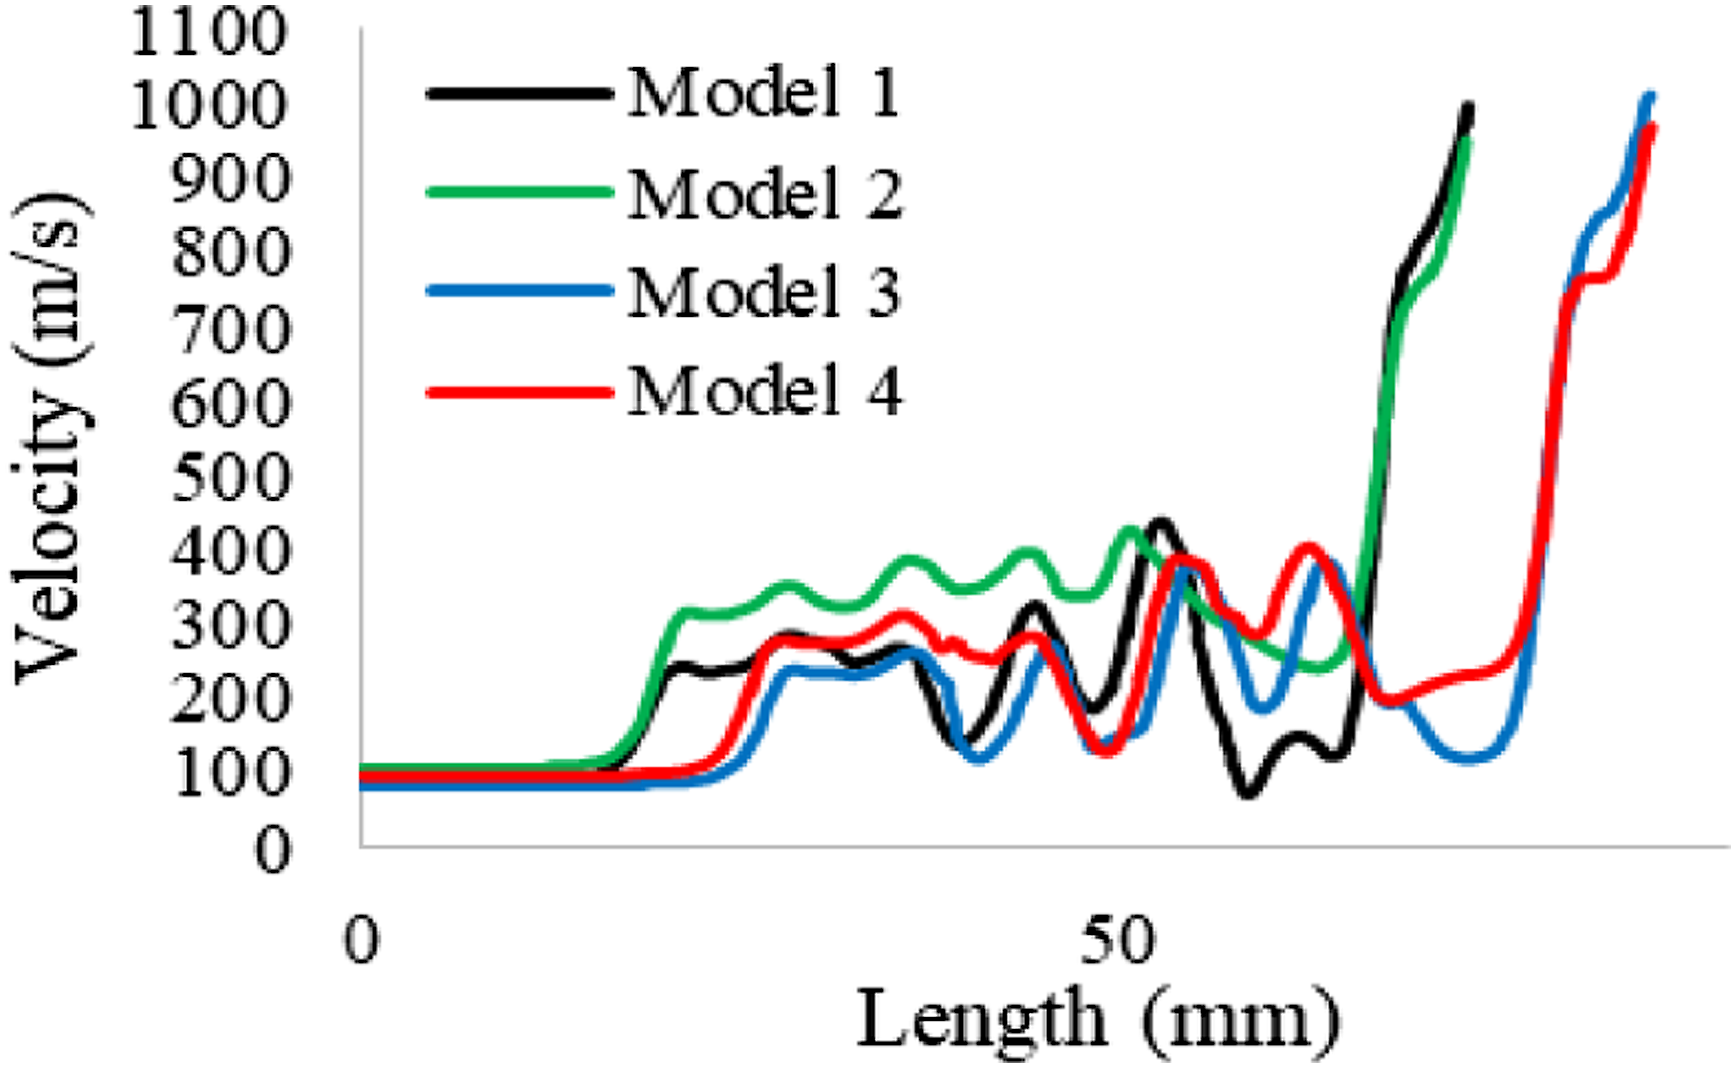
The velocity of the fluid creates turbulence and other waves inside and outside of the suppressor. The slow release of gas into the ambient air lowers the tendency of explosion and increases sound attenuation. For different model geometries, the change of velocity with time is shown in Figure 12 and the change with length is shown in Figure 13. As shown in Figure 12 the velocity values of the fluid tend to decrease with time for all model geometries. In Figure 13, it is observed that the fluid velocity does not change much at a certain distance along the length of the suppressor, but shows a sudden increase towards the suppressor exit. Velocity versus time chart. Velocity versus length chart.
Since density and pressure are directly related, lowering density gives better sound suppression by decreasing the overpressure of the gas. The density versus time graph for different model geometries is presented in Figure 14. As can be seen from the figure, the density value decreases as the volume of the suppressor increases. It is seen that Model 1, which has the smallest suppressor volume, has the highest density values. Model 3 and Model 4 have lower density values than the other models over time. The change of the density along the suppressor length for different model geometries is shown in Figure 15. For all model geometries, the density value decreases along the length towards the suppressor exit. Density versus time chart. Density versus length chart.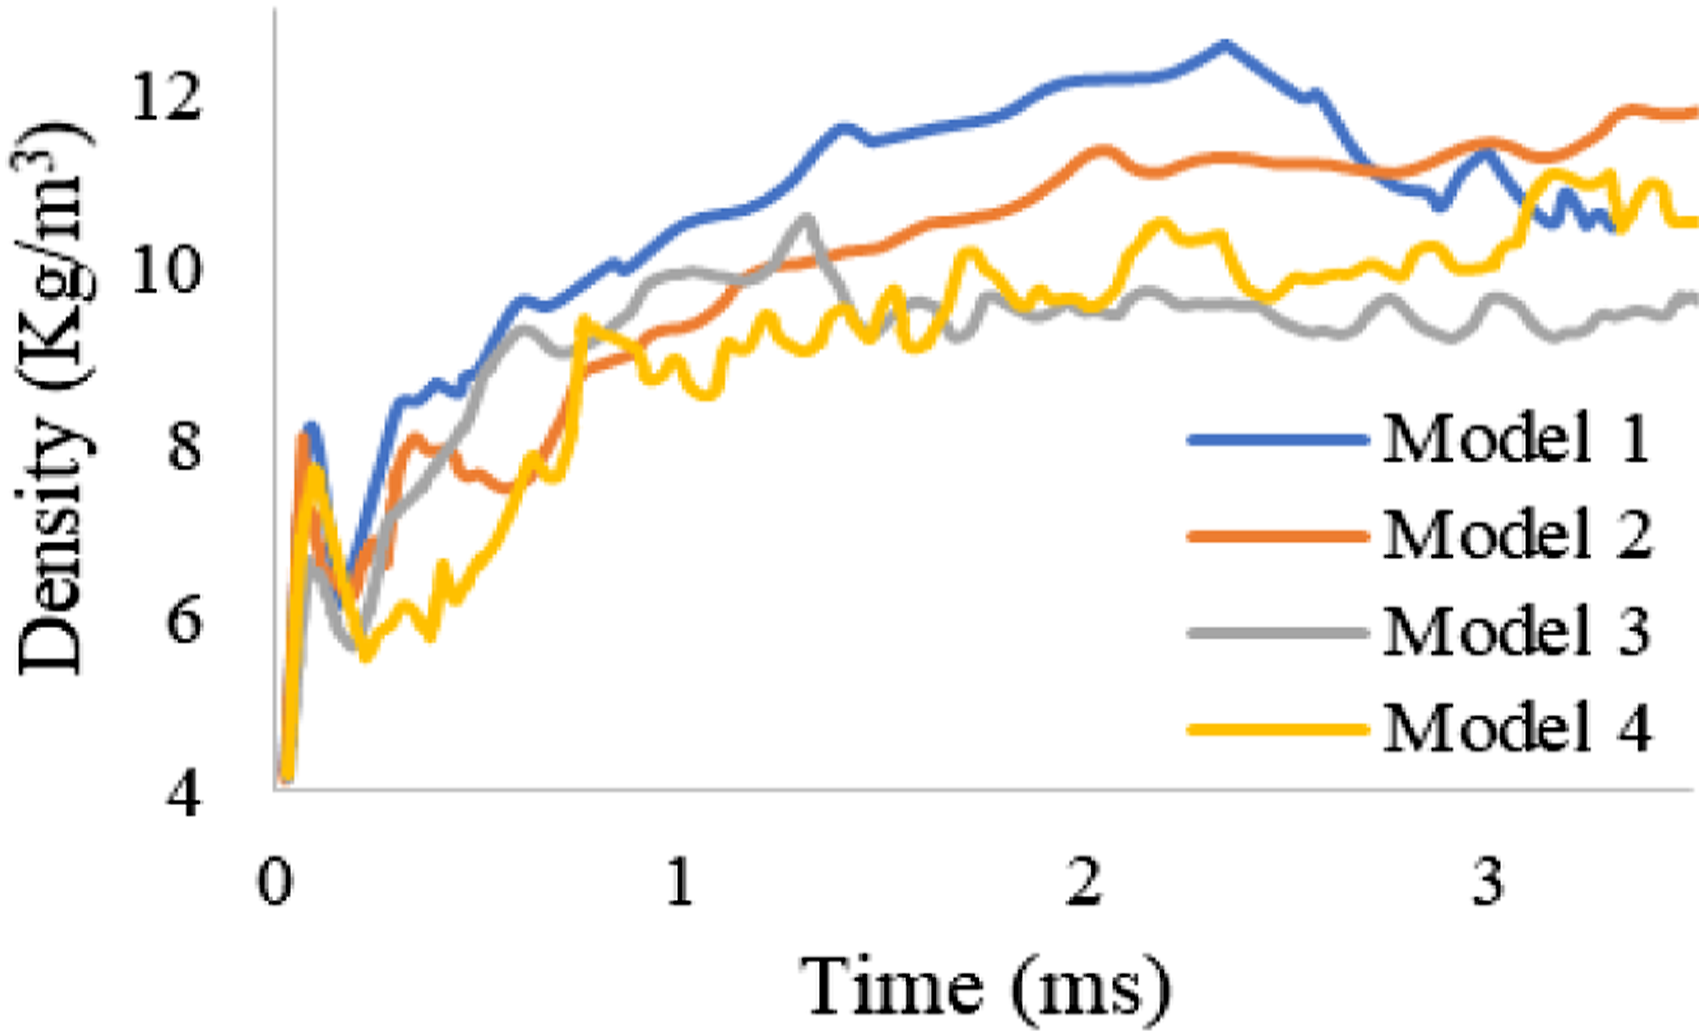

Acoustic analysis
The sound pressure level, sound amplitude, and power spectral density were investigated to study the acoustic behaviour. The receiver’s location was 30 cm from the outlet of the Silencer.
The change in sound pressure level with frequency is presented in Figure 16. The numerical analysis of propellant gas from the gun without a suppressor recorded 169.498 dB of sound pressure level. The SPL value for Model 1 was 158.117 dB, which is an 11.381 dB attenuation compared to the unsuppressed condition. For Model 2, the SPL attenuation increased to 16.515 dB, which became 152.983 dB. For Model 3, the attenuation was 17.541 dB, and the sound pressure value was 150.956 dB. Lastly, for Model 4, attenuation increased by 20.835 dB and became 148.663 dB. Sound pressure level versus frequency chart.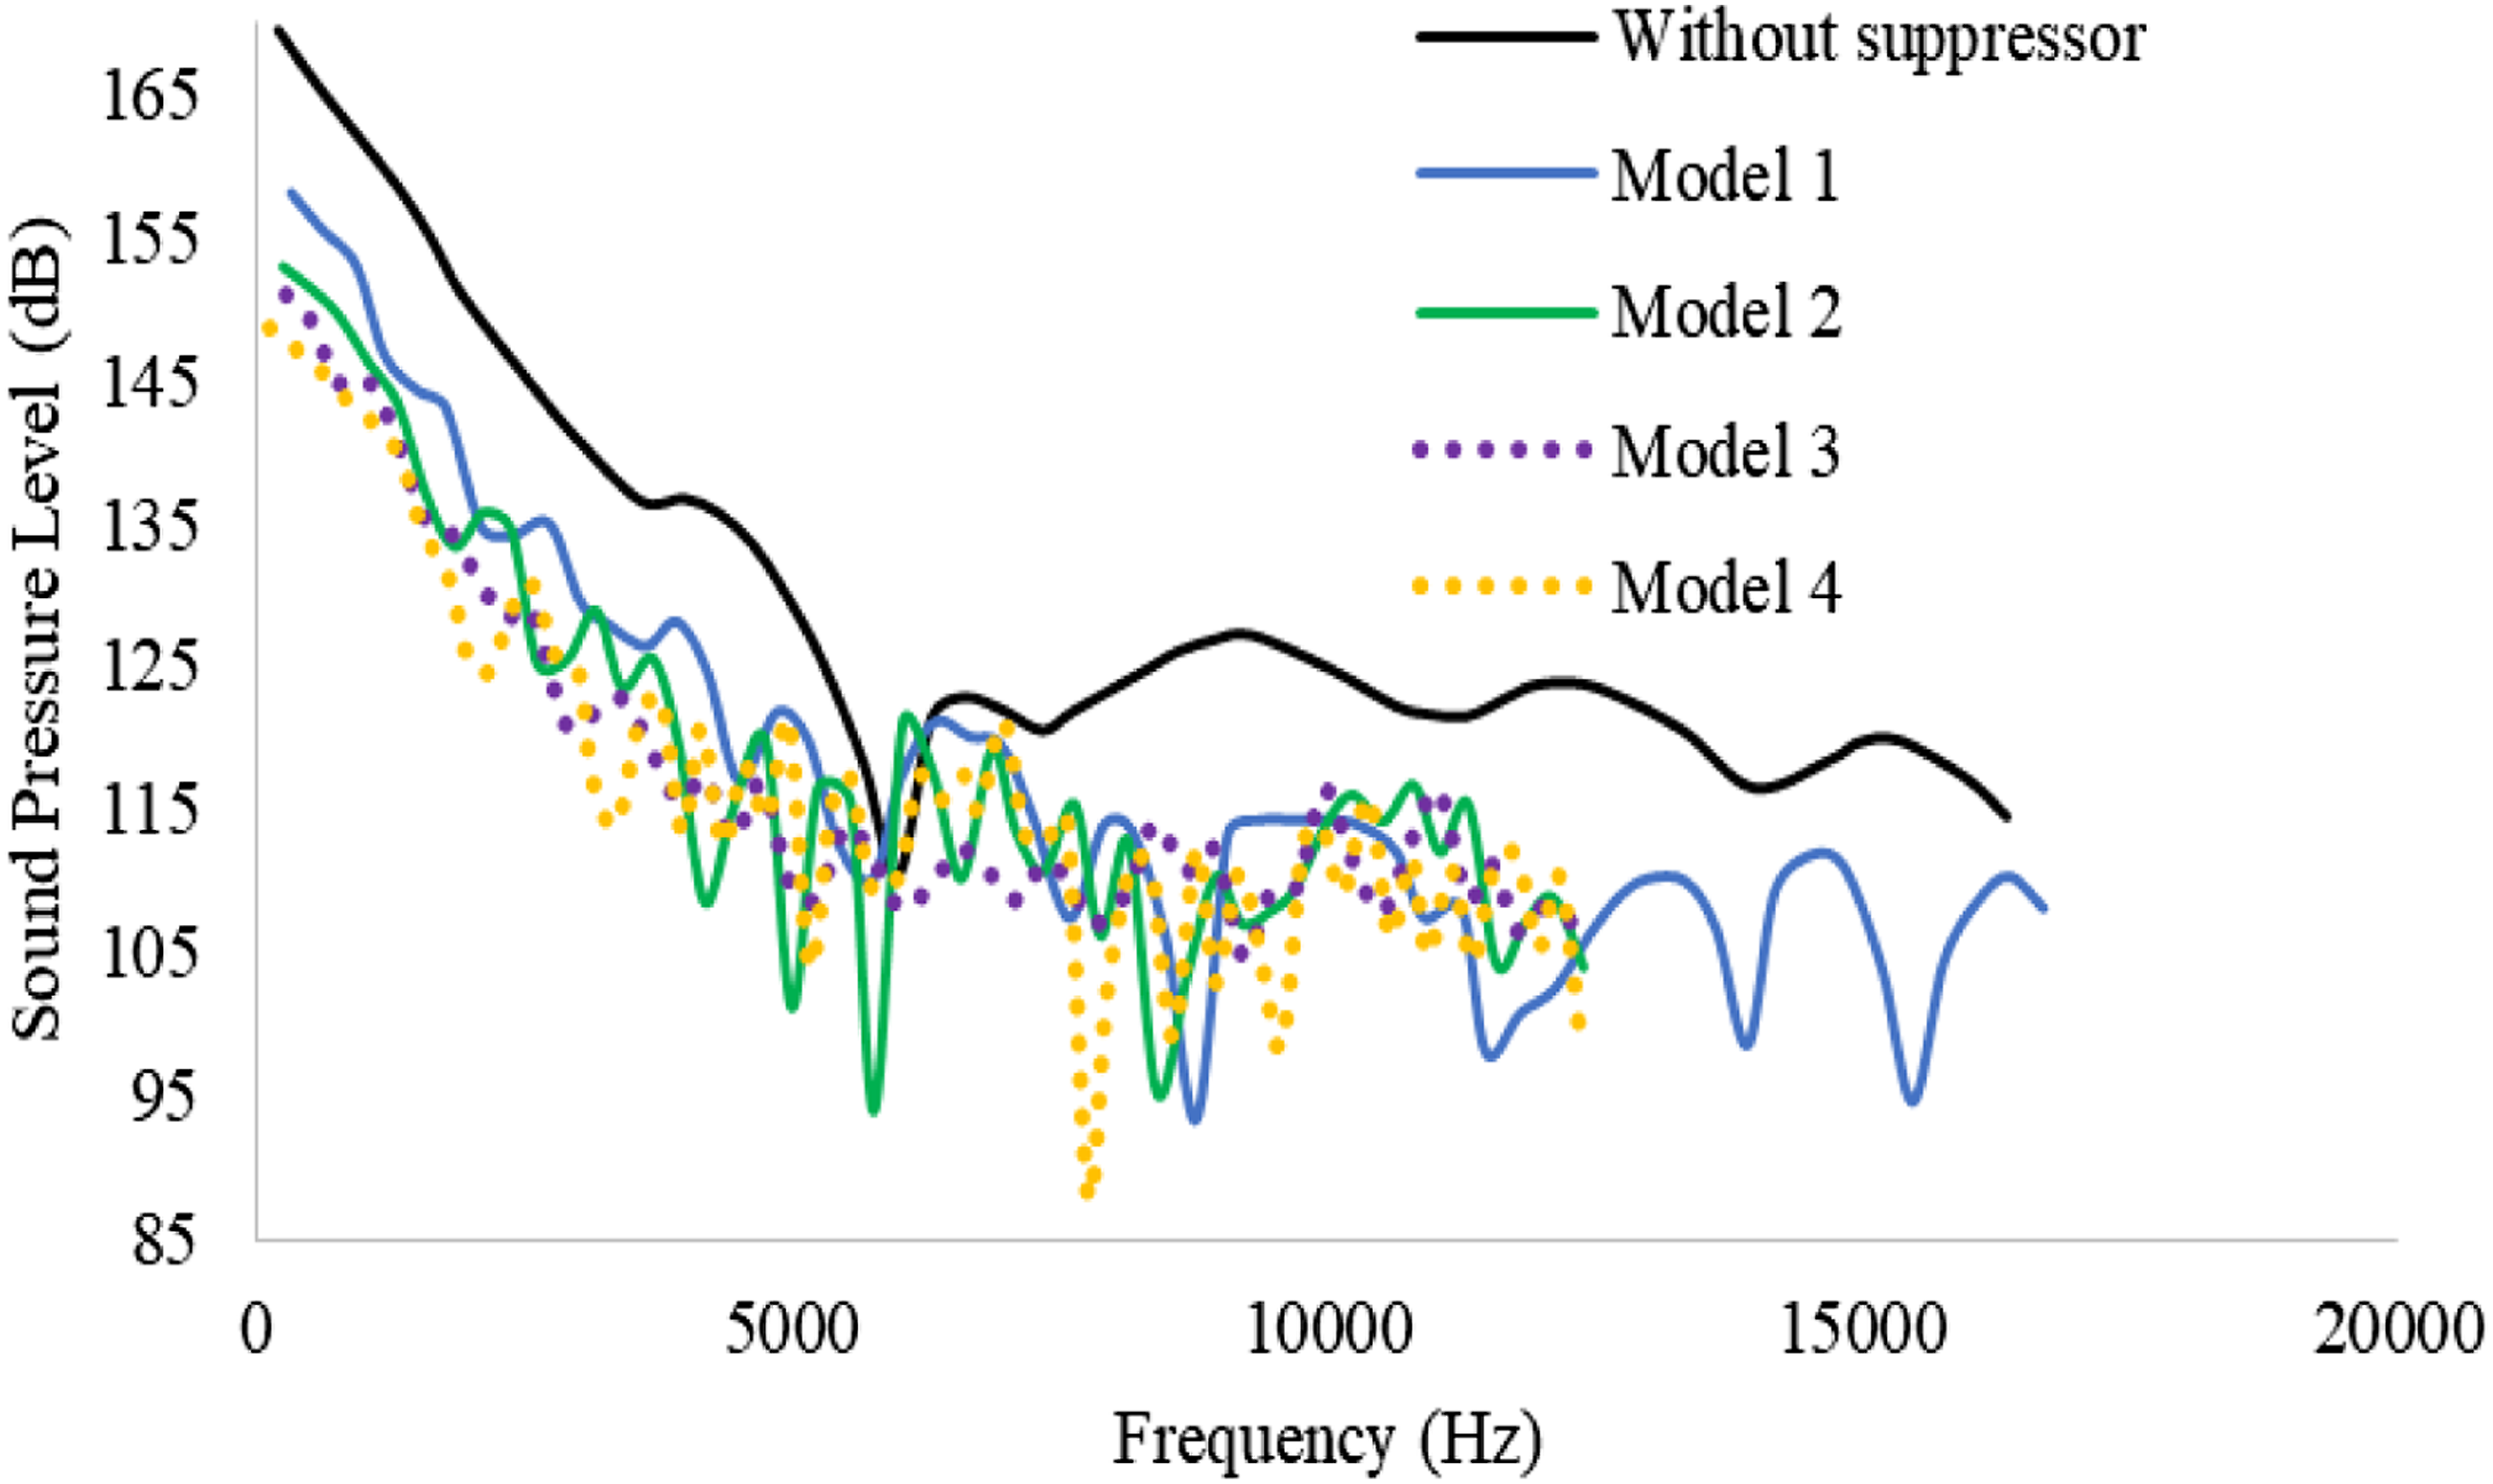
The peak sound pressure level values for different model geometries are shown in Figure 17. A peak SPL value was decreased from 169.498 dB in an unsuppressed condition to 148.663 dB. As can be seen from the figure, the peak SPL value is reduced by 20.835 dB or 12.29% when a suppressor is used. Maximum sound pressure level versus number of models.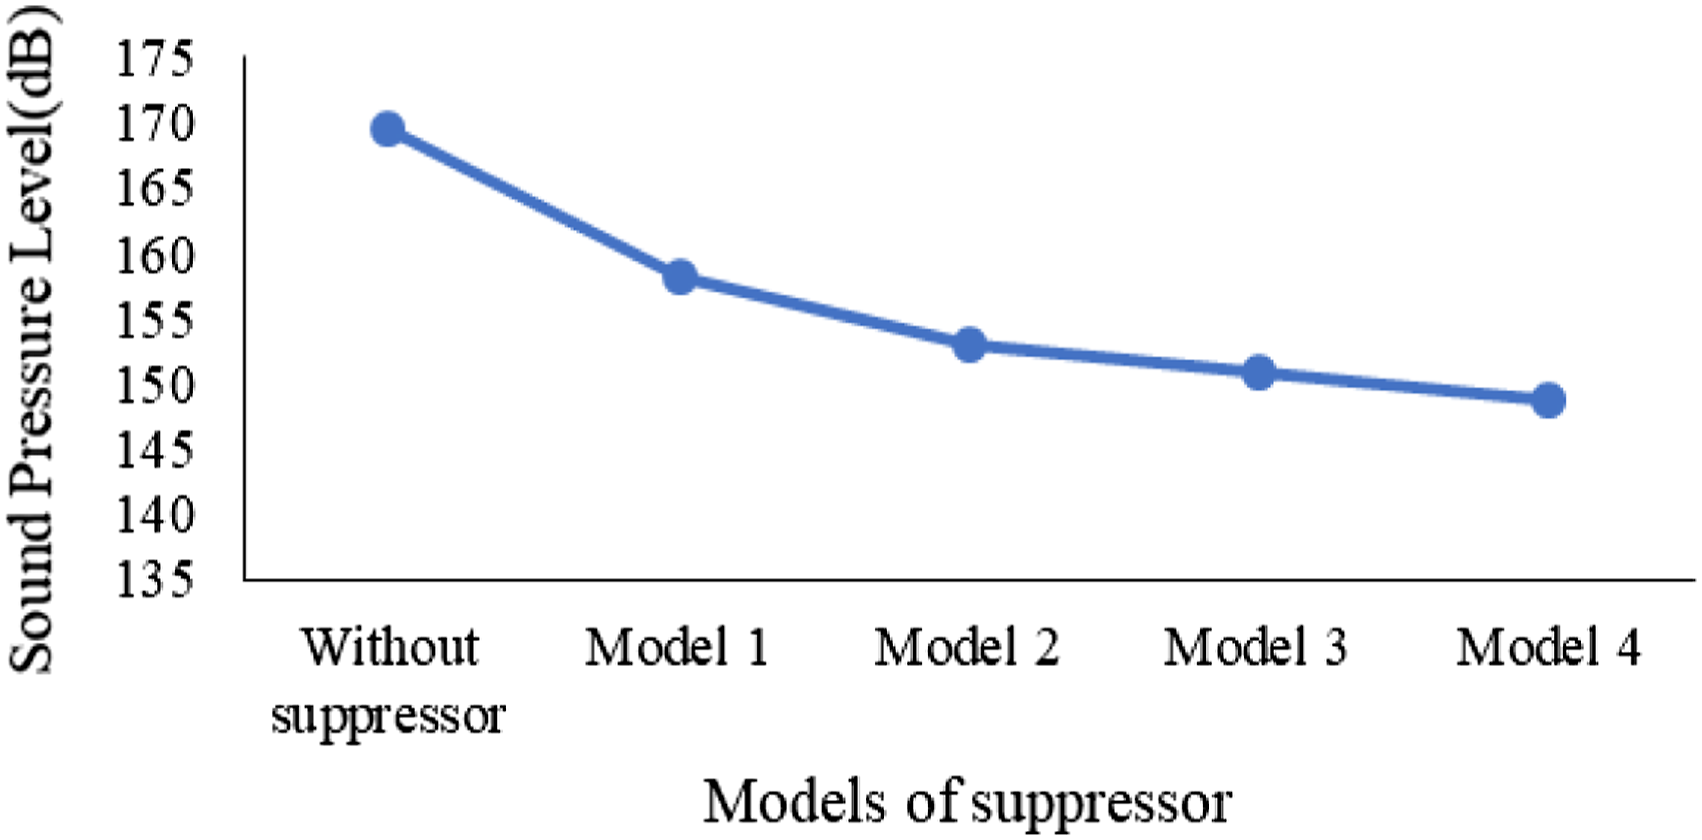
The sound amplitude versus frequency graph for different geometries is presented in Figure 18. The sound amplitude without a suppressor was 98.995 dB. This value decreased by 6.059 dB for Model 1, and the sound amplitude became 92.936 dB. For Models 2 and 3, the attenuation was further reduced by 9.435 dB and 9.714 dB, respectively. Lastly, for Model 4, the attenuation increased by 11.345 dB and became 87.649 dB. Sound amplitude versus frequency chart of suppressor.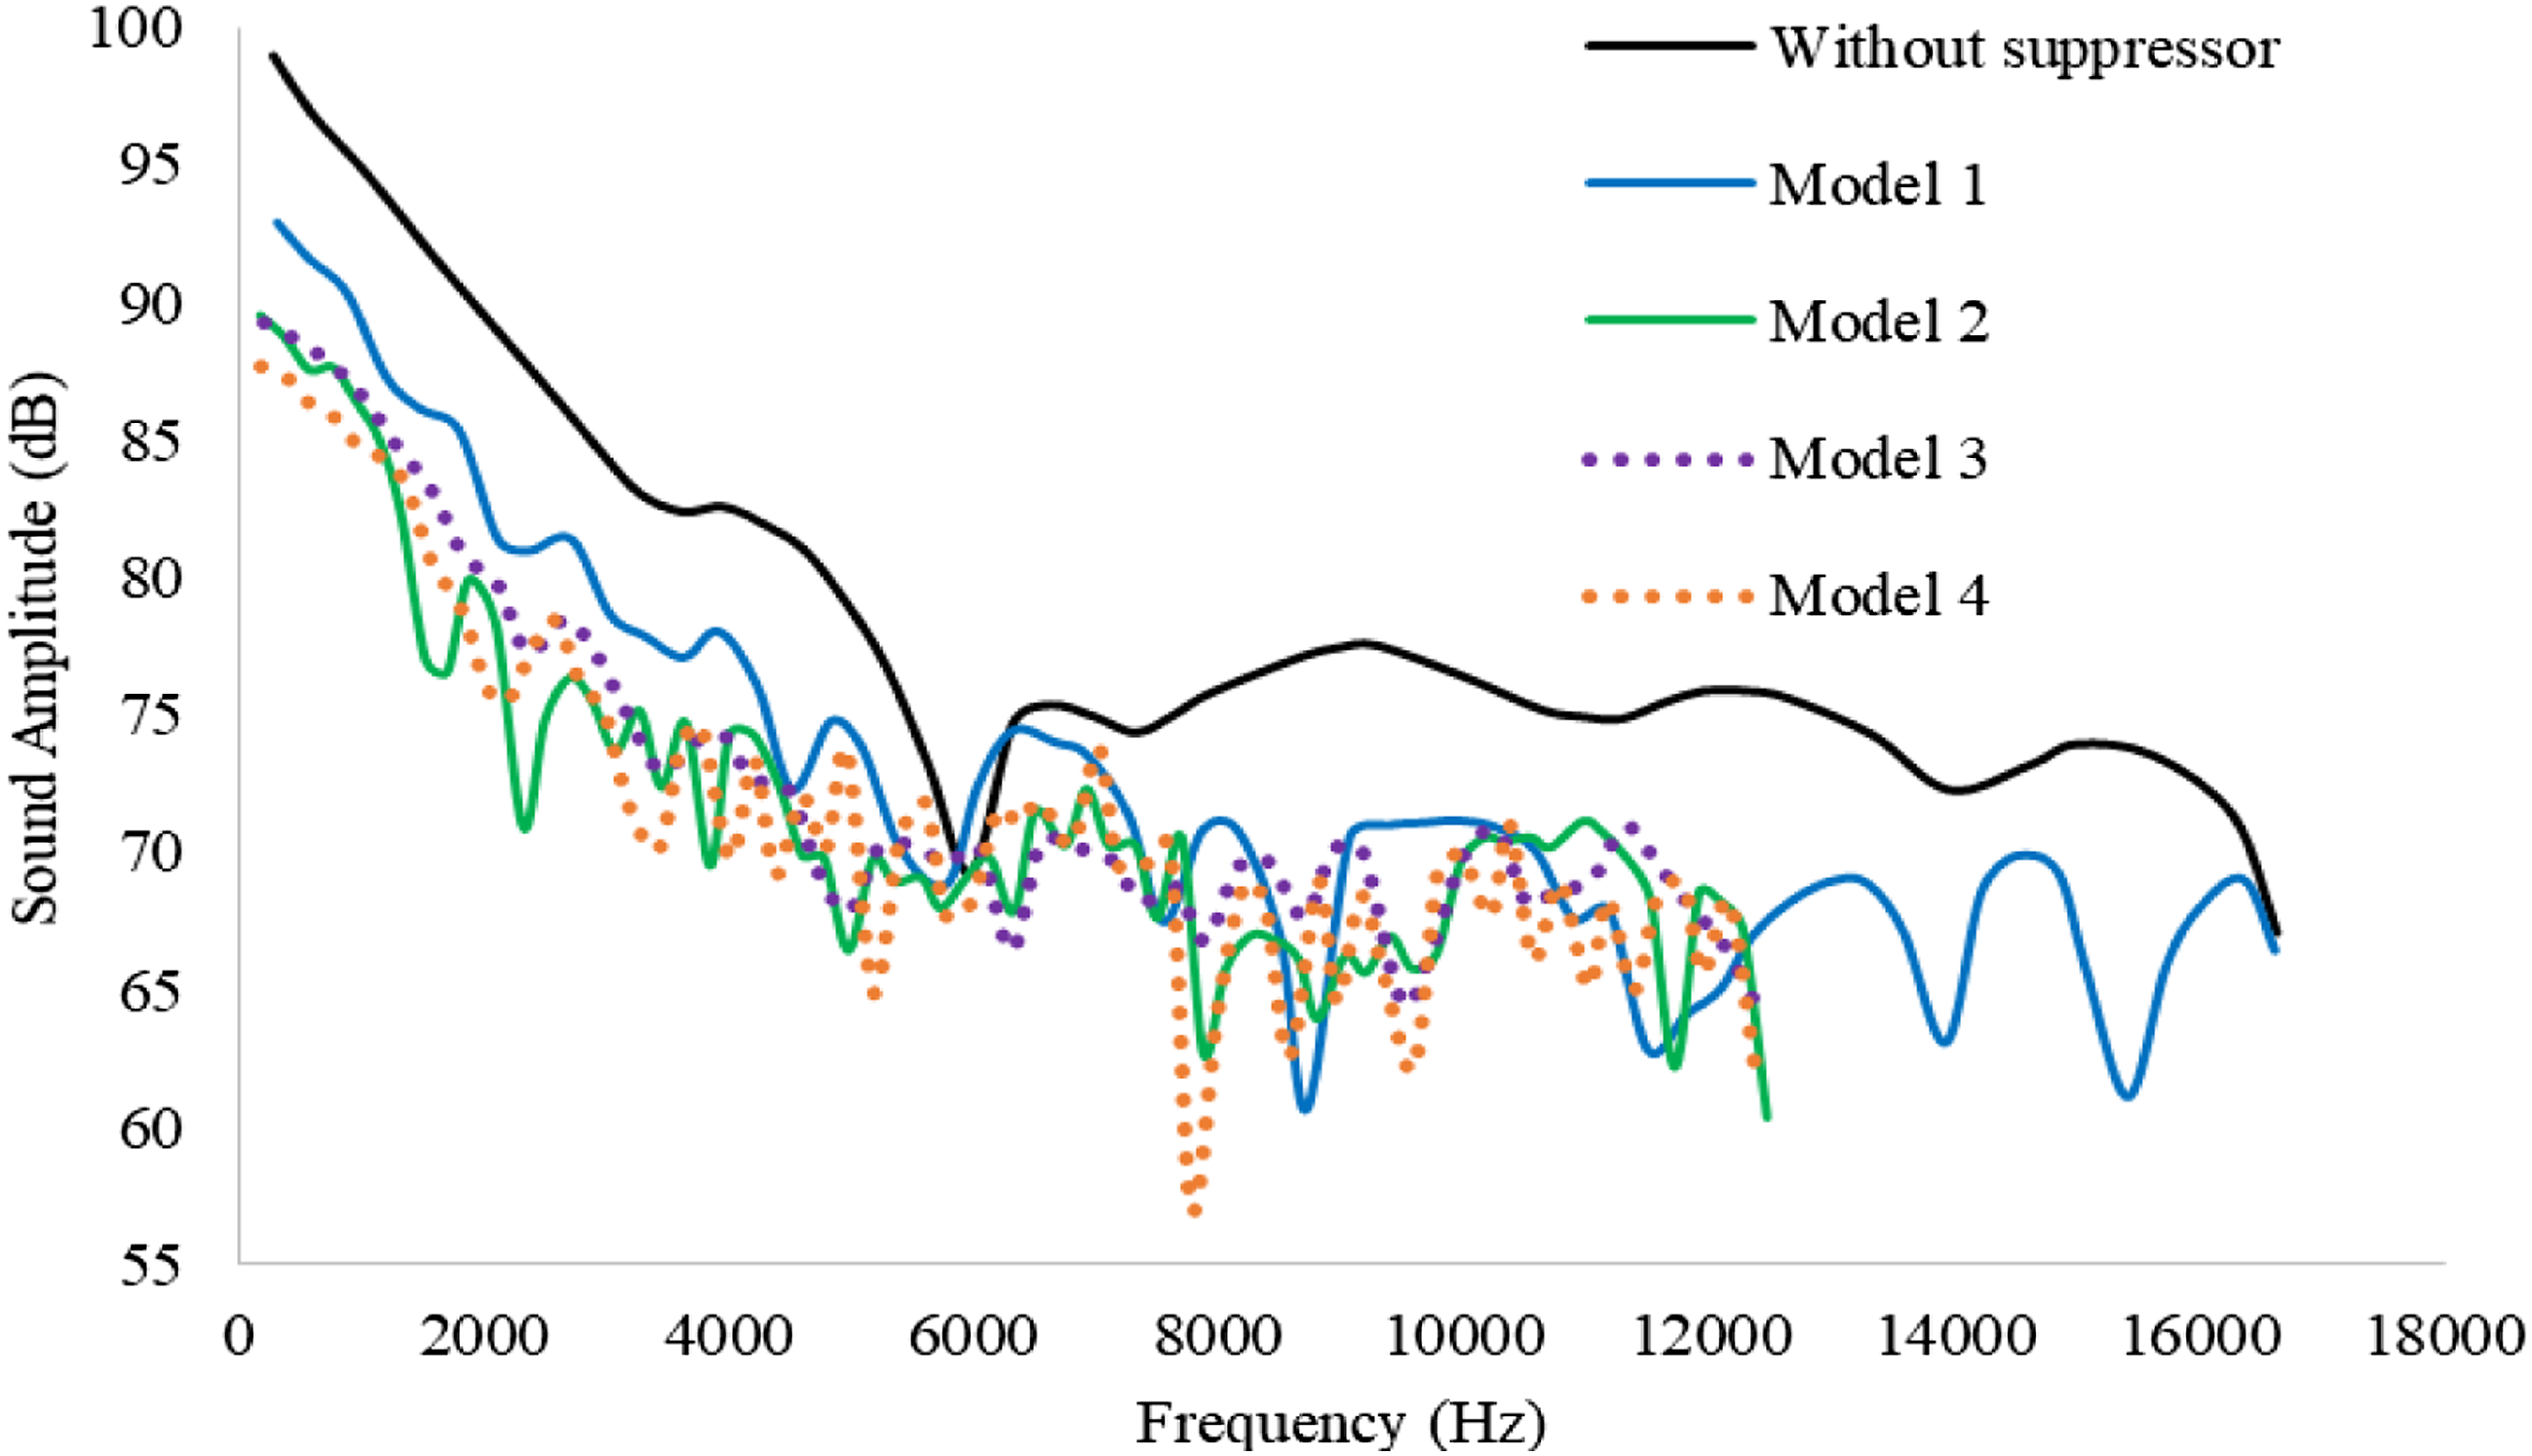
The change of maximum sound amplitude with silencer model geometries is given in Figure 19. As can be seen from the figure, the maximum sound amplitude decreased from 98.16 dB to 87.64 dB. The muffler predicted attenuation of nearly 11.34 dB Maximum sound amplitude versus suppressor models.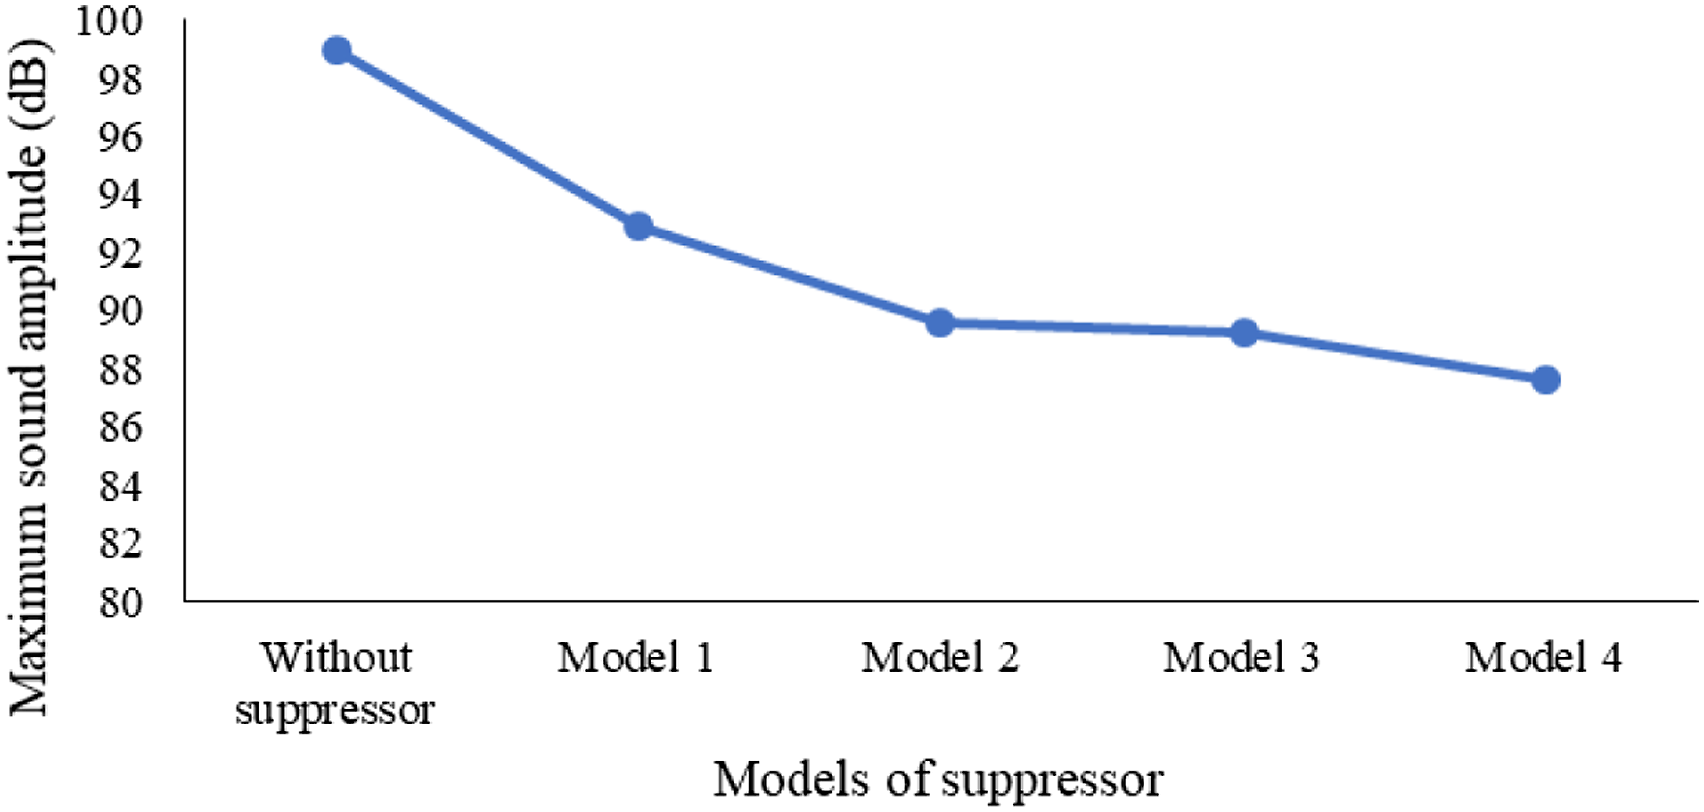
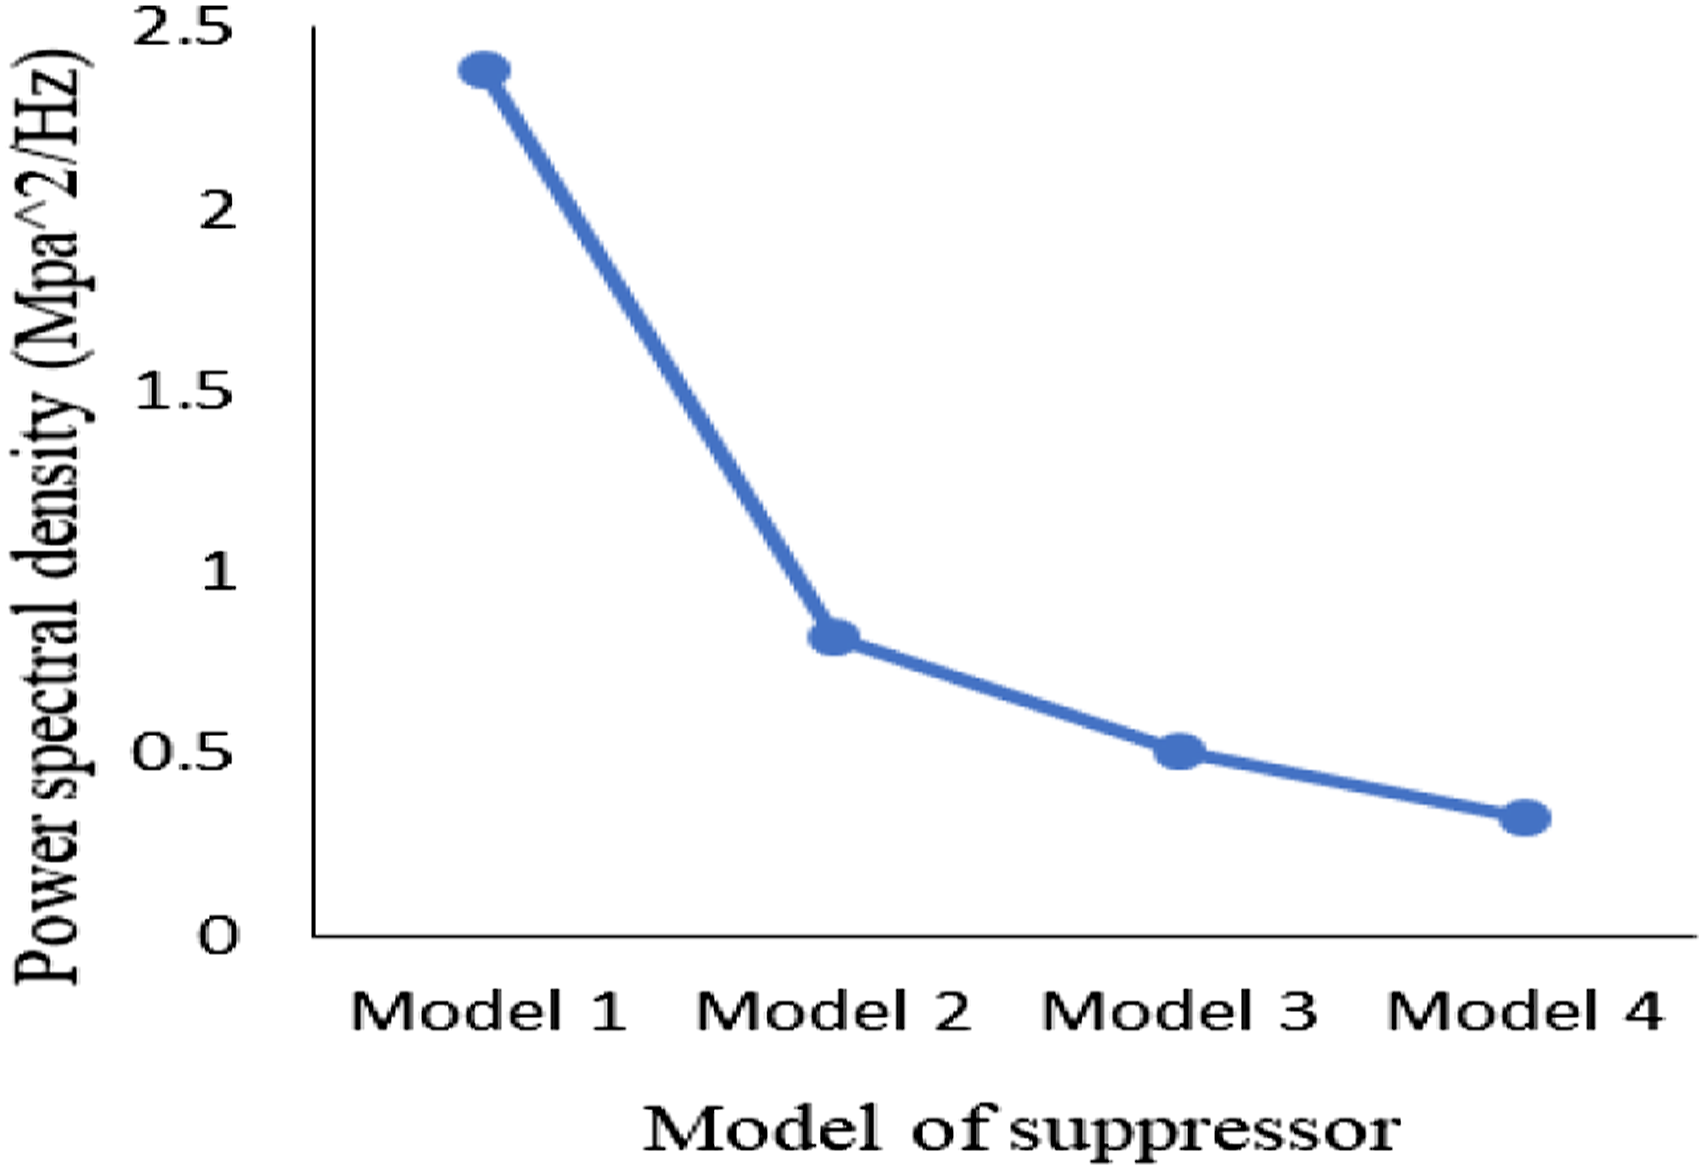
The change of power spectral density with frequency is shown in Figure 20 and the change of the peak power spectral density value with model geometries is shown in Figure 21. According to this graph, increasing the volume of the suppressor (diameter and length) decreases the explosion’s power spectral density (PSD). When PSD drops, the loudness decreases, resulting in better attenuation. The maximum power spectral density value for Model 1 was 2.389 MPa^2/Hz. Increasing the suppressor volume also further reduces the PSD value. For models 2, 3 and 4, the value of PSD was decreased to 0.823 MPa^2/Hz, 0.51 Mpa^2/Hz, and 0.327 MPa^2/Hz, respectively. From the figure, it is clear that there is a significant reduction in power spectral density, this reduction in PSD results in better attenuation. Power spectral density versus frequency. Maximum power spectral density versus suppressor models.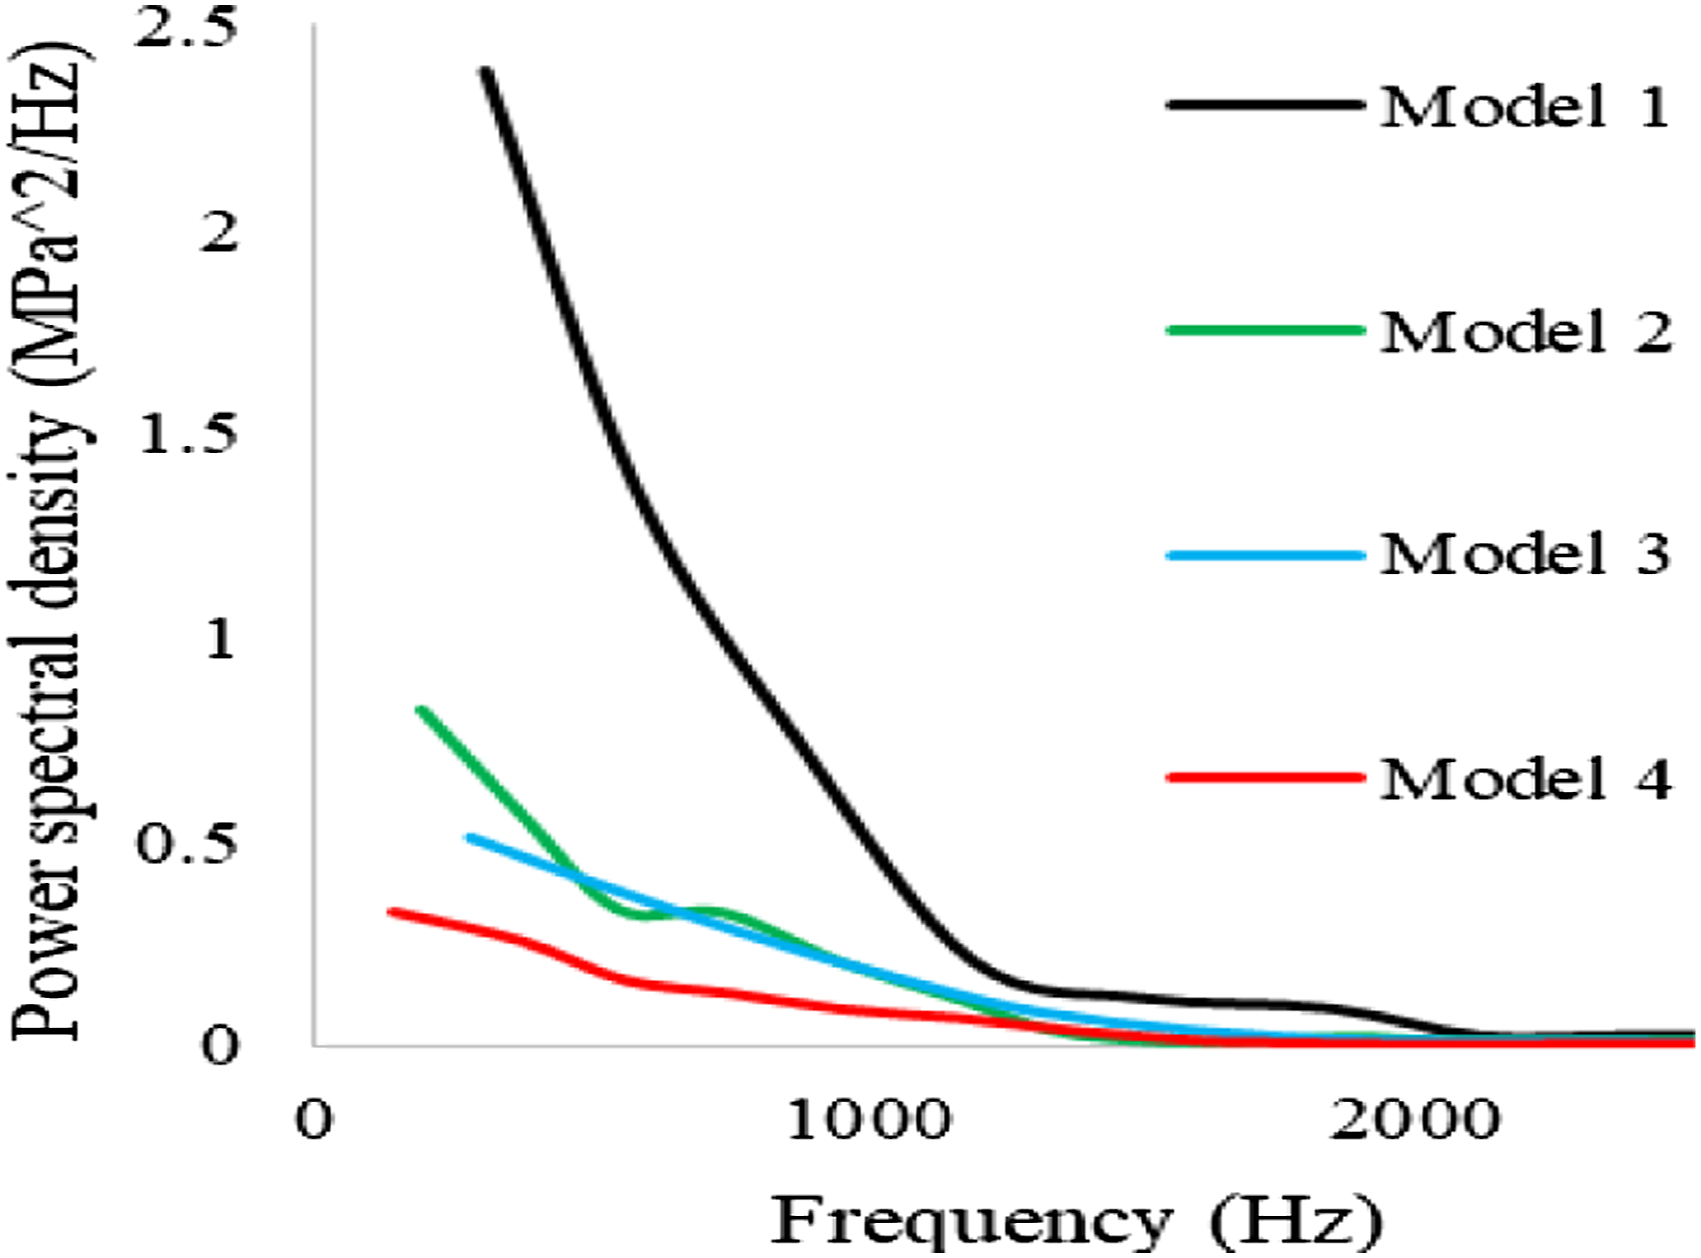
Conclusions
The study reveals the turbulent flow, vortices’ formation, and gas flow in the expansion chambers of the suppressor. A hybrid CFD-CAA technique was used to model a gas flow and its acoustic with and without a curved suppressor. The model was validated by comparison with experimental data. In this study, the maximum attenuation was achieved in a suppressor when the diameter and length increased by one-six. This suppressor achieved a 20.835 dB sound pressure level attenuation with 16.823 MPa overpressure reduction and 484.86 K or 32.32% temperature reduction.
The following conclusions can be made from this study • The overpressure reduction and the acoustic attenuation increase with the increase of the internal volume of the suppressor. This result indicates that the suppressor’s efficiency increases that the propellant gasses are released more slowly, reducing the pressure wave and giving the combustible mixture more time to react with the ambient oxygen and cool down fully. • The study reveals that increasing both the diameter and length of the suppressor increases the sound attenuation and the overpressure reduction. But for the same condition (for the same boundary condition and the same time and number of baffles) increasing length has a better effect than increasing diameter. • Generally, for excellent design, a proper balance between suppressor size and attenuation should be maintained to reduce the adverse effect of suppressor weight and size.
Footnotes
Declaration of conflicting interests
The author(s) declared no potential conflicts of interest with respect to the research, authorship, and/or publication of this article.
Funding
The author(s) received no financial support for the research, authorship, and/or publication of this article.
