
Abstract
This study investigates the corrosion-induced mechanical degradation of Q235 steel under simulated acid rain conditions. An artificial acid rain solution, simulating environmental conditions in Hebei Province, China, was applied through accelerated electrochemical corrosion testing. Following exposure, monotonic tensile tests were conducted to evaluate changes in mechanical properties, including yield strength, ultimate tensile strength, elastic modulus, elongation, and Poisson's ratio. To understand the corrosion mechanisms, microstructural analyses using scanning electron microscopy (SEM), X-ray diffraction (XRD), and energy-dispersive spectroscopy (EDS) were performed. The results indicate that acid rain corrosion promotes the formation of surface pits and microdefects, which intensify with increasing corrosion ratio and significantly weaken mechanical performance. Yield strength, tensile strength, elastic modulus, and elongation were observed to decrease progressively with corrosion, while Poisson's ratio slightly increased. SEM images show a transition from ductile to brittle fracture patterns, associated with localised stress concentration from pitting. XRD analysis reveals early formation of α-FeOOH and Fe3O4, which are gradually replaced by β-FeOOH and γ-FeOOH in later stages. EDS results further identify oxygen and nitrate ions as dominant contributors to corrosion propagation. Based on the experimental data, this study proposes linear empirical models (R2 > 0.80) to quantify the degradation of mechanical properties as a function of corrosion ratio. Compared to more complex nonlinear models, the proposed linear formulations offer comparable accuracy with improved simplicity, making them more suitable for engineering applications requiring rapid prediction. These findings provide practical guidance for the design and durability evaluation of steel structures exposed to acid rain environments.
Introduction
In recent decades, the intensification of anthropogenic emissions—particularly sulphur dioxide (SO₂) and nitrogen oxides (NOx)—has led to a significant increase in acid rain occurrence across industrial and urban regions. Acid precipitation, with a pH typically below 4.5, imposes serious environmental and engineering challenges, particularly for metallic infrastructure exposed to the atmosphere. Among the most affected are steel structures, whose service life can be substantially shortened due to progressive corrosion, cross-sectional loss, and the associated decline in mechanical performance.1–3 The deterioration of mechanical properties such as yield strength, ductility, and elastic modulus poses critical threats to structural safety and functionality, especially in long-span or high-stress applications. As a result, understanding the corrosion-induced degradation behaviour of commonly used structural steels under acid rain exposure is of significant importance for durability assessment and life-cycle design.
Q235 steel, a low-carbon structural steel designated under the GB/T 700 standard, is widely utilised in China and other developing regions due to its favourable combination of moderate strength, excellent weldability, and low production cost. It is extensively employed in civil infrastructure such as bridges, building frames, transmission towers, pipelines, and protective barriers. However, its microstructure—characterised by low-carbon content (∼0.16 wt.%) and the absence of alloying elements like Cr, Ni, or Mo—renders it particularly vulnerable to acidic corrosion mechanisms. Unlike weathering or stainless steels, Q235 steel lacks the passivating oxide films required to resist long-term acid exposure. In acid rain environments, hydrogen ions (H+) and sulphate/nitrate anions penetrate surface oxide layers, triggering localised pitting and uniform corrosion. These effects progressively weaken structural integrity through reductions in thickness and alterations in stress distribution.
This issue is especially acute in heavily industrialised areas such as Hebei Province, China, where SO₂ emissions from coal combustion and industrial processing contribute to extreme acid deposition. Field studies have reported SO₂ deposition rates exceeding 25 kg/ha annually, with steel corrosion rates surpassing 80 μm/year in exposed environments.4,5 While considerable research has focused on chloride-induced corrosion in marine or deicing salt environments,6–9 relatively few studies have systematically addressed the mechanical performance degradation of Q235 steel in acid rain conditions. Existing work is often limited to surface observations or mass-loss measurements, with limited integration of mechanical property evolution, full stress–strain responses, or microstructural mechanisms such as pitting morphology and grain boundary attack.
In this study, a comprehensive experimental program is conducted to investigate the mechanical degradation of Q235 steel under simulated acid rain exposure. The research integrates monotonic tensile testing with microstructural analysis techniques—including scanning electron microscopy (SEM), X-ray diffraction (XRD), and energy-dispersive spectroscopy (EDS)—to evaluate corrosion-induced changes in yield strength, ultimate tensile strength, elongation, elastic modulus, and Poisson's ratio. Based on the experimental data, a set of corrosion-dependent empirical degradation models is proposed, and constitutive stress–strain relationships are developed to reflect the observed deterioration mechanisms.
Unlike previous research that tends to focus on individual properties or simplified corrosion assumptions, this work establishes an integrated mechanical–microstructural framework that links localised corrosion (e.g. pitting and oxide breakdown) with macroscopic mechanical behaviour. The proposed models provide a simplified yet accurate basis for predicting performance loss in Q235 steel under acid rain exposure, offering practical value for structural design, safety assessment, and durability management in corrosive atmospheric environments.
Experimental programme
Composition of simulated acid rain and steel
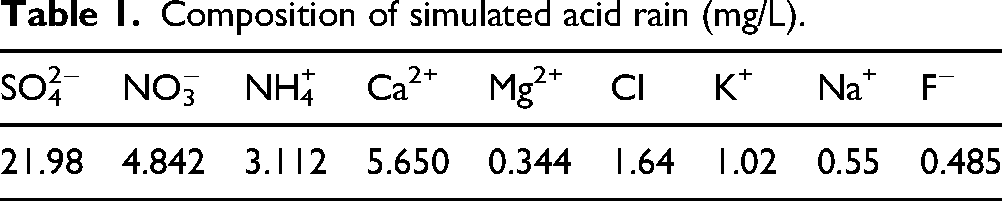
Using the case of acid rain in Hebei Province, China, this study refers to the urban precipitation data outlined in the 2023 Bulletin on the Ecological Environmental Status of Hebei Province. In regions experiencing heavy acid rain, the pH level is recorded to be below 4.5, with the frequency of urban acid rain across the province reaching 35.8%. 10 To replicate the conditions of acid rain, a simulated acid rain solution was developed based on the average composition observed in the Tangshan area over the past 5 years. The formulation of this simulated acid rain solution involved the use of anhydrous ammonium sulphate, magnesium sulphate, as well as concentrated sulphuric acid and nitric acid solutions, as detailed in Table 1. The pH of the final solution was calibrated by incorporating H2SO4 and HNO3 to achieve a set pH of 4.5.
Composition of simulated acid rain (mg/L).
To maintain the stability of the pH level in the artificial acid rain solution, measurements of the pH were taken every 6 hours. If the pH value deviated by more than 0.3 from the initial reading, the solution was replaced accordingly. The chemical composition of Q235 steel, produced by the Nangang Group in China, is presented in Table 2.
Composition of Q235 (wt.%).

Specimen preparation
The tensile test specimen was designed according to GB/T228.1, 11 with specific dimensions as shown in Figure 1, and an initial thickness of 3 mm. In order to improve the uniformity of the test results, before the accelerated corrosion test, all surfaces of the specimen were polished with 600-grade emery paper to remove the original metal surface layer, and then cleaned with medical cotton balls dipped in acetone solution, and the surface was wiped dry and placed at room temperature to measure the mass.
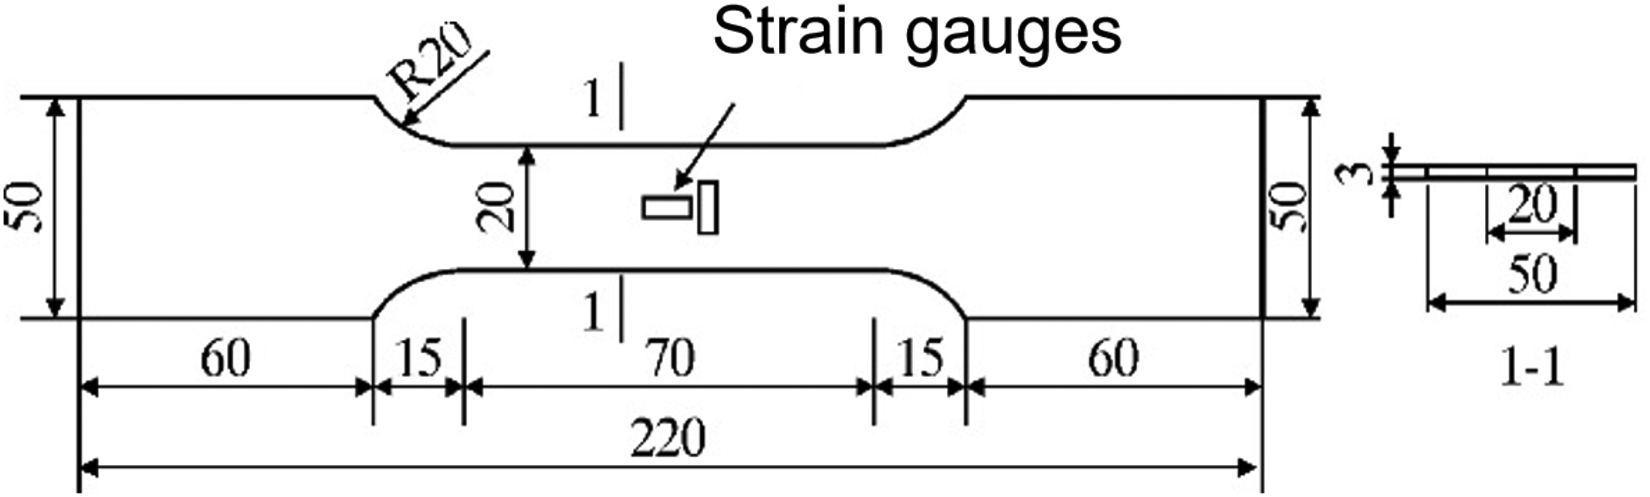
Tensile coupons details.
Accelerated acid rain corrosion test
The investigation of this corrosive impact induced by acid precipitation endeavours through an accelerated scrutiny facilitated indoors, utilising the direct application of electrical current. To execute such a method is to establish an apparatus comprising principally of a receptacle for liquid containment, alongside a power supply which assures consistent electrification; therein lies also a solution representing synthetic acid precipitation as well as conductive cables connecting these components.
The prepared artificial acid rain solution is placed in the test container, and all the samples are immersed in the solution. Three parallel samples are taken for each test. In order to avoid contact between the sample and the container wall, wooden blocks of the same size are placed under the wide mouths at both ends of the specimen. When the sample is immersed in the solution, the sample must be completely covered by the solution and at least 10 mm below the surface of the solution. The positive pole of the constant current power supply is connected to the tensile specimen, and the negative pole is connected to the conductive rod. The specific connection method of the test device is shown in Figure 2.
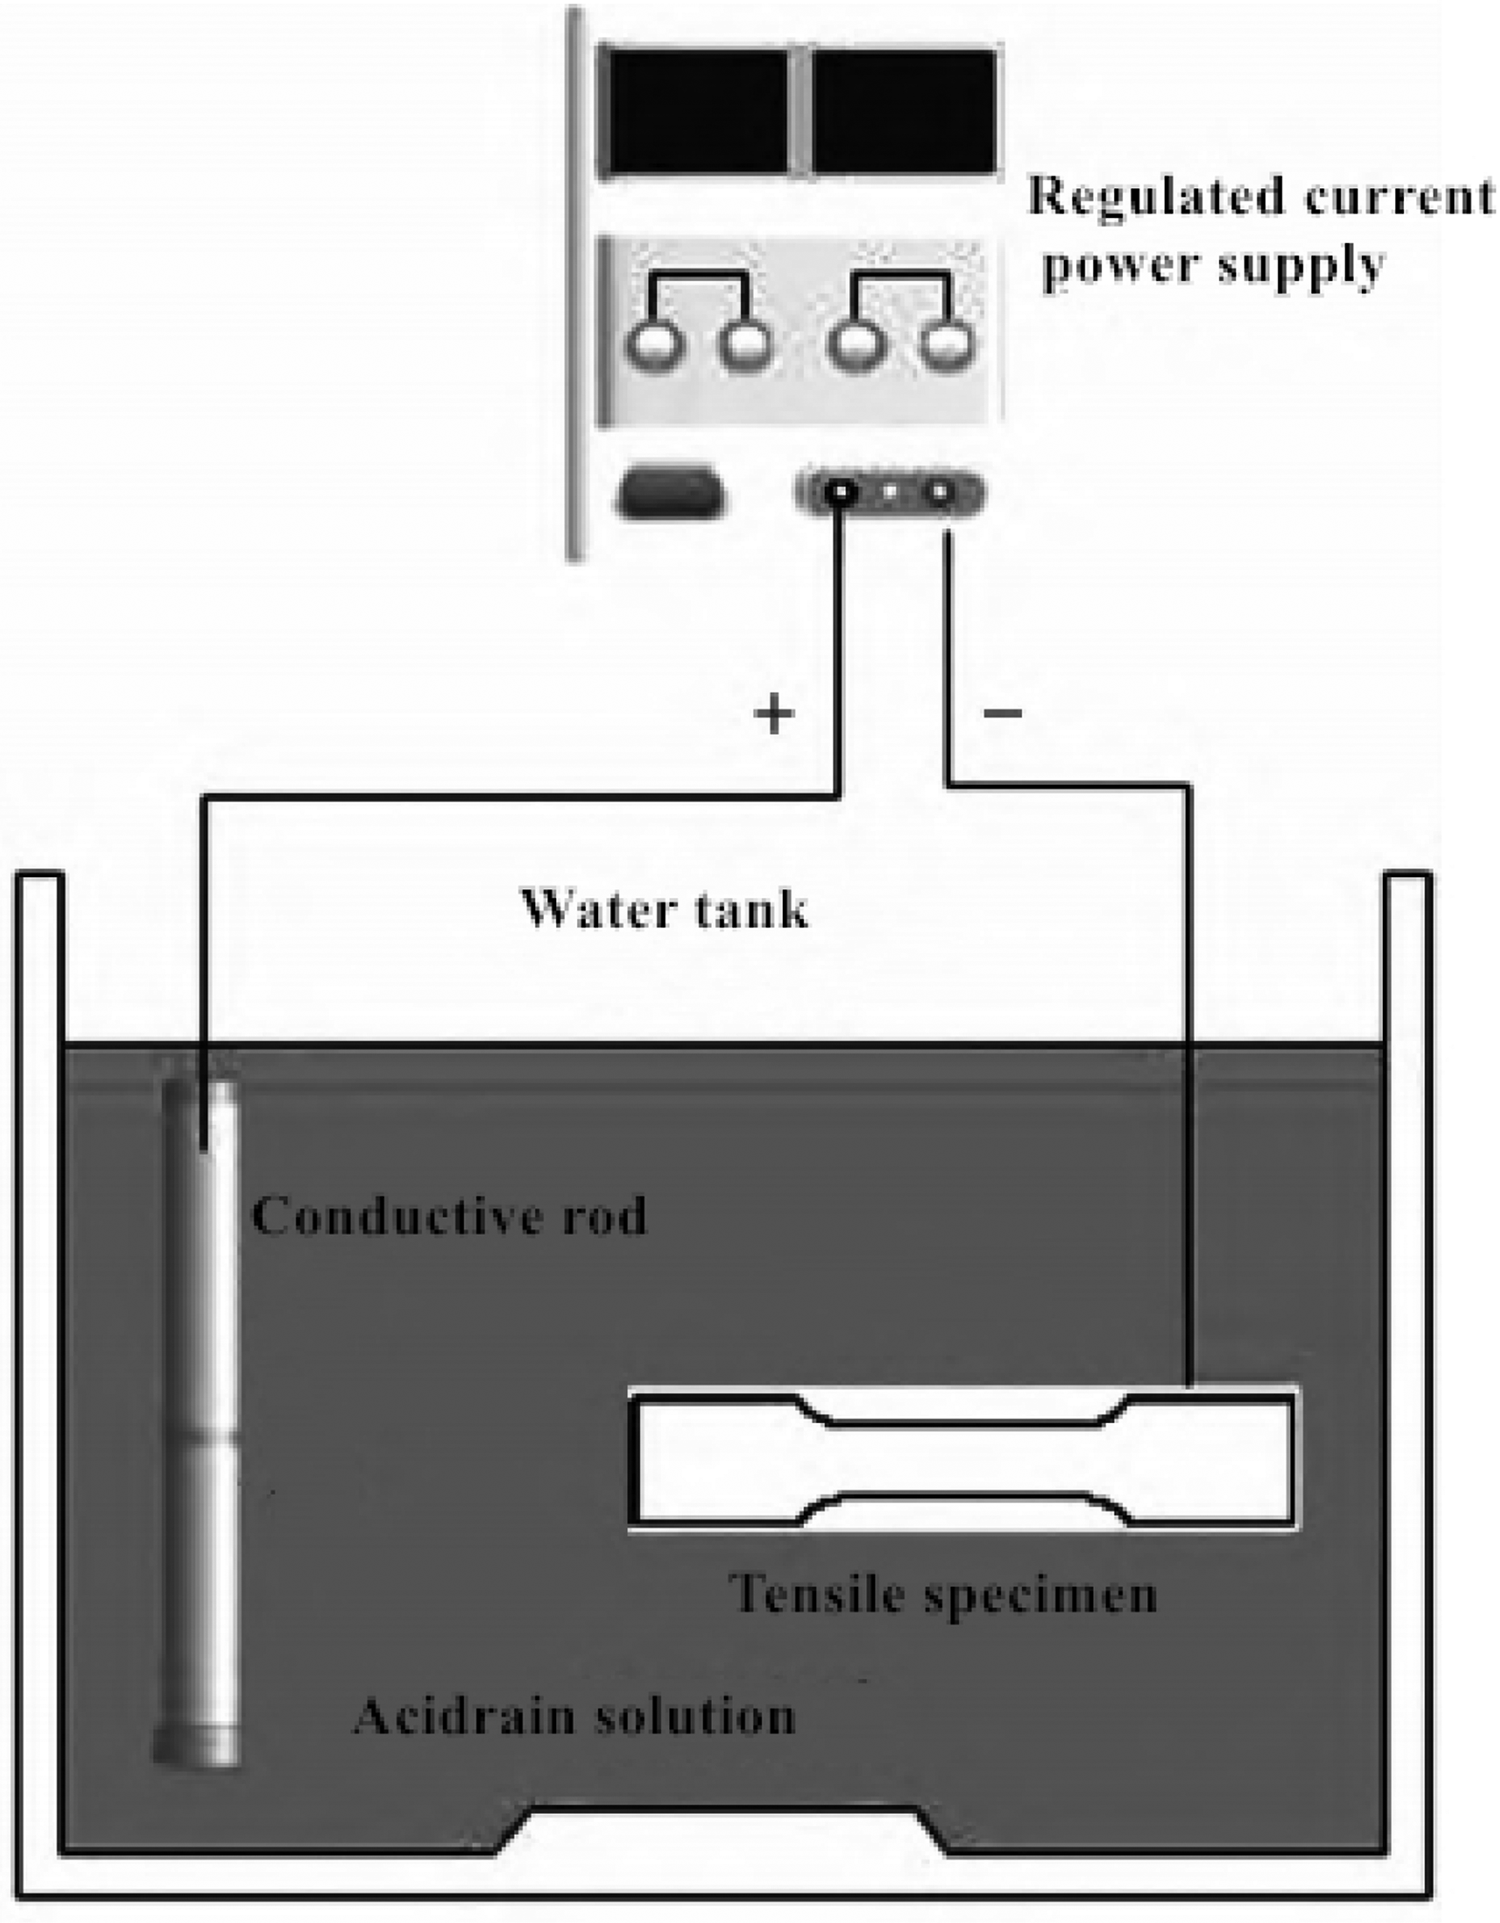
Connection diagram of corrosion test device.
The power-on time is controlled according to the theoretical formula of Faraday's law. The specific calculation steps are shown in Equation (1):
According to the experience in the literature,
12
the current density in this experiment is controlled as 2.0 × 10⁻⁴ A/cm2. After the specimen was energised, a large number of bubbles were immediately generated on the conductive metal surface connected to the negative electrode. These bubbles were generated by the H+ in the acid rain solution after it gained electrons. As the energisation time increased, the solution gradually changed from clear white to yellow-green. The iron element in the surface tensile specimen formed free Fe2+ after losing electrons. The electrode reaction was as shown in Equations (2) and (3). Then the yellow-green colour disappeared and the solution turned yellow-brown. This was because the free Fe2+ in the solution continued to lose electrons and formed Fe3+. The electrode reaction is as shown in Equations (4) and (5).


Test setup
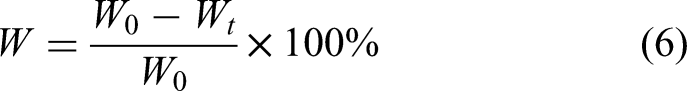
Before the experiment, the milled samples were cleaned using ultrasonic cleaning with ethanol for 10 min, followed by a 5-min cleaning with acetone. After being blow-dried and subsequently dried in an oven, the specimens were prepared for calculating the corrosion rate. The weights of each specimen were measured with an electronic balance and recorded prior to the experiment. After the rust layer was effectively removed, the samples were rinsed with deionised water and subsequently dried using cold air. Following this procedure, the samples were weighed on a digital balance with a precision of 0.0001 g to determine the weight loss ratio (W) using Equation (6)
6
:
Evaluation of the mechanical properties inherent to each specimen was undertaken through utilisation of a tensile testing apparatus. As prescribed by the Chinese standard GB/T 228, execution of these tensile experiments adhered strictly to protocol. A sustained stress rate of 10 MPa/s characterised the elastic domain, transitioning subsequently into a yielding phase governed by a strain rate fixed at 0.001 s. Furthermore, an unwavering displacement velocity of 10 mm/min persisted until such point as material failure manifested.
The Q235 specimen was analysed using the SANS device to assess the residual stress–strain curve and its mechanical properties after corrosion (refer to Figure 2(b)). The specimen was positioned between the upper and lower fixtures, with the lower fixture fixed in place and the upper fixture allowing free upward movement. A 50 mm gauge length extensometer was utilised to measure the tensile deformation of the specimen. In cases of specimen failure, the ultimate elongation was determined using a micrometer.
Results and discussion
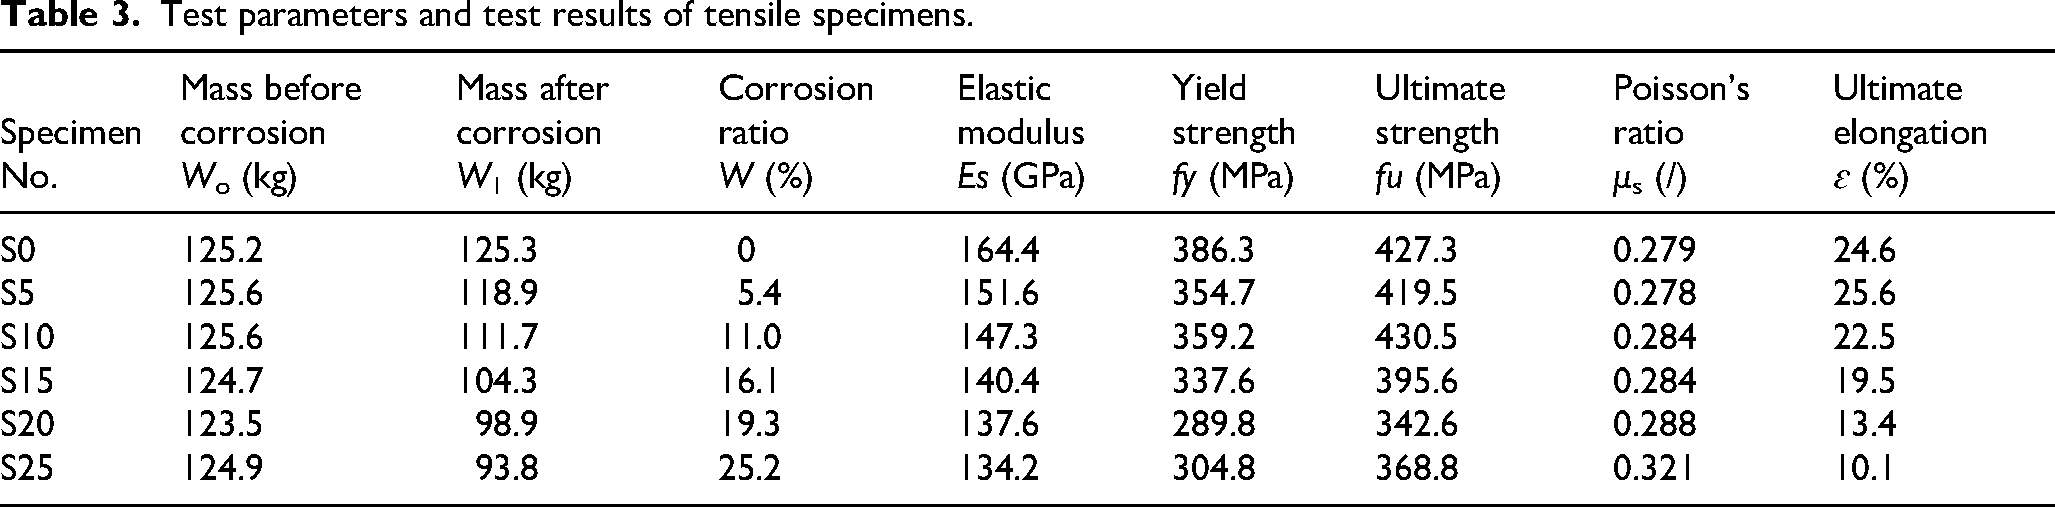
Table 3 presents the residual properties of Q345 steel following testing, which include residual yield stress (fy), ultimate tensile strength (fu), elastic modulus (Es), Poisson's ratio (µs), and ultimate elongation (ε).
Test parameters and test results of tensile specimens.
Stress–strain curve
Under various test conditions delineated in Figure 3 are the load–displacement trajectories pertaining to the coating/steel substrate system. A pattern emerges wherein an initial linear elasticity is succeeded by a yield plateau observable at room temperature. Table 3 encapsulates the calculation outcomes. From this compilation, it follows that corrosion notably impairs the elastic modulus of the coatings subjected to damage. Notably, the mechanical properties of the steel substrate system demonstrate heightened sensitivity to mildly acidic environments, with pH levels ranging from 5 to 7. As the degree of corrosion of the steel substrate increases, there is a corresponding decline in its strength; furthermore, a higher corrosion rate is associated with a reduced arc duration of the elastic-plastic deformation phase within the stress–strain curve. This observation indicates that the transition time from the elastic-plastic phase to the strain-hardening stage is minimised.
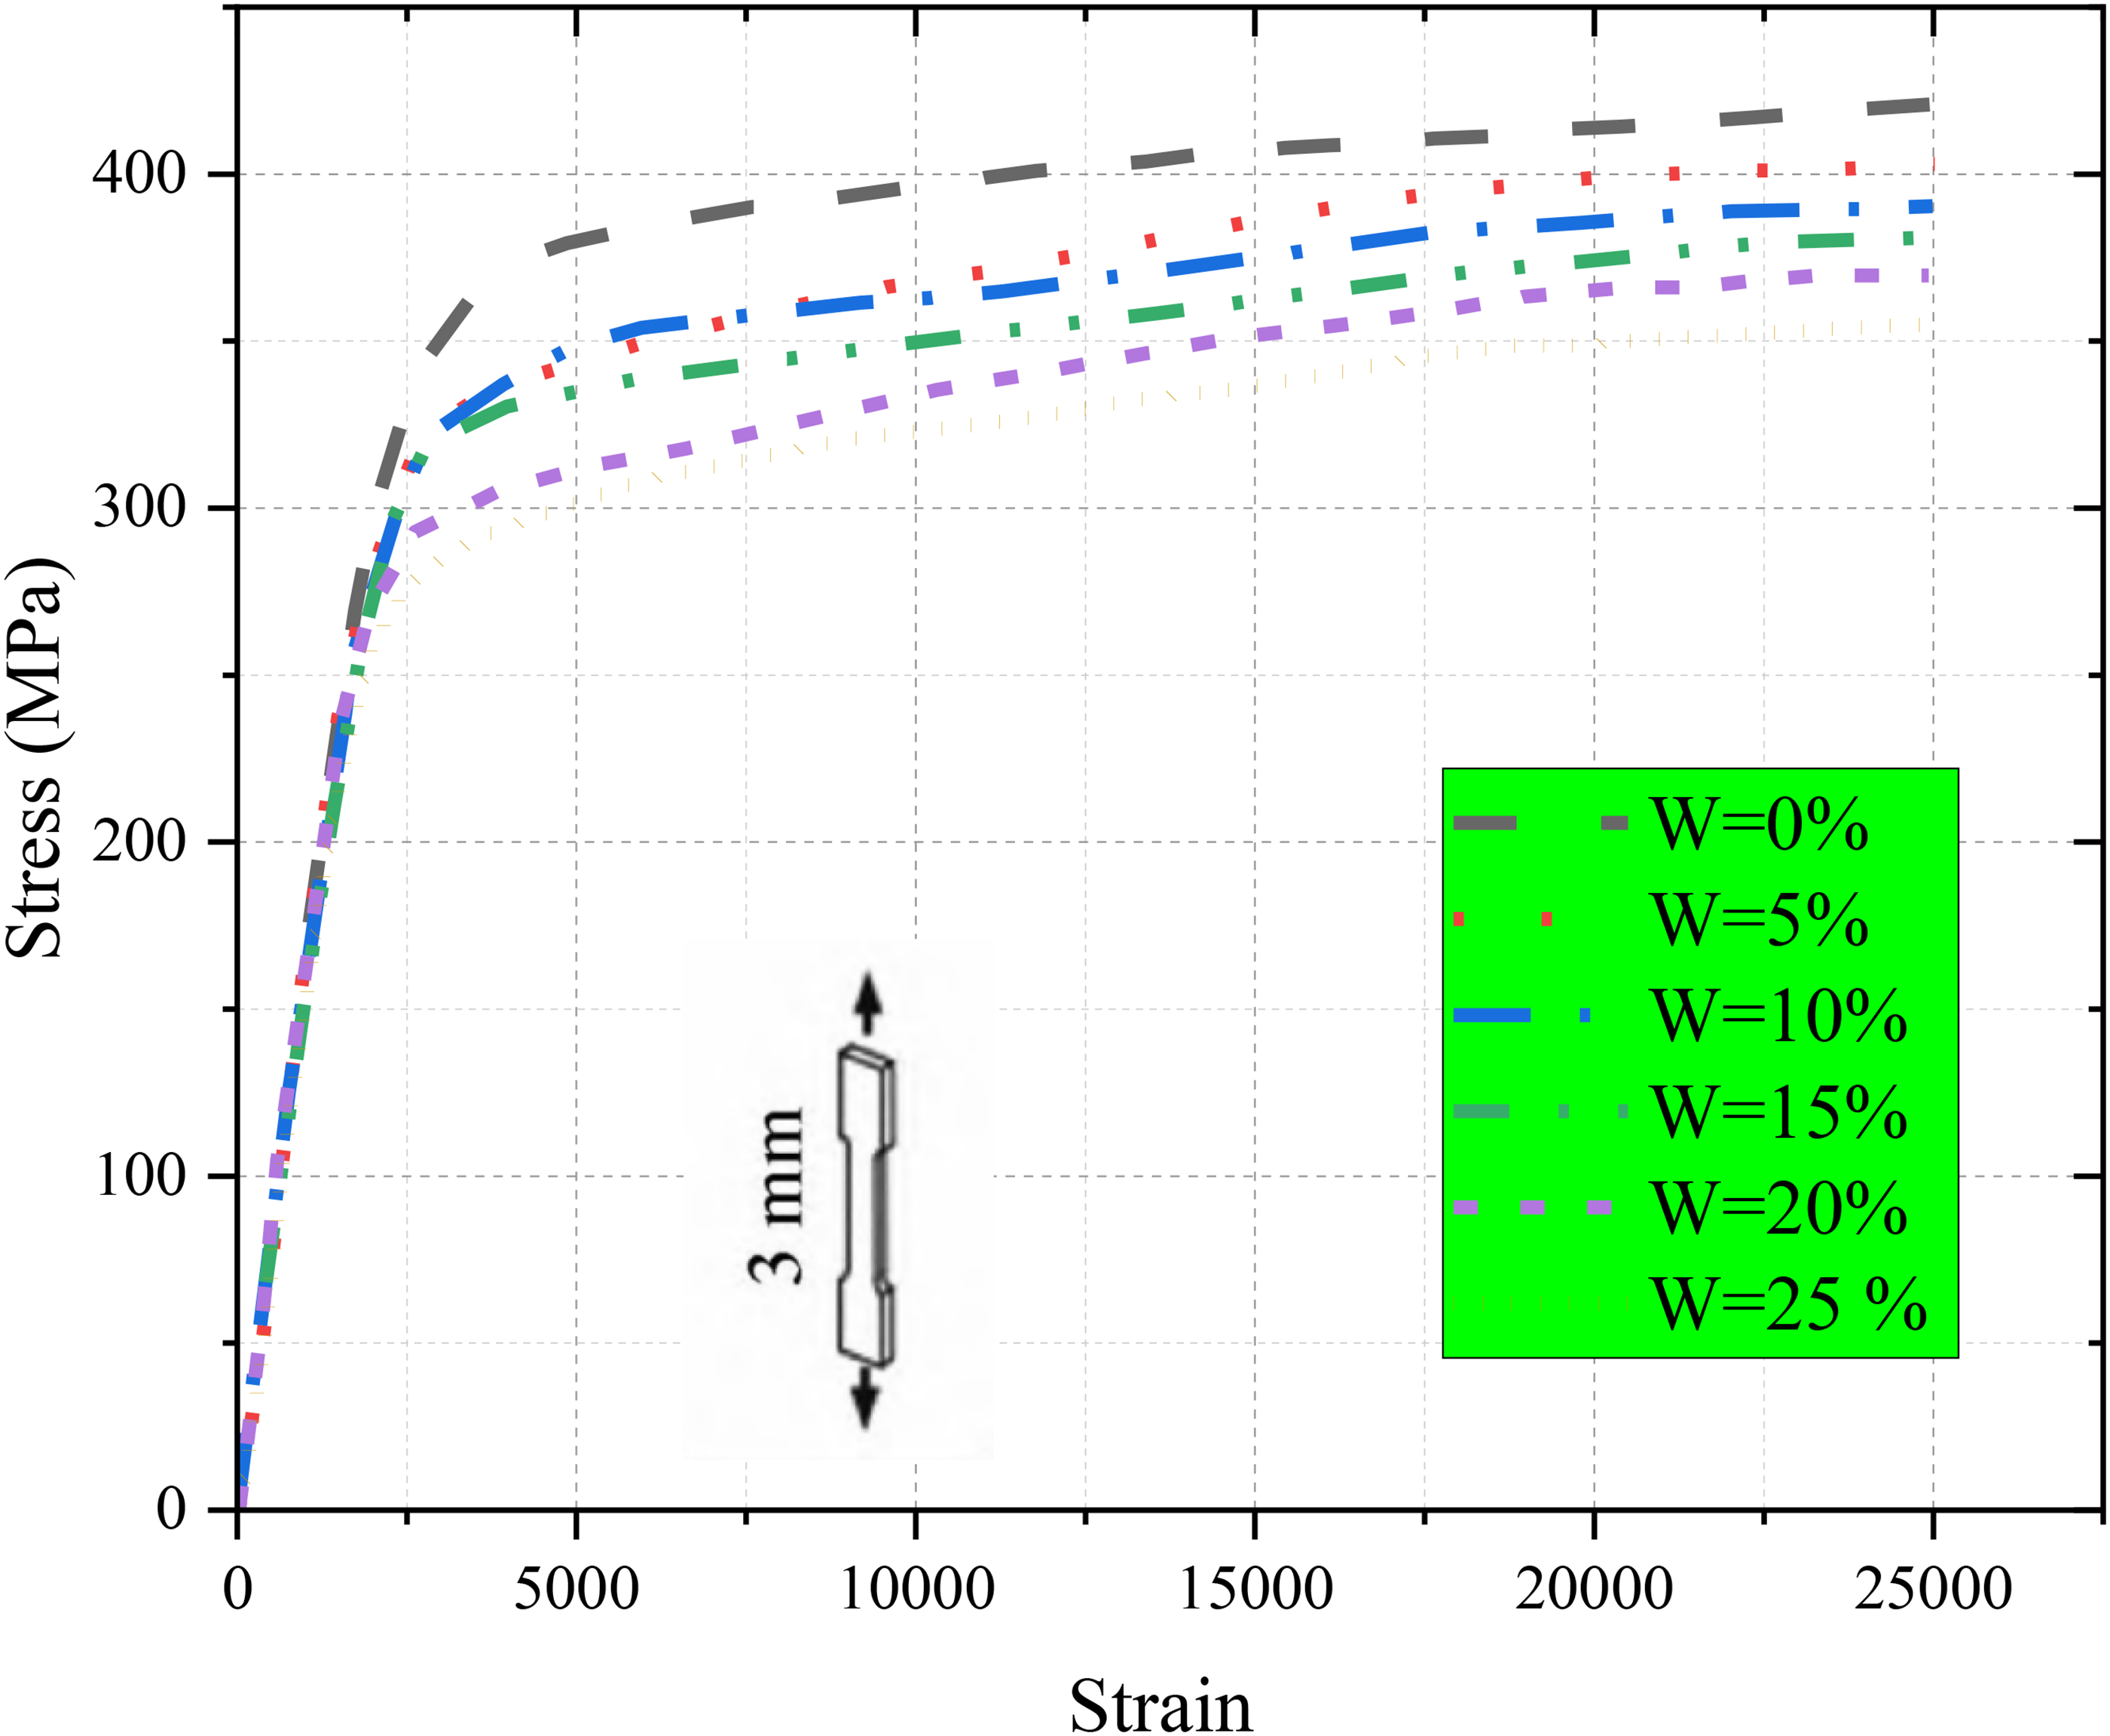
Stress–strain curves of Q235 steel following exposure to acid rain and subsequent tensile testing.
The absence of a distinct yield plateau in certain stress–strain curves can be attributed to the reduced strain-hardening capacity, which likely results from stress concentrations introduced by corrosion pits. SEM analysis (Results from scanning electron microscopy analysis section) provides supporting microstructural evidence: specimens exhibiting this mechanical response also show increased cleavage facets, intergranular cracking, and pit-induced microvoids on the fracture surface. These features are indicative of brittle fracture mechanisms and localised plastic constraint, which inhibit uniform plastic deformation. The alignment between mechanical softening and SEM-detected damage morphology suggests that pit-driven surface deterioration directly impairs the material's ability to develop strain hardening, thereby suppressing the formation of a classical yield plateau.
Results of micro-corrosion morphologies
The micro-corrosion morphologies observed on the surface of Q235 steel at various stages of corrosion are illustrated in Figure 4. It can be seen from Figure 4 that after acid rain corrosion, there are uneven corrosion marks on the surface of the sample, and the corrosion form belongs to pitting. The number, size and distribution of pits on the surface of the sample under different corrosion rates show different changes. The basic rule is that when W ≤ 10%, as the corrosion rate increases, the number of pits increases and the distribution becomes denser. Some pits intersect with each other, which increases the surface area and depth of the pits. When 25% ≥ W ≥ 15%, the pits generated on the surface of the sample tend to be more obvious and dense, forming a pit colony, and new pits are generated in the colony. The surface has a larger area of hemispherical pits.
Comparison of surface micro morphology of the tensile specimens with different corrosion rates: (a) W = 5%, (b) W = 10%, (c) W = 15%, (d) W = 20%, and (e) W = 25%.
Failure mode
Figure 5 presents photos of specimens that have failed under various corrosive conditions and loading, ranging from 0 to 60 MPa. Two distinct failure modes were observed based on the degree of corrosion: 1) fractures perpendicular to the specimen's axis, and 2) fractures occurring at an angle to the axis. For specimens with a low corrosion ratio (W ≤ 10%)), normal fractures predominated. In contrast, specimens with a high corrosion rate (25% ≥ W ≥ 15%) primarily exhibited oblique fractures. This shift in failure mode is largely attributed to water cooling, which leads to a significant reduction in the steel's brittleness and ductility. 10
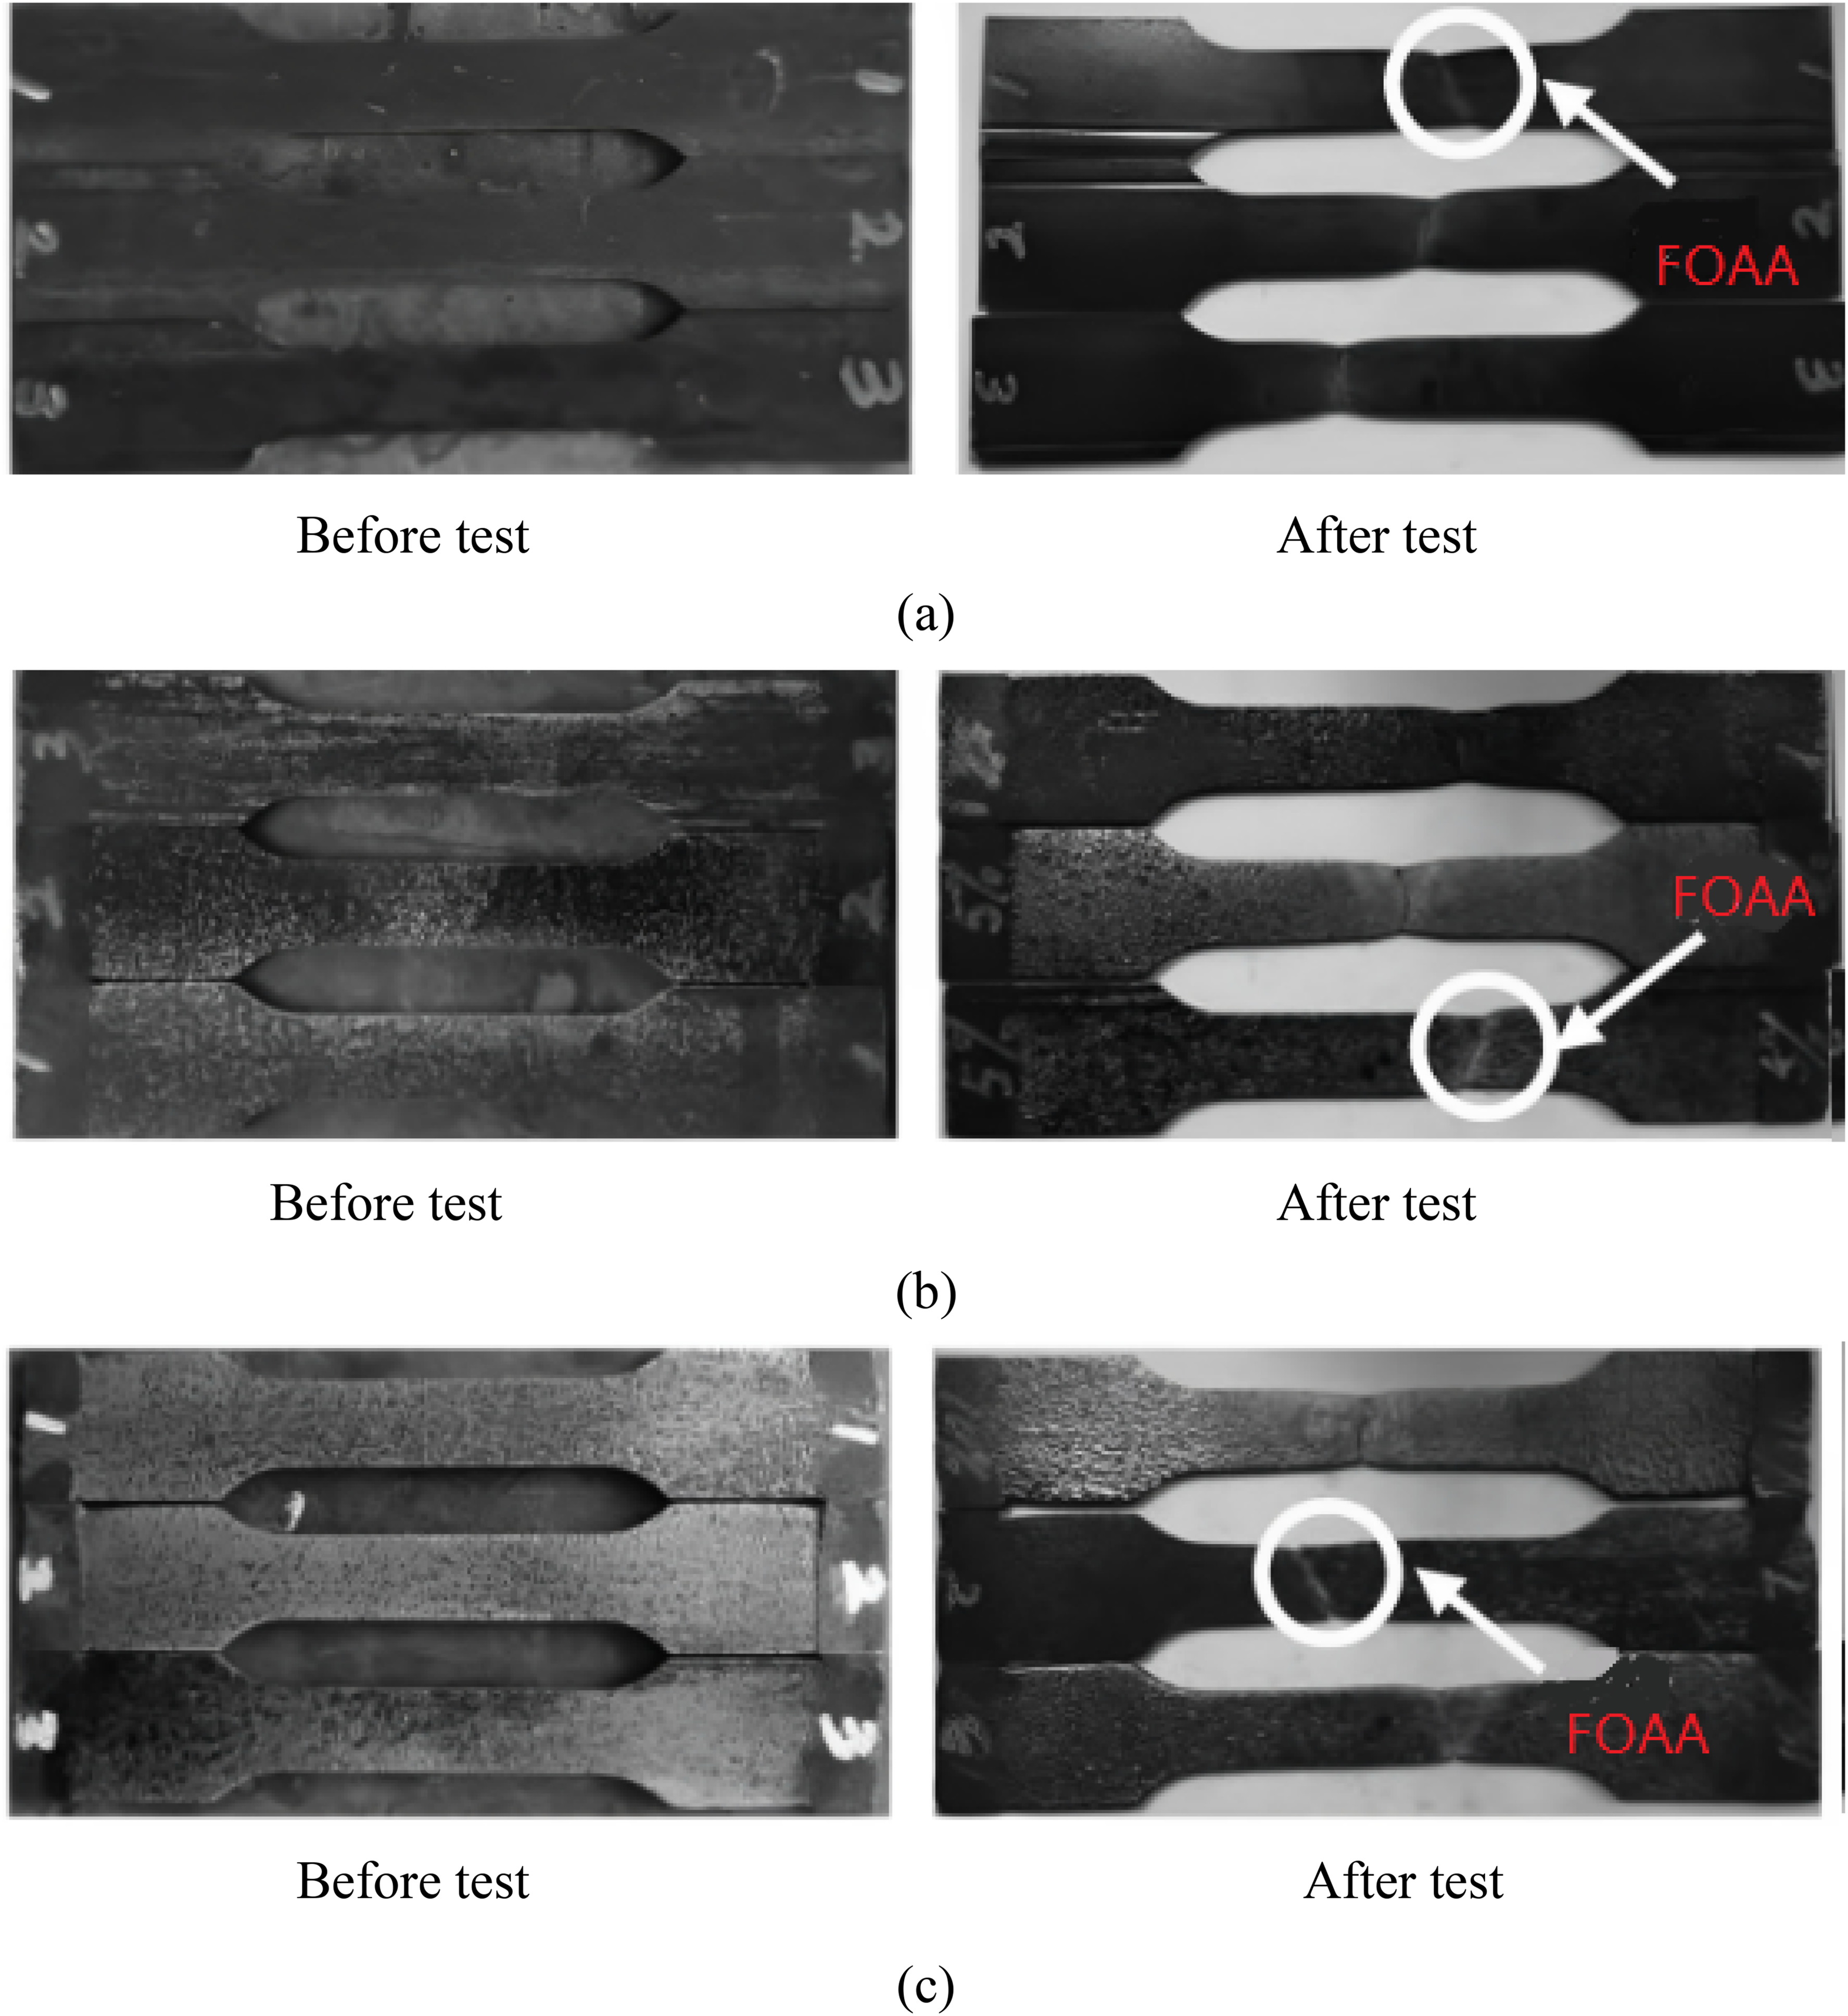
Comparison of surface micro morphology of the tensile specimens with different corrosion rates: (a) W = 0%, (b) W = 5%, (c) W = 10%, (d) W = 15%, (e) W = 20%, and (f) W = 25%.
Results from scanning electron microscopy analysis
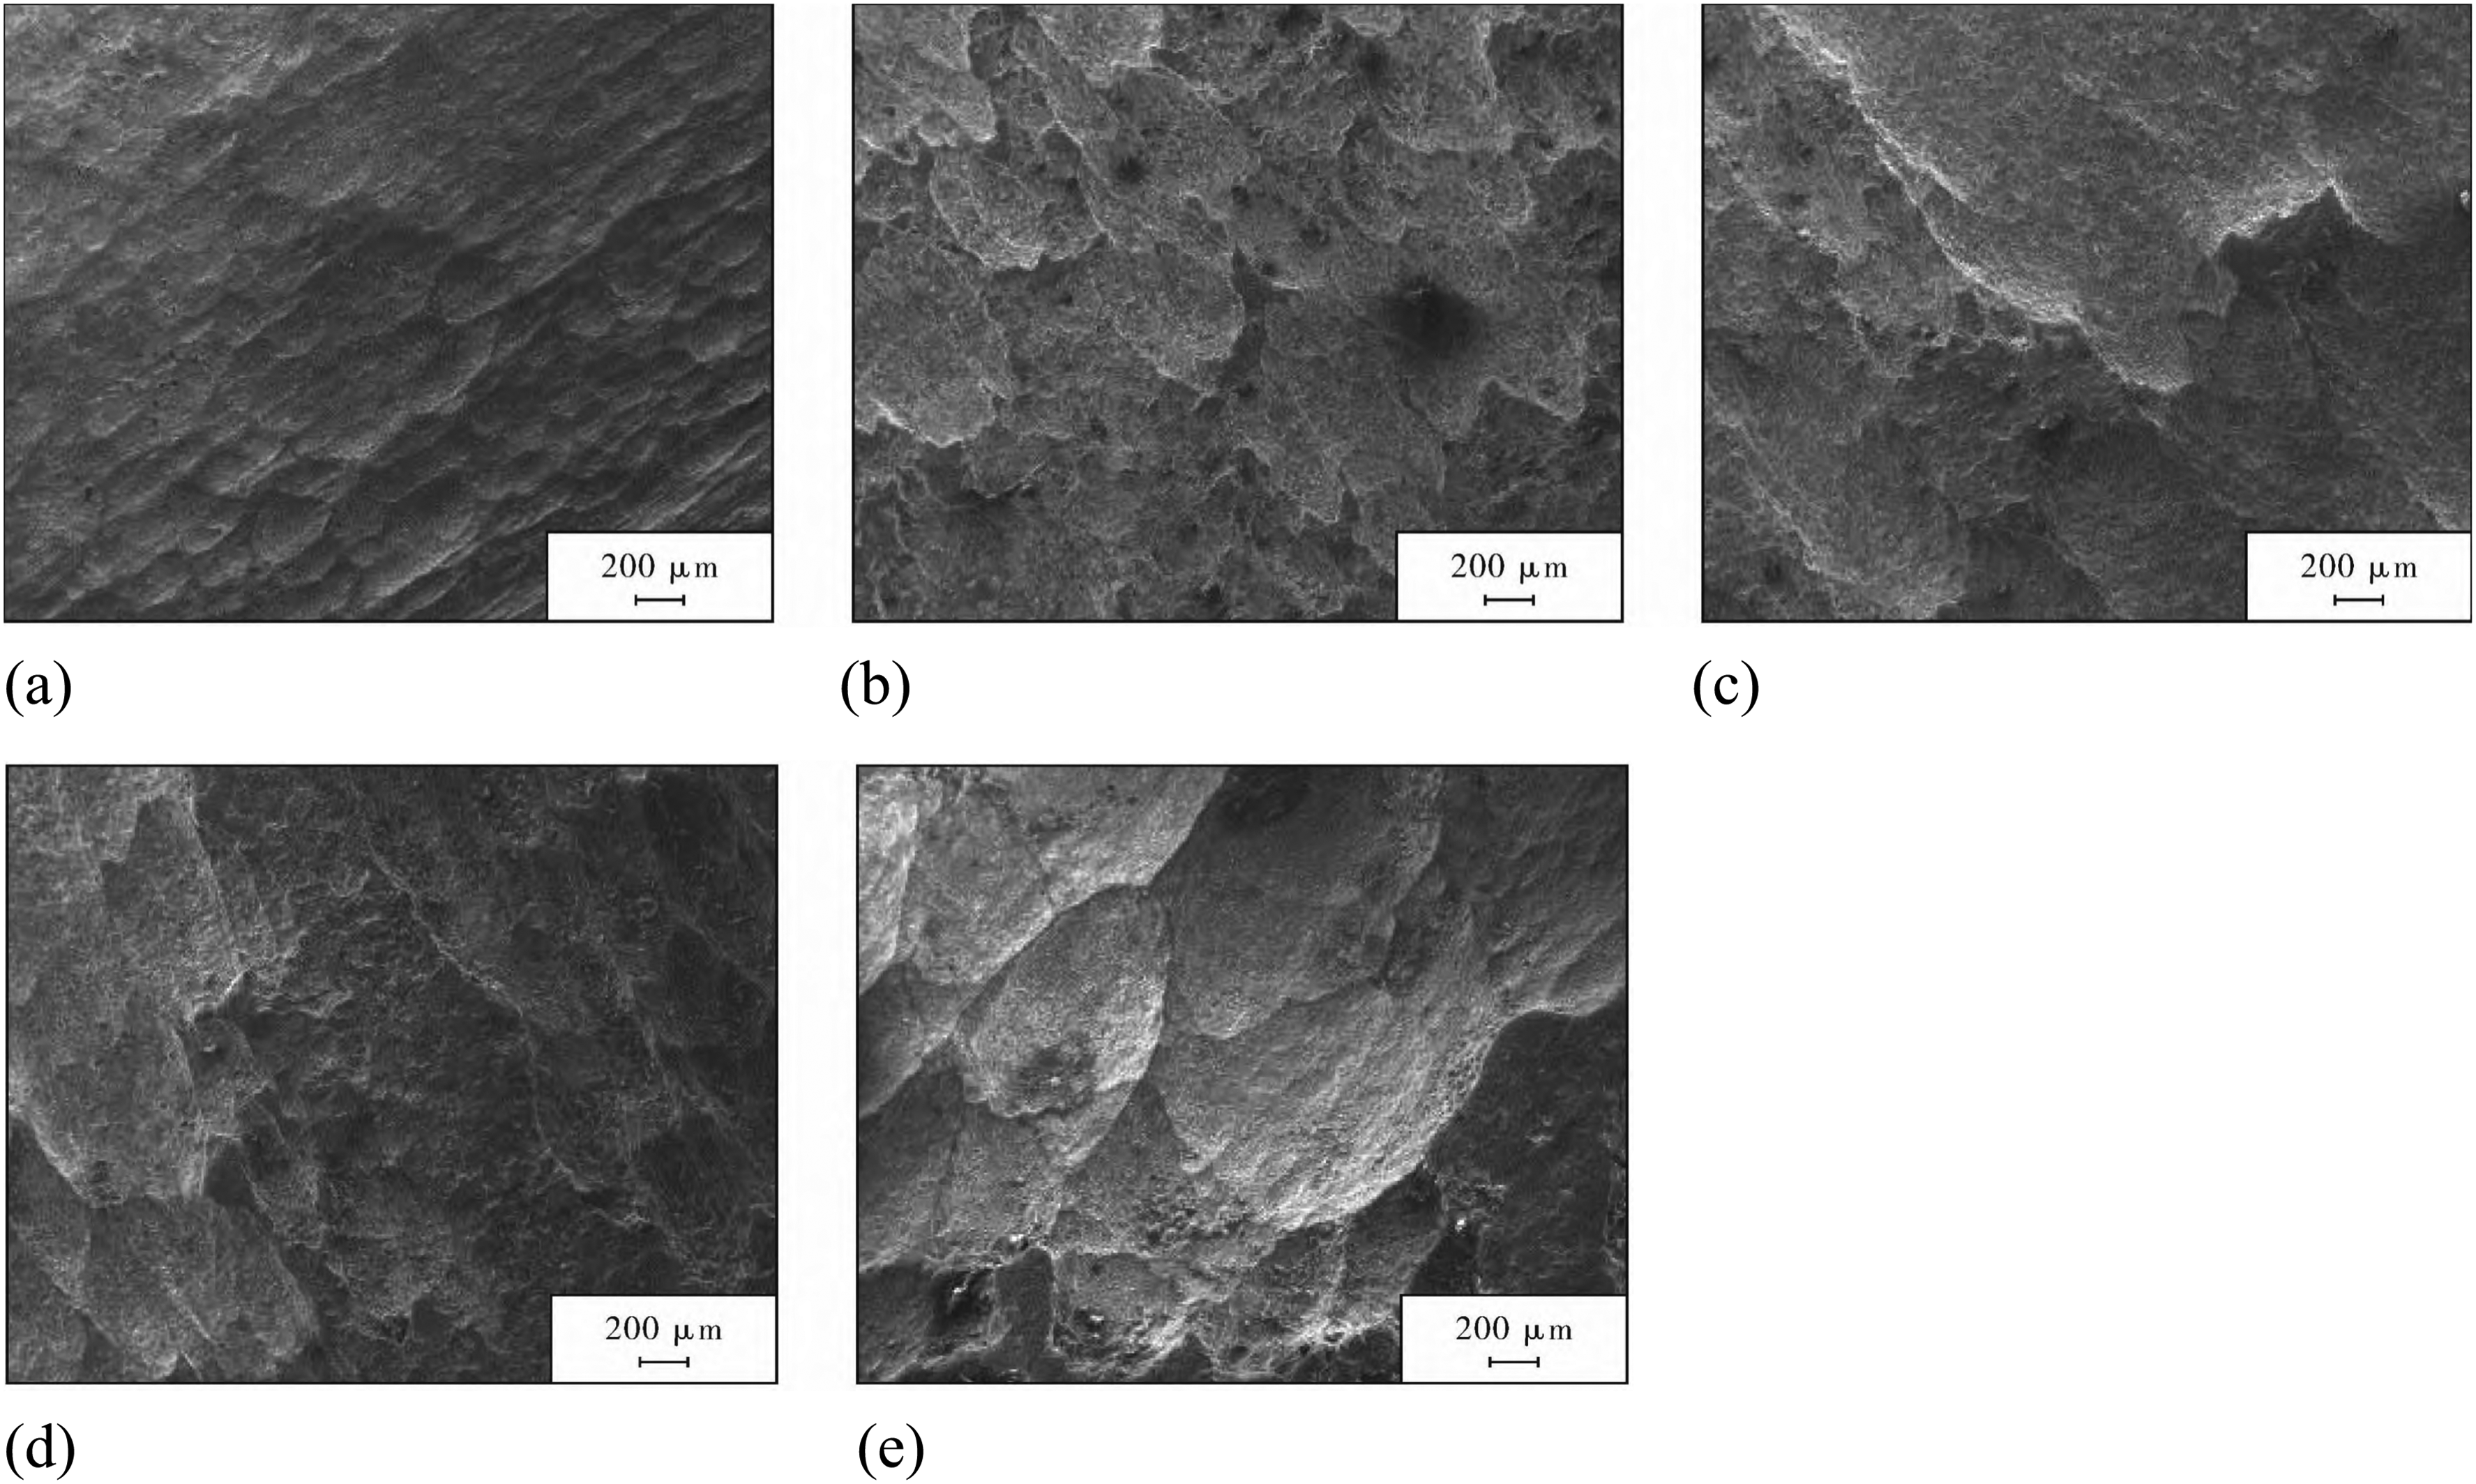
To analyse the microstructure and corrosion resistance of Q235 steel, Figure 6 illustrates the significant differences in the microscopic morphology of the tensile fracture area of the corroded steel plate. At a corrosion ratio of W = 5%, the surface of the tensile fracture displays numerous large and deep dimples, indicating good plasticity of the sample. However, at a corrosion ratio of W = 15%, the dimples appear smaller and shallower, suggesting a decrease in plasticity. Nonetheless, the sample retains acceptable plasticity at this stage. When W = 20%, the fracture micromorphology shows not only many small dimples but also distinct cleavage planes, indicating a predominance of brittle fracture in the sample. Finally, at W = 25%, the dimples disappear entirely, leaving only step-shaped cleavage planes that increase in number, confirming a transition to brittle fracture.
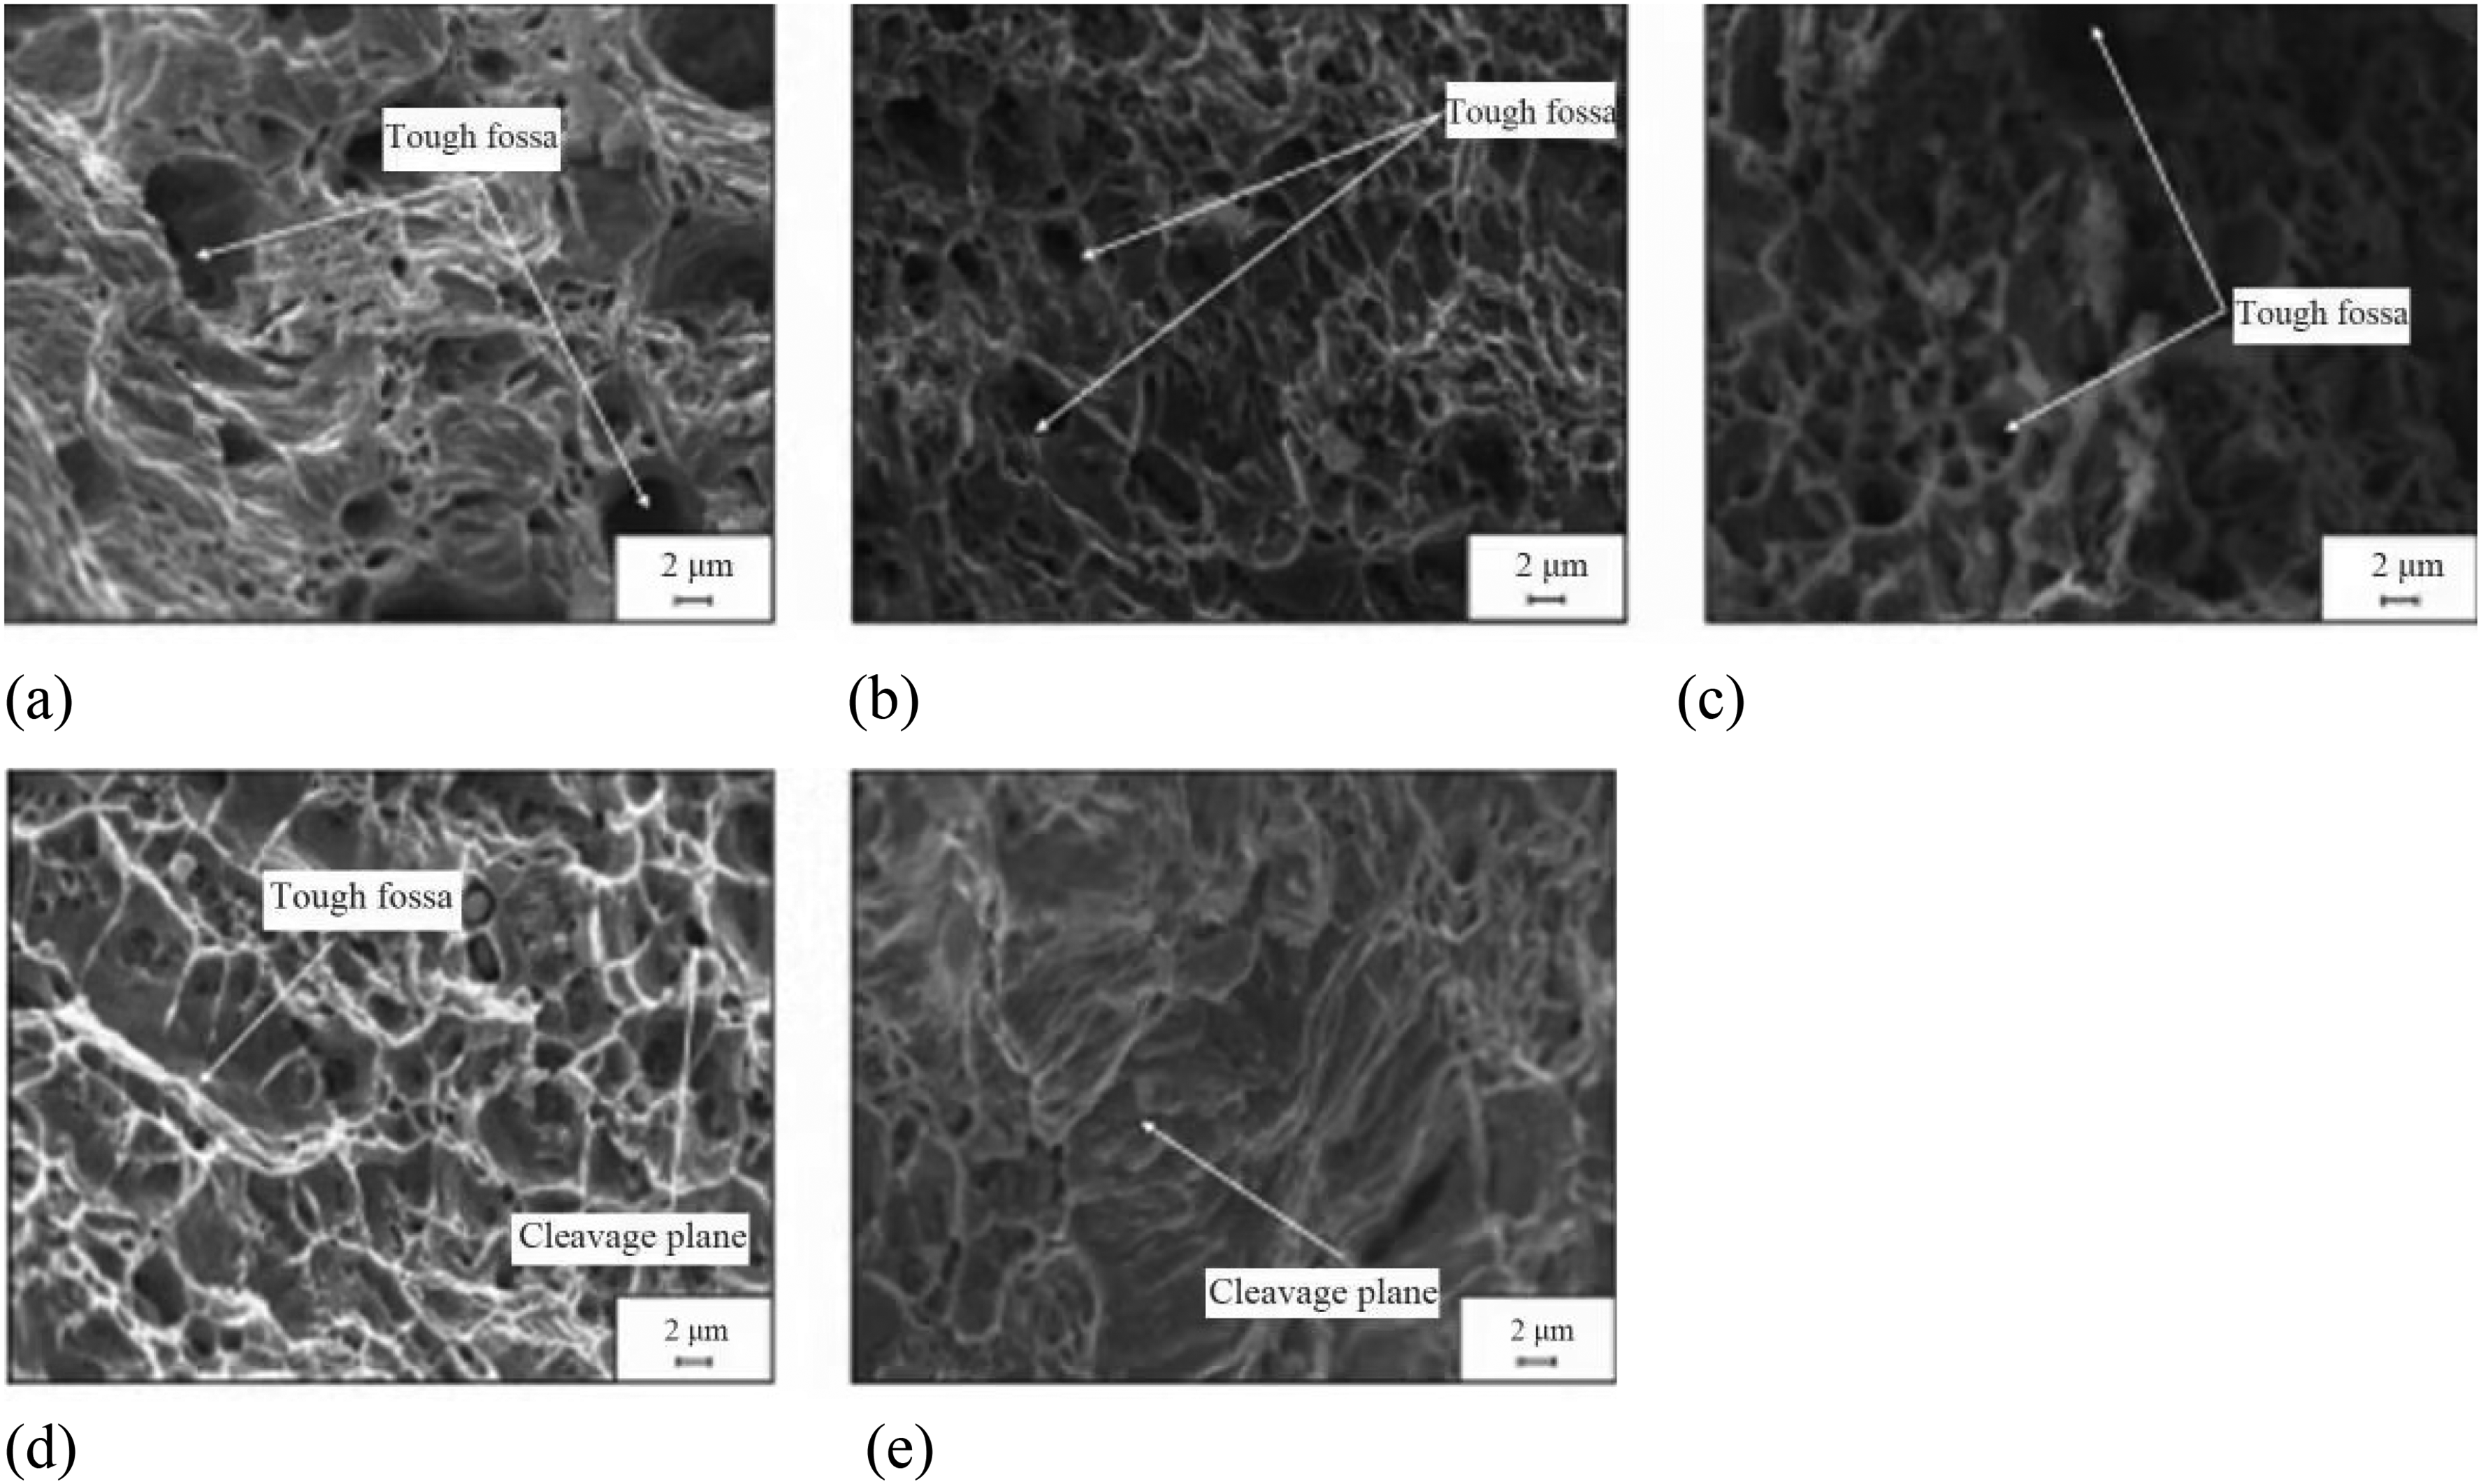
Comparison of tensile fracture morphology of specimens exhibiting different corrosion ratios: (a) W = 5%, (b) W = 10%, (c) W = 15%, (d) W = 20%, and (e) W = 25%.
Figure 7(a) is the three-dimensional morphology of a random field of view of acid rain corrosion. There are large pits on the surface; the maximum pit depth is 10.0 μm. As the degree of acid rain corrosion deepens (W = 10%), the rough surface area increases, the corrosion pits deepen and widen, as shown in Figure 7(b), the pit depth is 29.6 μm. In Figure 7(c), it can be seen that the deepest point is 42.2 μm, and the surface is completely corroded. Figure 7(d) shows the three-dimensional morphology of the surface of the acid rain corrosion sample. The surface is very rough and mainly pitting. The pit shape in the middle part is obviously larger in size, and the depth of the corrosion pit deepens. In Figure 7(e), it can be seen that the pit shape is obviously that the maximum depth is 81 μm and there is basically no plane. This shows that the corrosion of Q235 steel in the acid rain corrosion environment is not uniform but will form many pits.
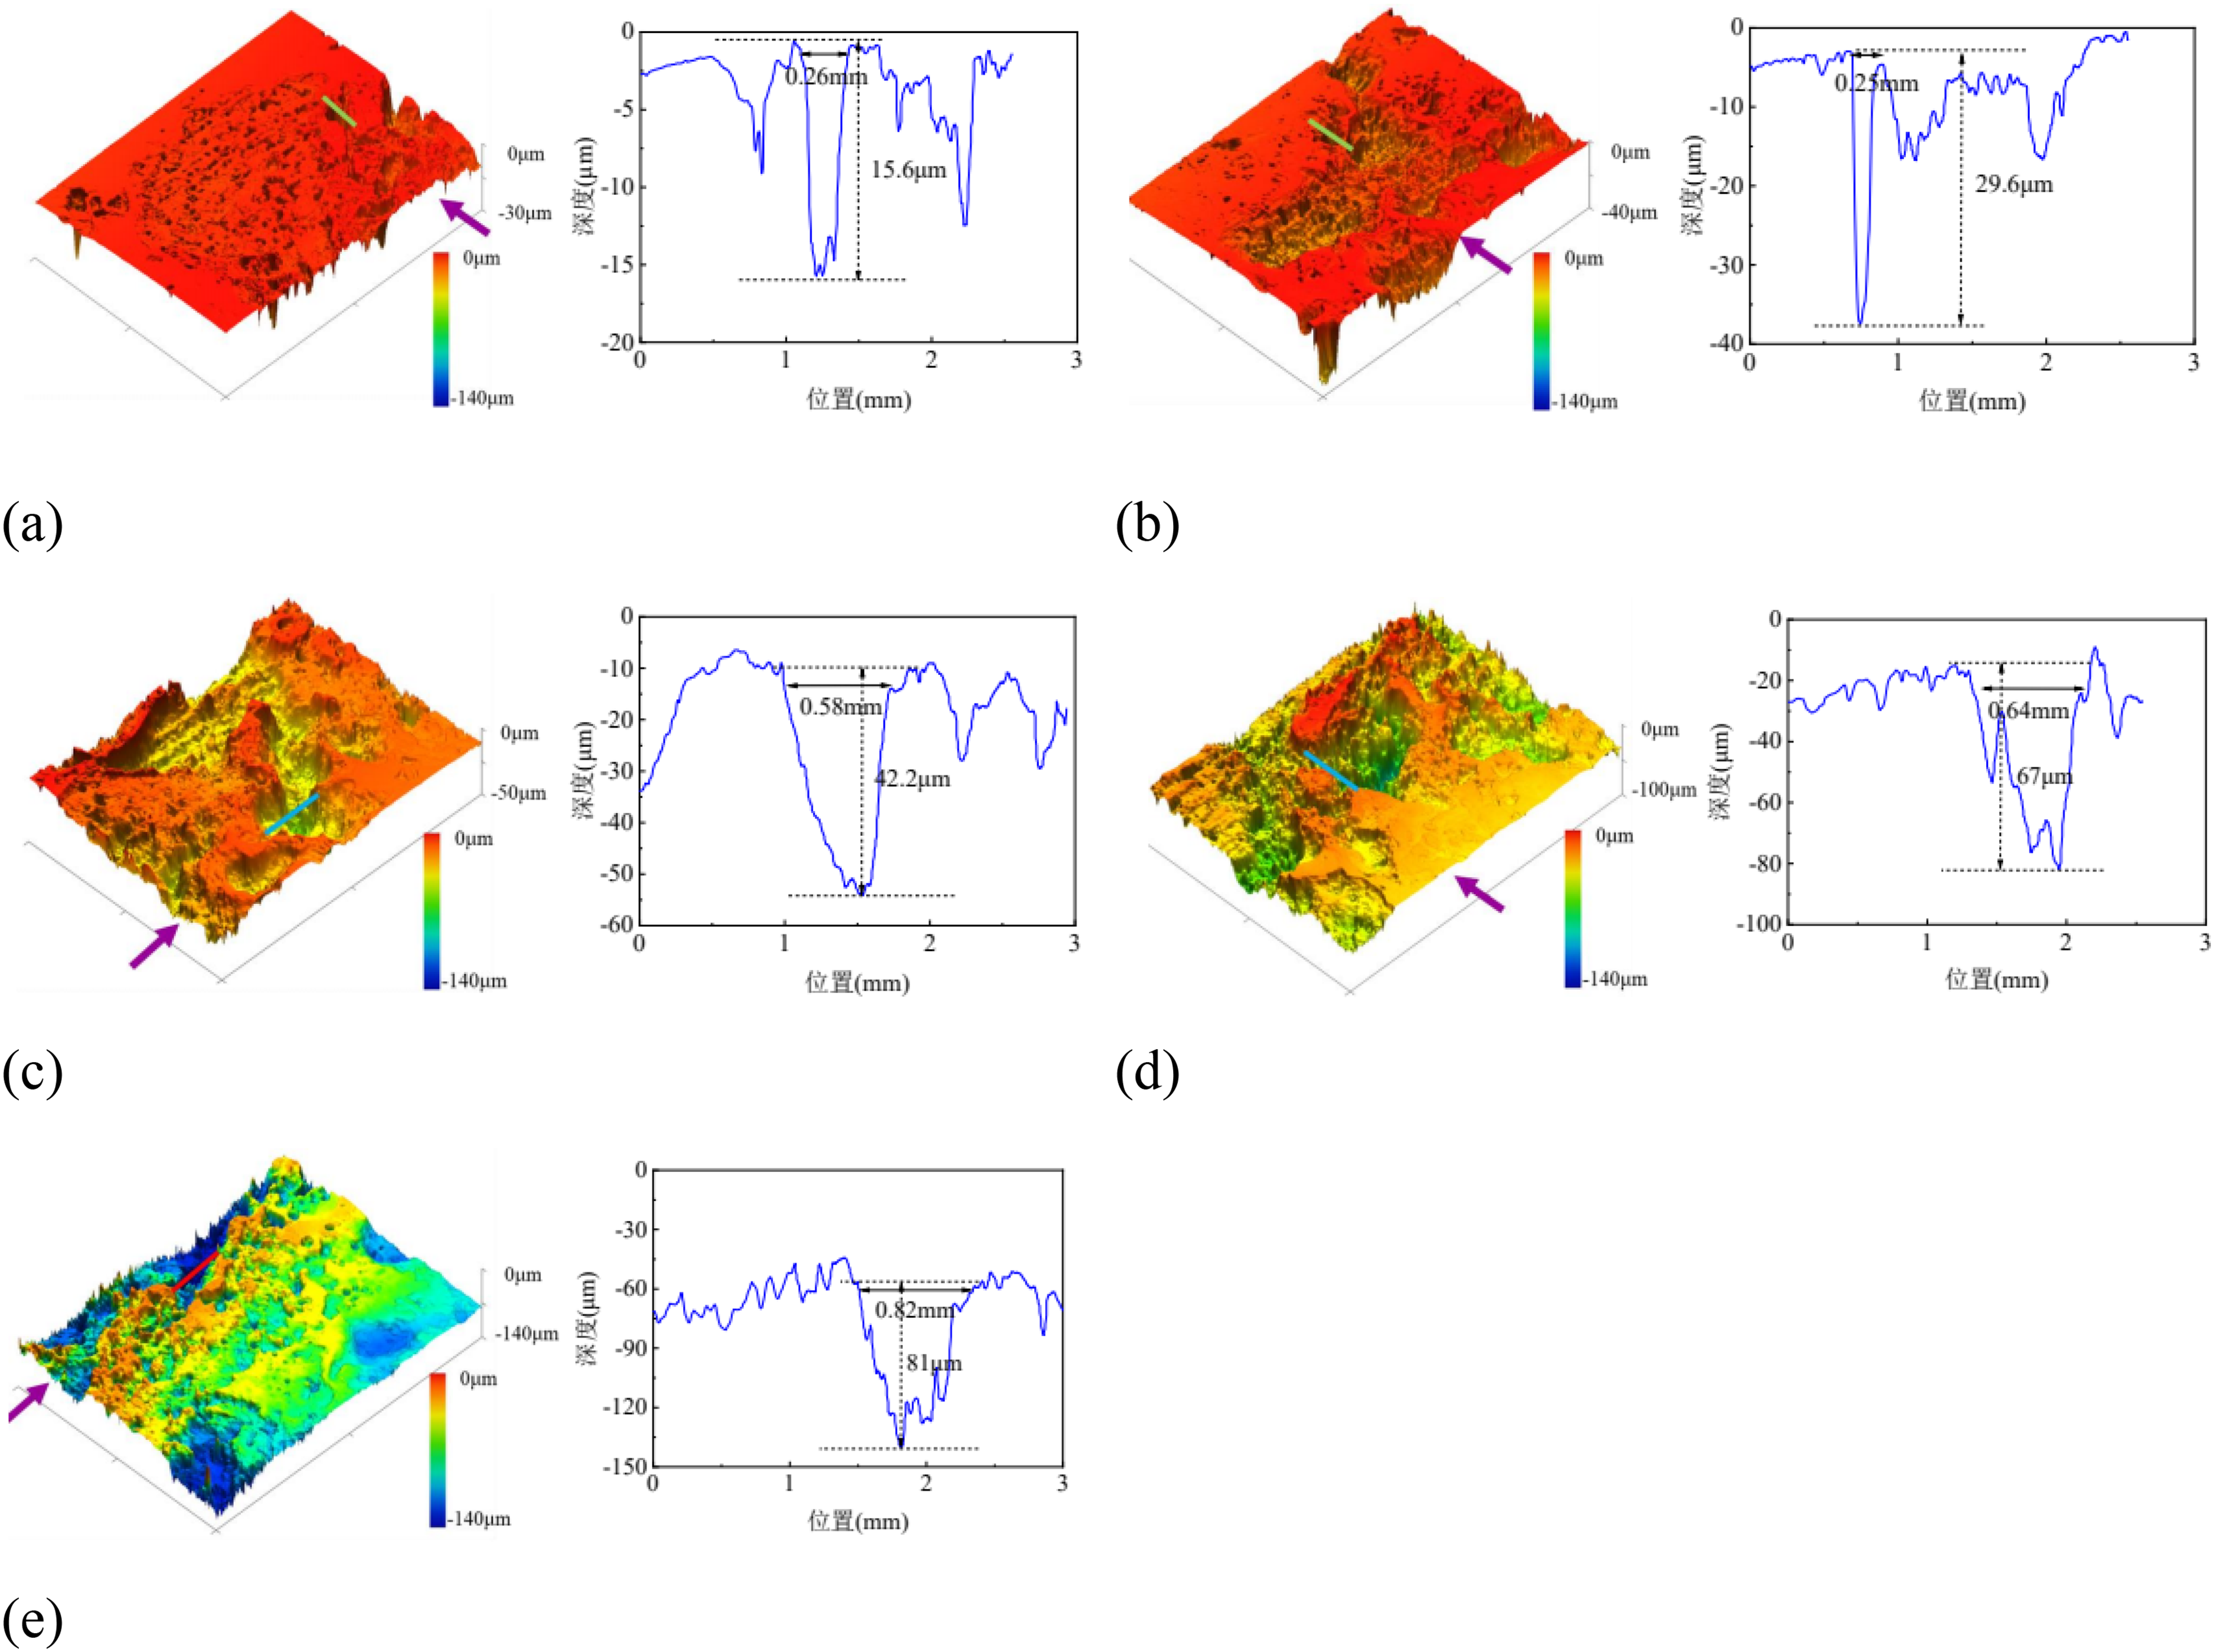
Morphologies of Q235 steel after corrosion with different corrosion ratio: (a) W = 5%, (b) W = 10%, (c) W = 15%, (d) W = 20%, and (e) W = 25%.
X-ray diffraction analysis
The XRD test of the rust layer of Q235 steel is shown in Figure 8. The main components of the rust layer of Q235 steel are Fe3O4, α-FeOOH, β-FeOOH, and γ-FeOOH. α-FeOOH is a stable corrosion product of Q235 steel and an important component of the rust layer to resist acid rain erosion. Fe3O4 has good thermodynamic stability and has a certain degree of protection for steel, while β-FeOOH and γ-FeOOH have weak stability and have no obvious contribution to the steel matrix in resisting erosion and corrosion. During the acid rain corrosion process, γ-FeOOH will transform into α-FeOOH and Fe3O4, and γ-FeOOH will also transform into β-FeOOH.13–14 The XRD test results of the rust layer of Q235 steel show that the diffraction peaks of α-FeOOH and Fe3O4 are high only in the early stage of corrosion. At the following corrosion levels, the phases corresponding to the highest diffraction peaks are β-FeOOH and γ-FeOOH. This means that as the corrosion intensifies, the Q235 rust layer is not corrosion-resistant and cannot slow down the corrosion rate. Q235 steel contains a certain amount of α-FeOOH and Fe3O4 at the same time, which may be due to the influence of trace elements in weathering steel on the transformation of γ-FeOOH during the corrosion process.
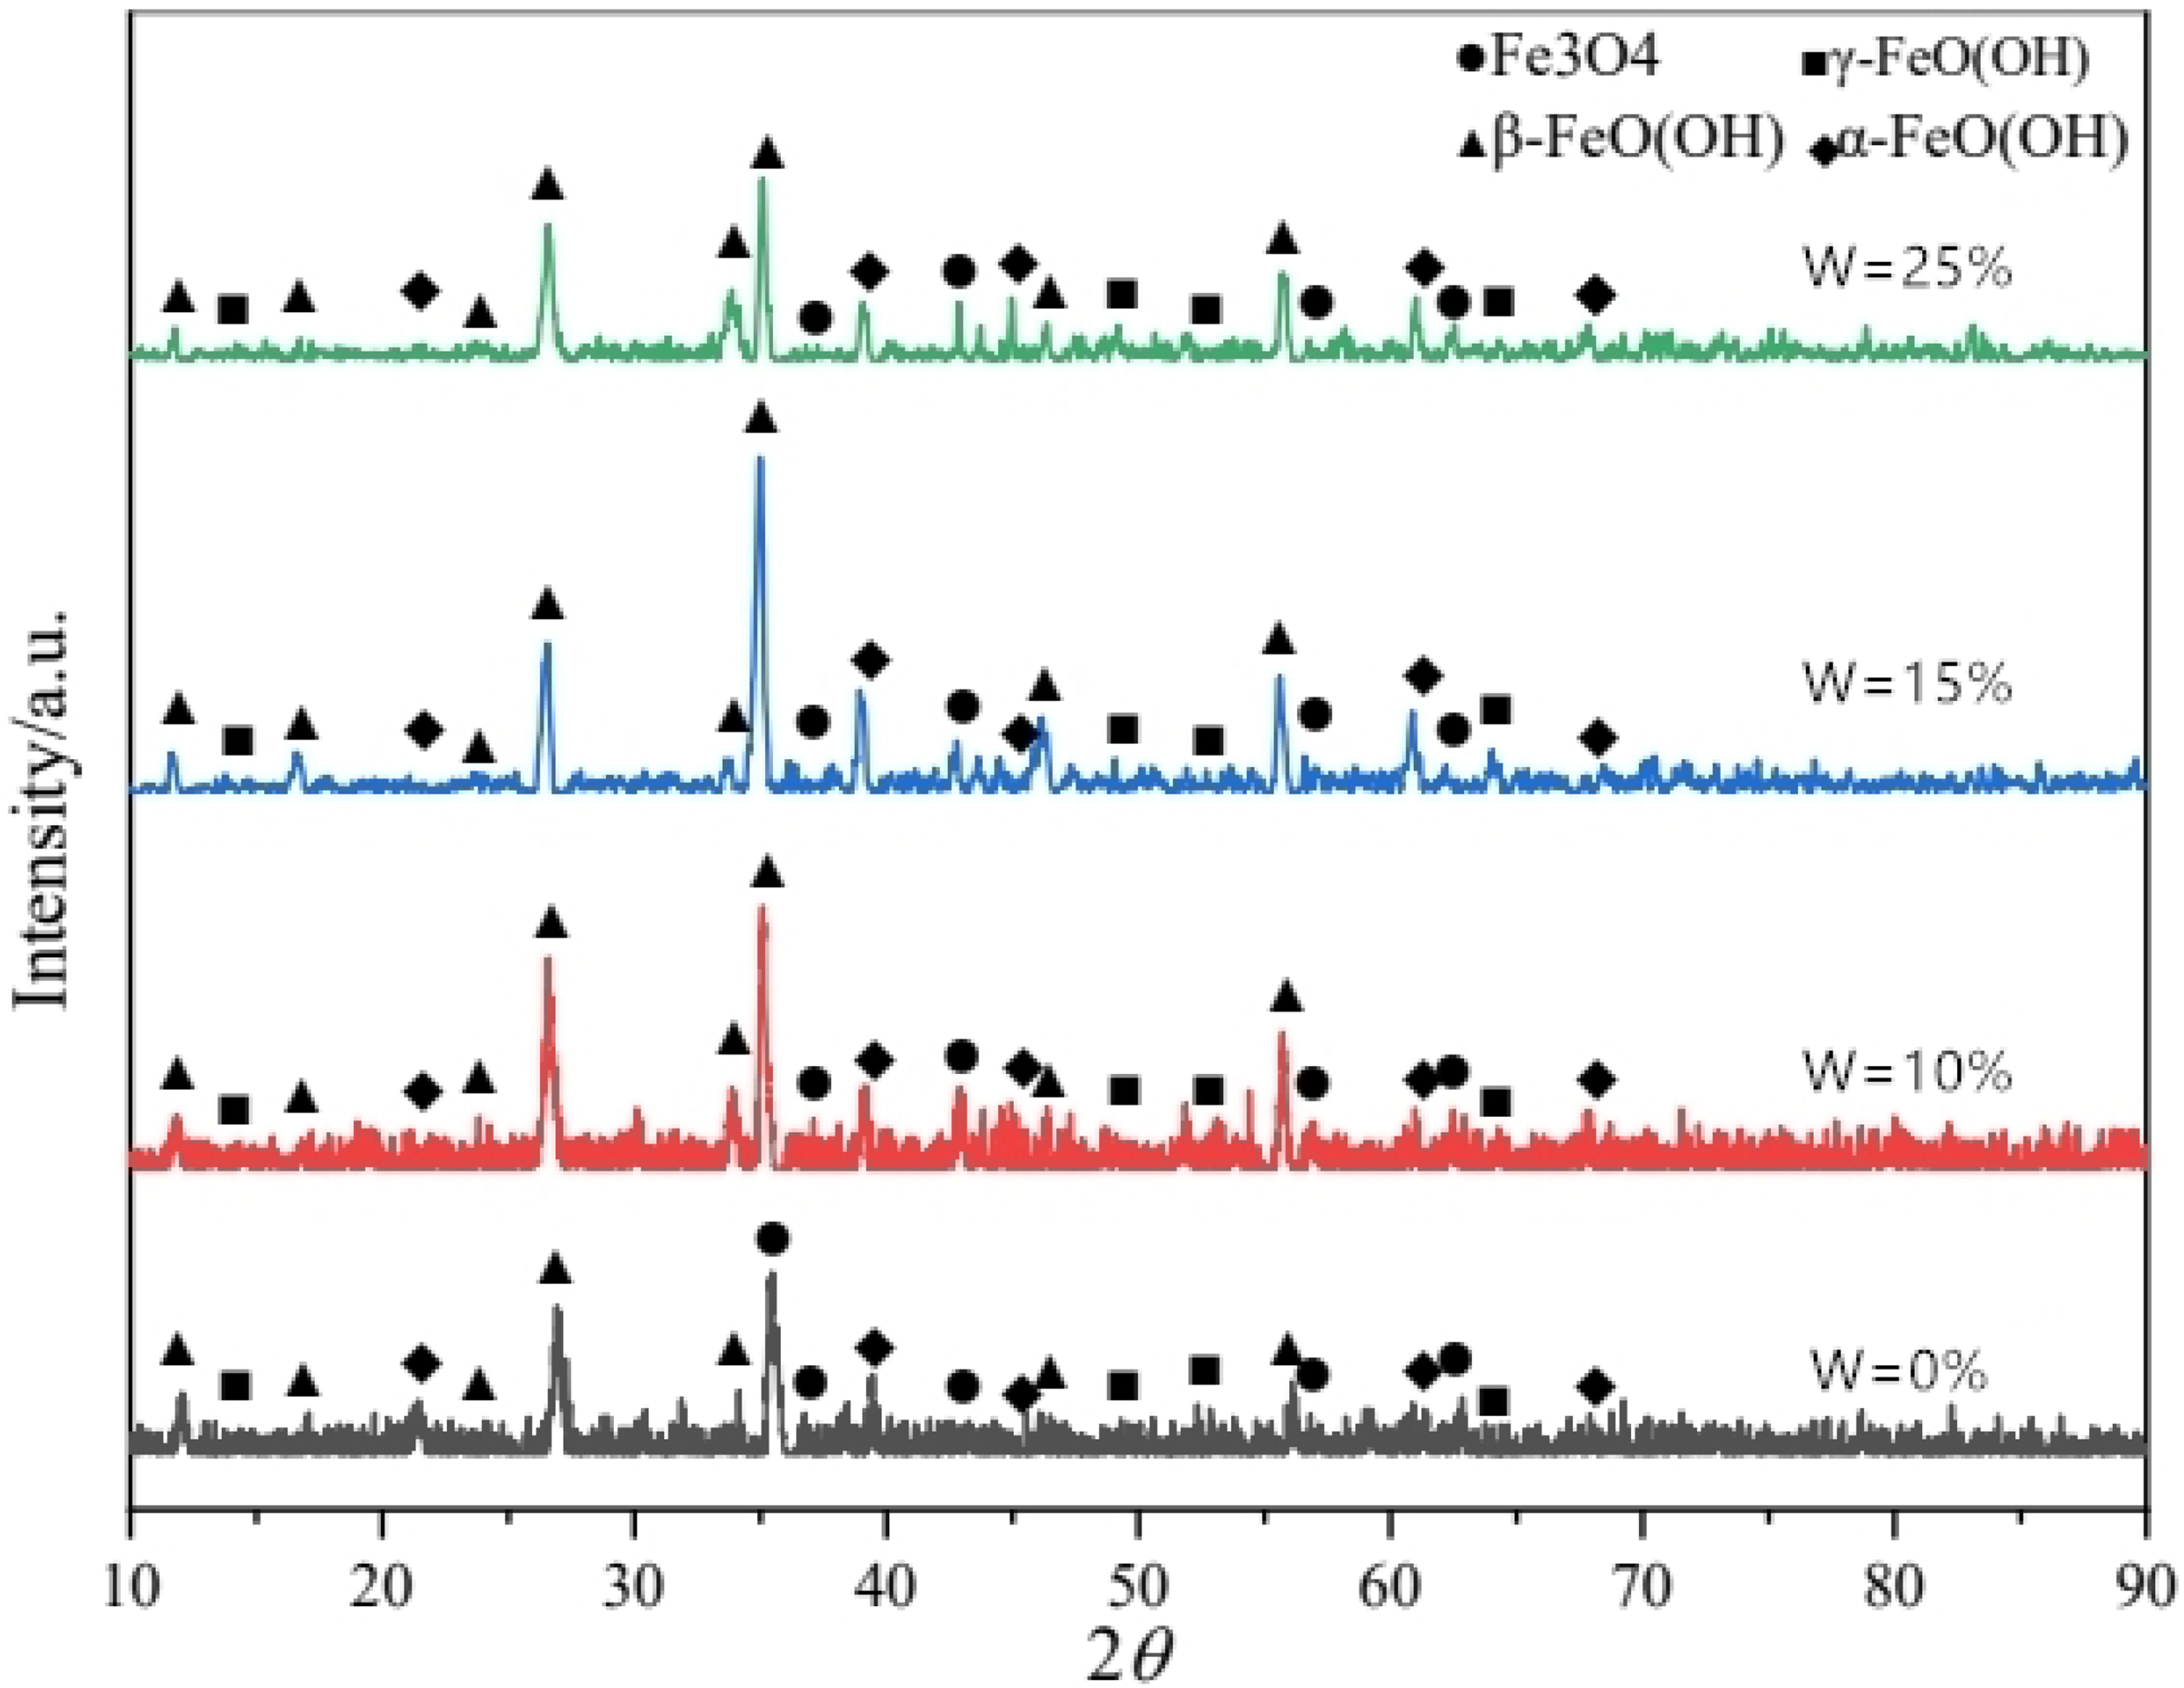
XRD analysis of corrosion products of Q235 steel under the attack of acid rain. XRD: X-ray diffraction.
Energy-dispersive spectroscopy analysis of corrosion products
It can be seen from Figure 9(c) that the O element is obviously enriched, indicating that the corrosion of O2 is at work when the corrosion rate W = 5%. It can be seen from Figure 9(d) that the N element is unevenly distributed and concentrated in several highlighted areas. It can be inferred that the corrosion effect of NO3− ions on Q235 steel is not obvious. It can be seen from Figure 10(e) that the S element is mostly distributed in various positions in the field of view in a dotted manner, indicating that the S element in acid rain is also an important medium causing corrosion. It can be seen from Figure 9(f) that the Mo element is also distributed in various positions in the field of view in a dotted manner.
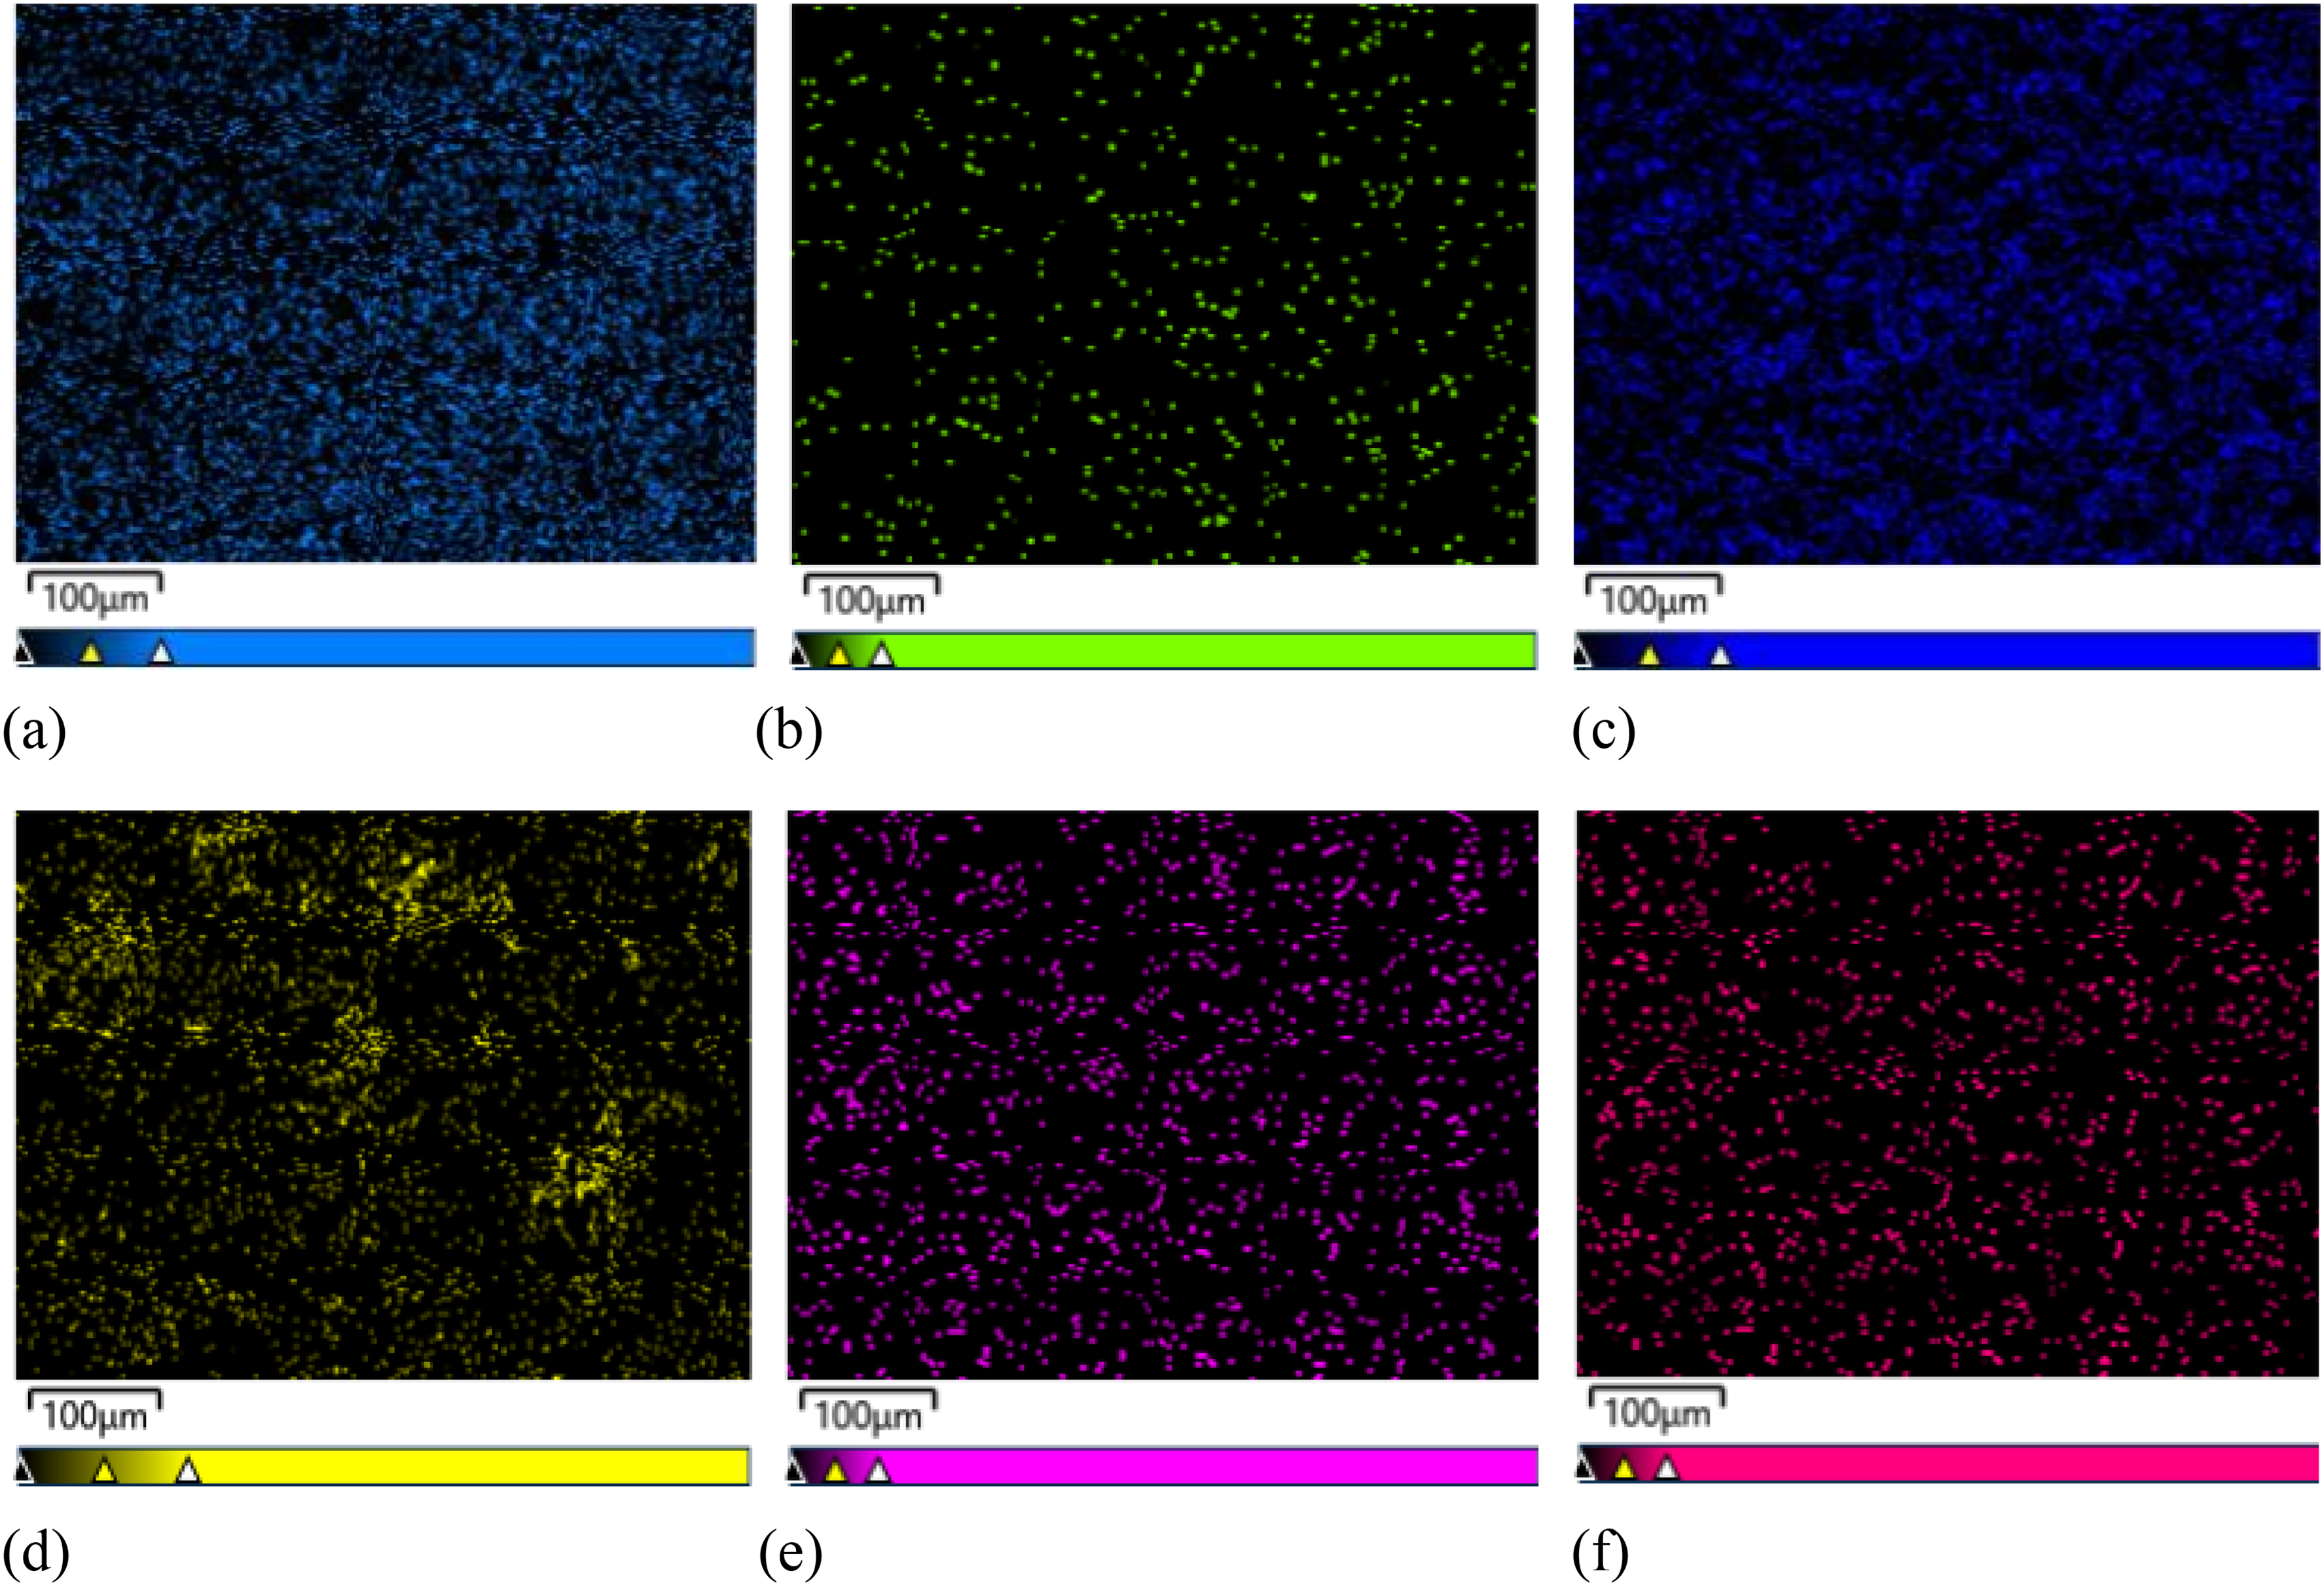
Image of Q235 steel after corrosion for W = 5%: (a) EDS for Fe, (b) EDS for Cr, (c) EDS for O, (d) EDS for N, (e) EDS for S, and (f) EDS for Mo. EDS: energy-dispersive spectroscopy.
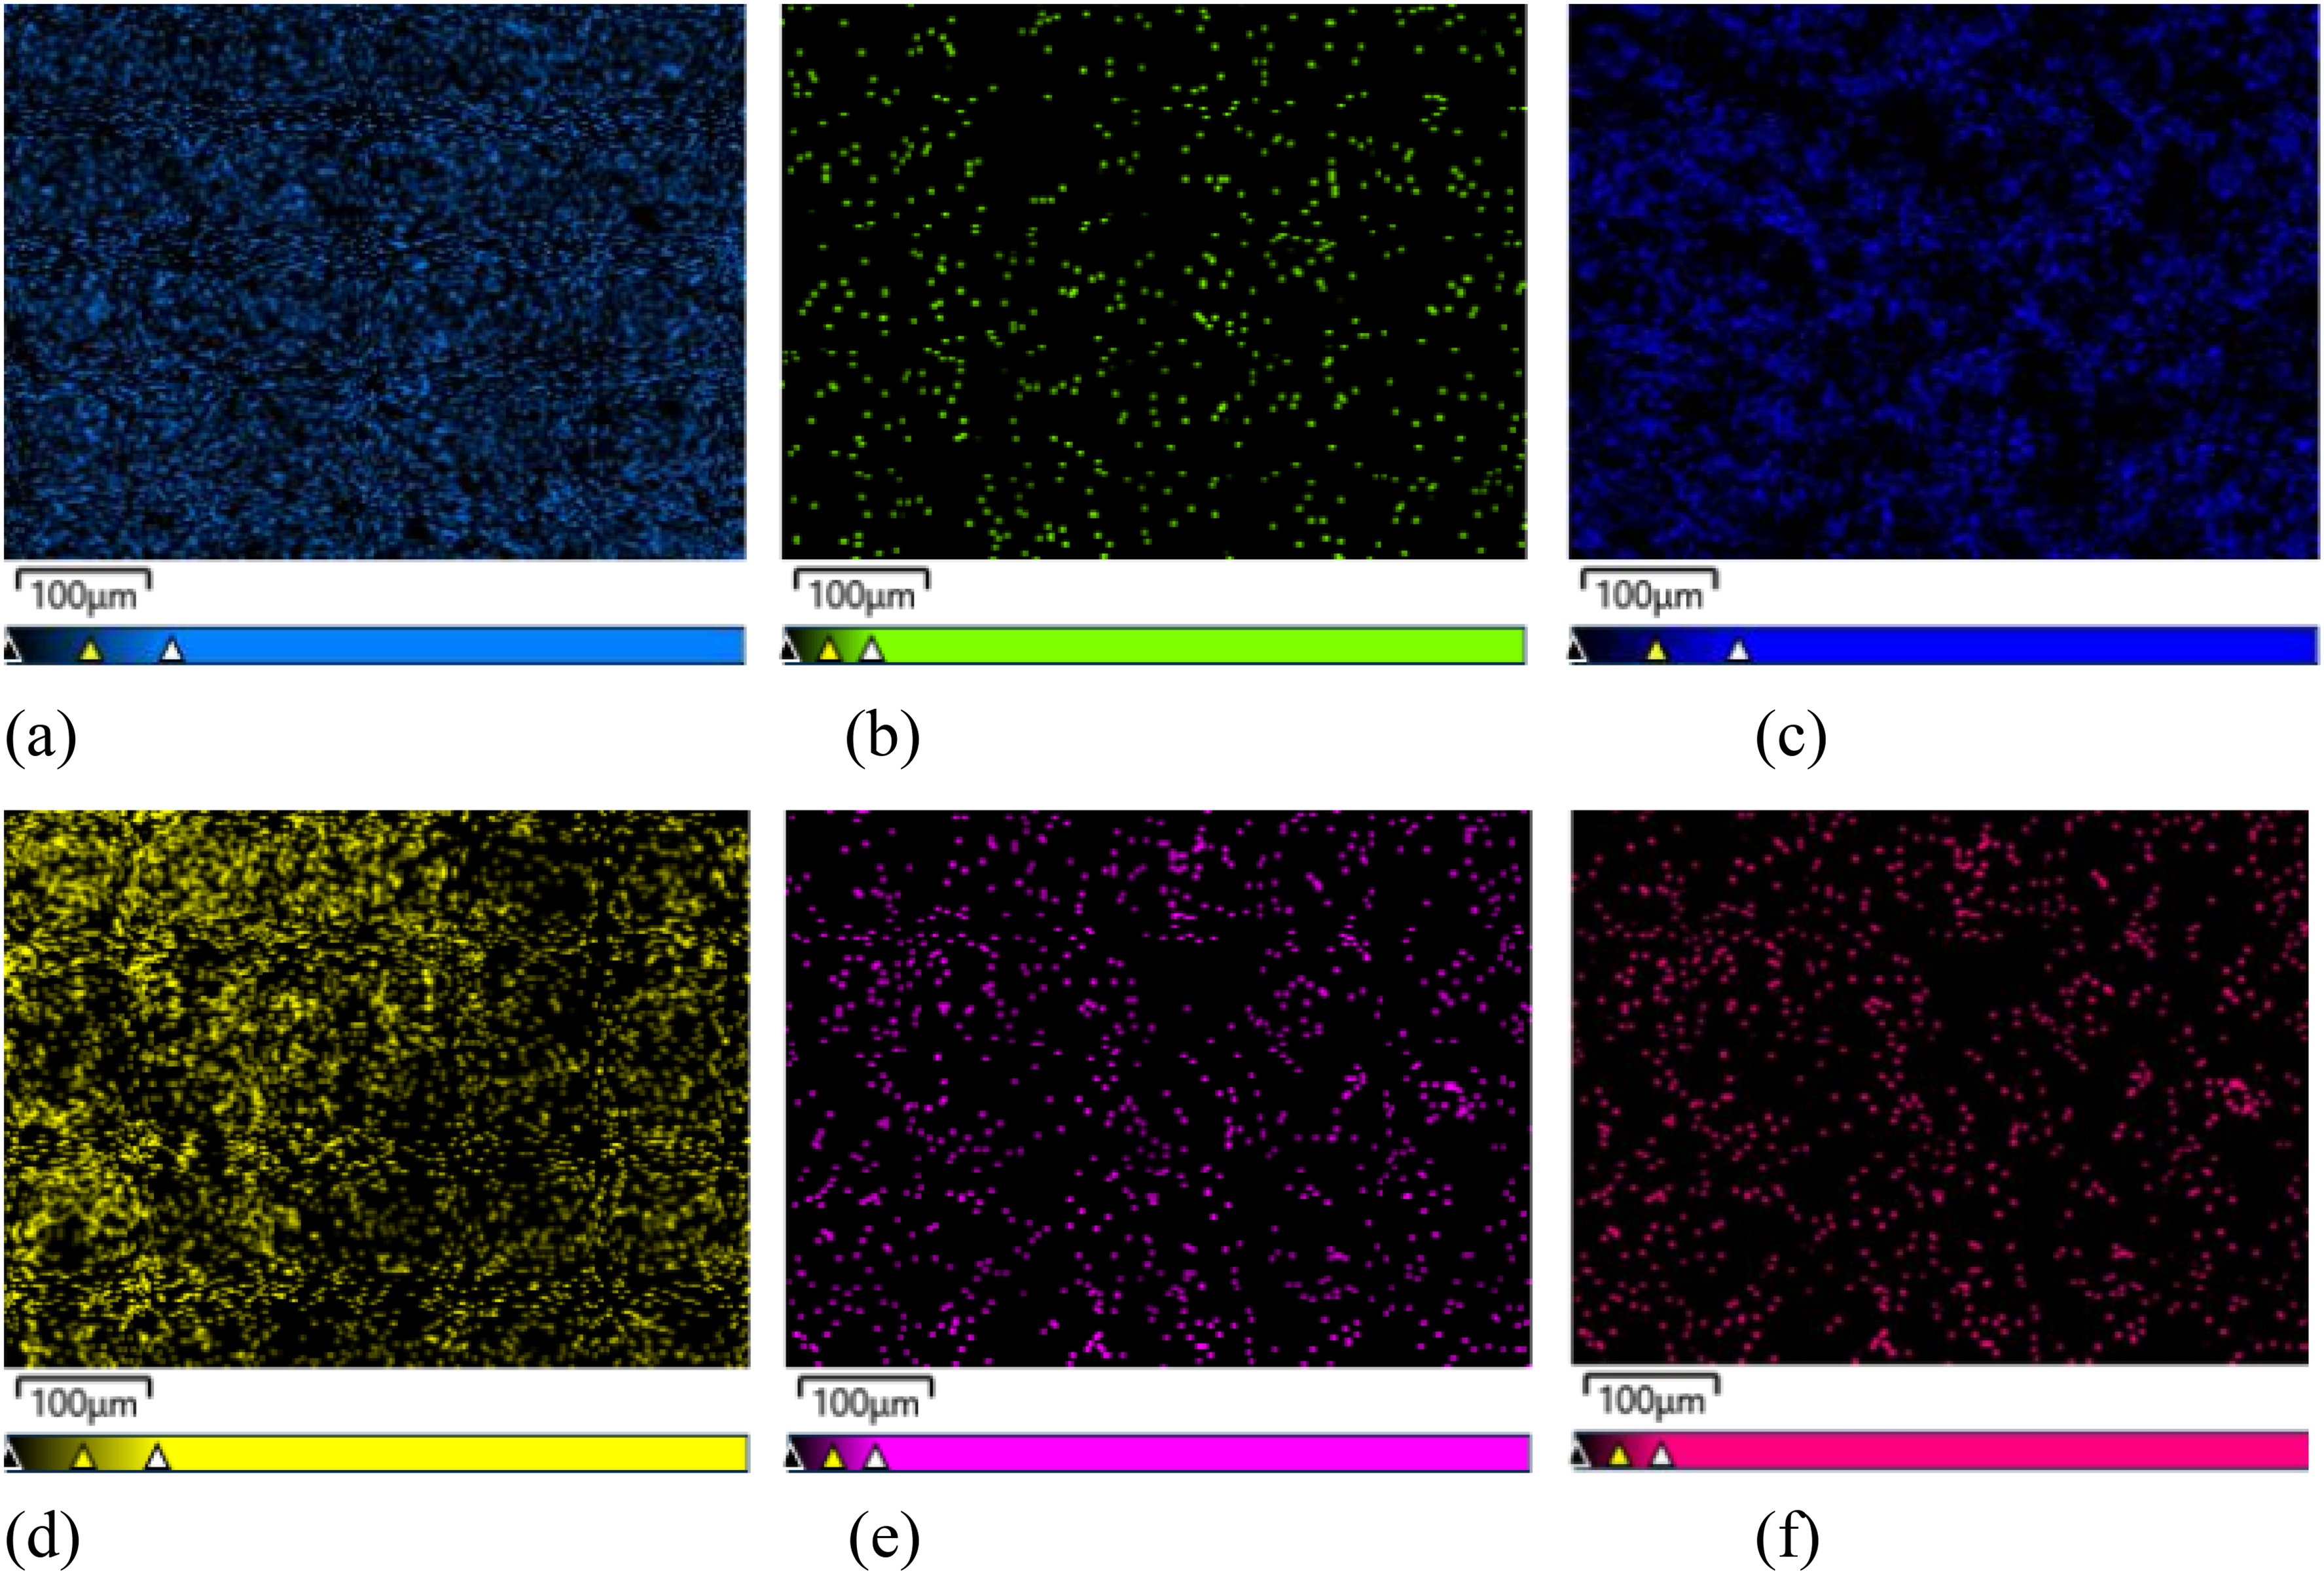
Image of Q235 steel after corrosion for W = 15%: (a) EDS for Fe, (b) EDS for Cr, (c) EDS for O, (d) EDS for N, (e) EDS for S, and (f) EDS for Mo. EDS: energy-dispersive spectroscopy.
Figure 10(c) shows that the O element is significantly enriched, indicating that the corrosion of O2 is still severe when W = 15%. Figure 10(d) shows that the N element is present in the entire area. Compared with Figure 10(d), when the corrosion rate W = 5%, the N element content increases. It can be inferred that the corrosion effect of NO3− ions on Q235 steel is more obvious, and the products are mainly β-FeOOH. The S element in acid rain will also continue to cause a certain degree of corrosion (Figure 10(e)).
It can be seen in Figure 11(b) that although the Cr content is small, it also appears in the corrosion product in a uniform point shape, which is similar to the results of the samples with corrosion rates of W = 5% and W = 15%. In Figure 11(c), it can be seen that the enrichment of O element is obvious, and the distribution state of O element in the three groups of specimens (W = 5%, W = 15%, W = 25%) is not much different. In Figure 11(d), it can be seen that the distribution of N element in the entire area is not significantly increased compared with the samples with W = 5% and W = 15%. In the W = 25% specimen, O2 and NO3− ions are still the main corrosion of the specimen, but the corrosion effect of NO3− ions on Q235 steel is lower than that of the W = 15% specimen. This may be because the corrosion product in the later stage is β-FeOOH. During the entire immersion stage, O2 is still the dominant factor of corrosion. In the early stage of acid rain corrosion, the S element has a significant effect, and the corrosion effect of NO3− ions is more obvious in the later stage.
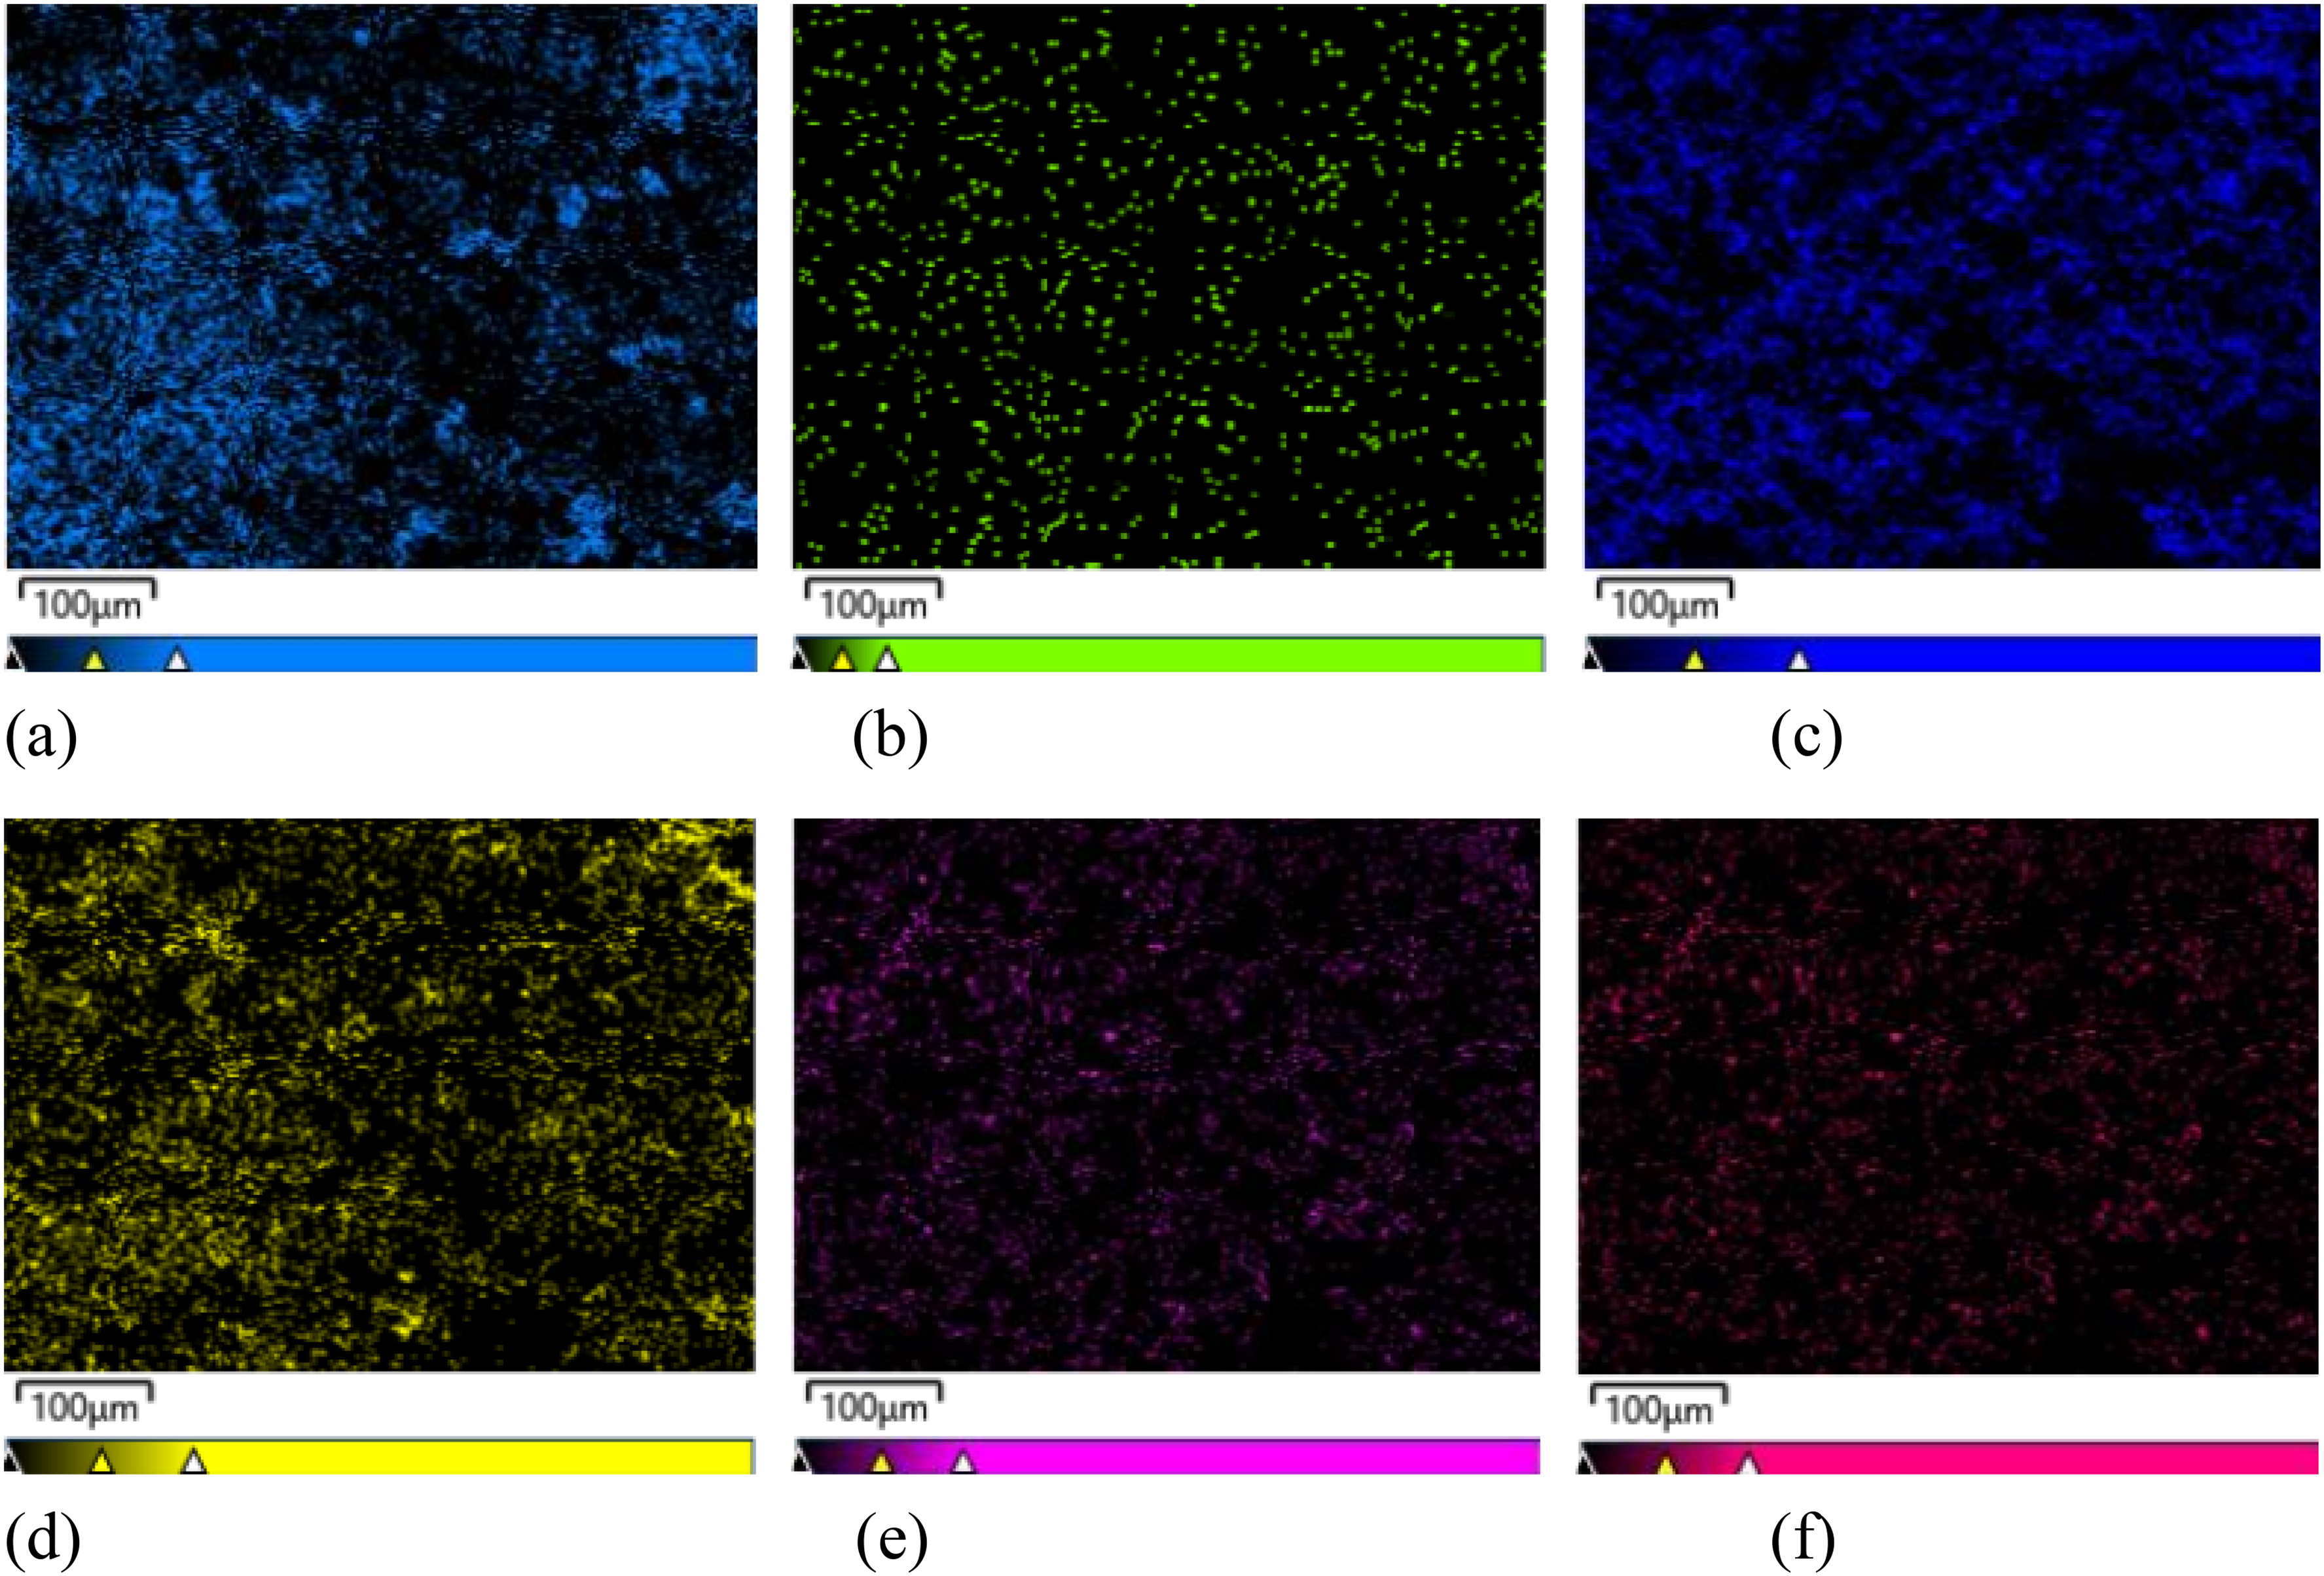
Image of Q235 steel after corrosion for W = 25%: (a) EDS for Fe, (b) EDS for Cr, (c) EDS for O, (d) EDS for N, (e) EDS for S, and (f) EDS for Mo. EDS: energy-dispersive spectroscopy.
Proposed equations
Equation proposed in this study
Figure 12 shows the correlation between corrosion rate and several mechanical properties of steel, including yield strength, elastic modulus, ultimate strength, Poisson's ratio, and elongation. The data indicates a clear downward trend in yield strength, elastic modulus, ultimate strength, and elongation as the corrosion rate increases. This decline can be attributed to the formation of pits of varying sizes on the steel surface due to acid rain corrosion. These pits create discontinuities in the steel, leading to abrupt changes in cross-sectional area which may cause stress concentrations and uneven stress distribution across the cross-section.
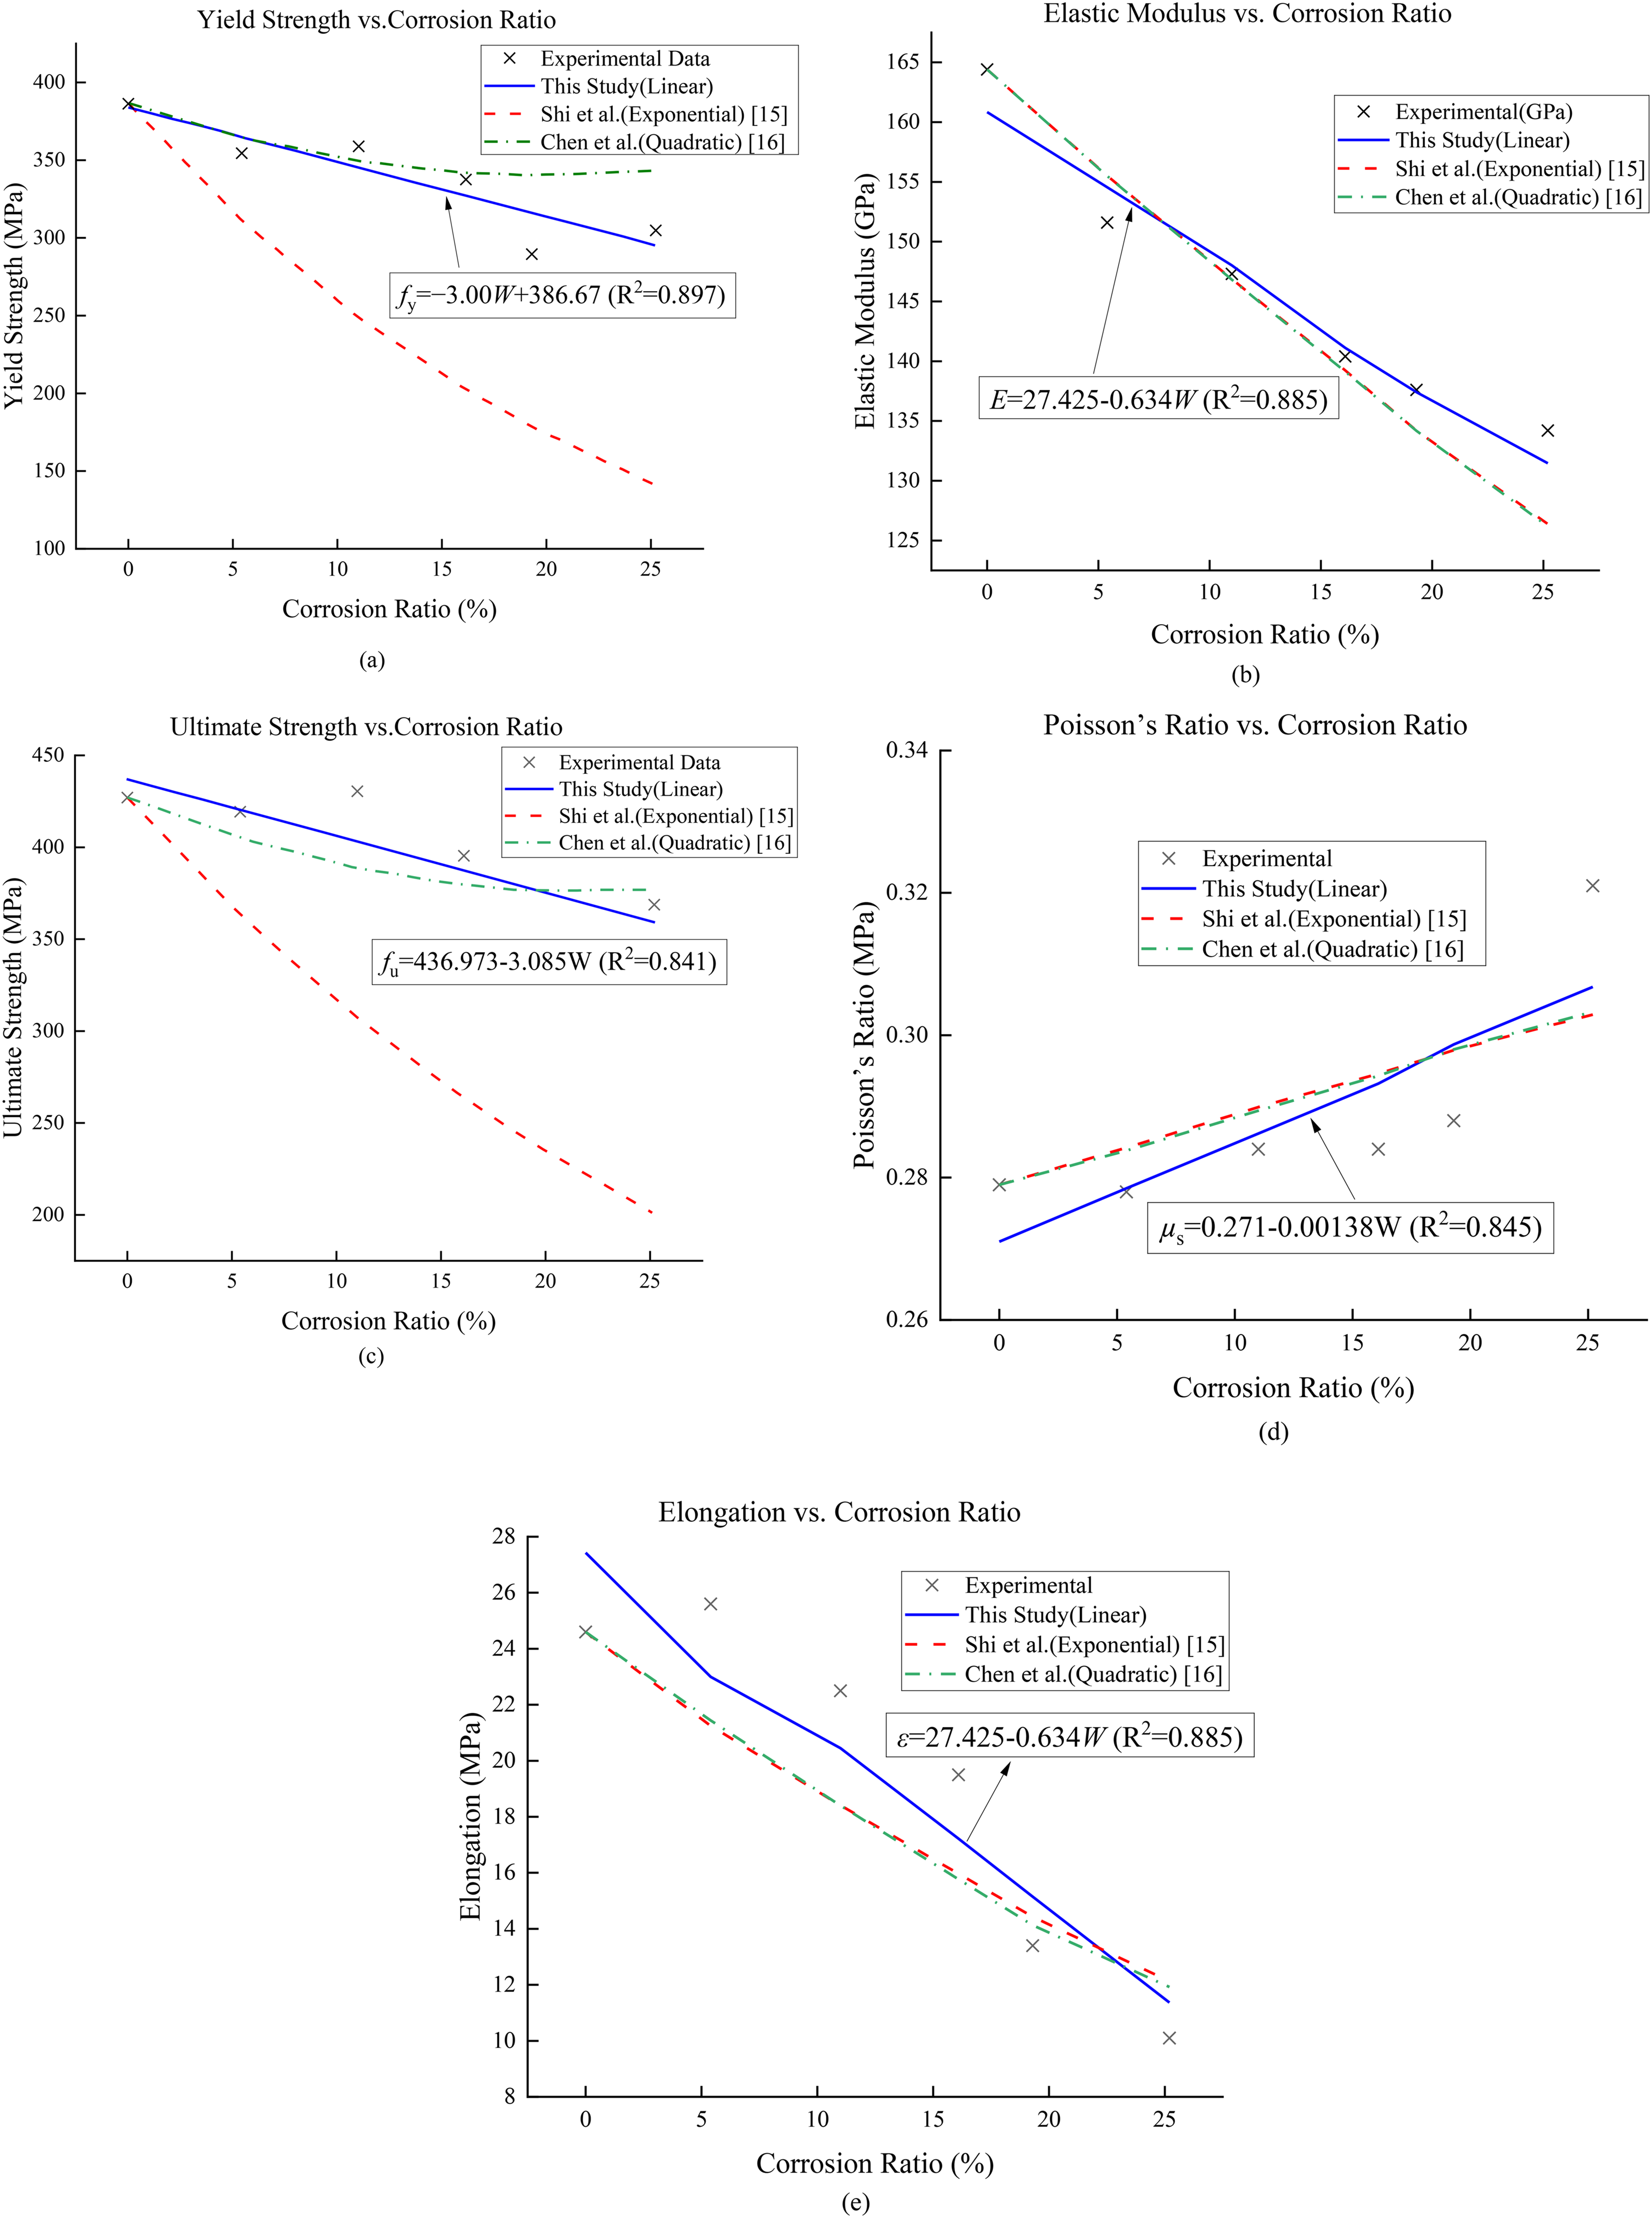
The relationship between the mechanical properties of corroded Q235 steel and corrosion ratio: (a) yield strength (fy) versus W; (b) elastic modulus (Es) versus W; (c) ultimate strength (fu) versus W; (d) Poisson's ratio (μs) versus W; (e) elongation (ε) versus W.
Pit corrosion can also facilitate the development of microcracks around the pits, causing the steel to transition from a ductile state to a brittle one. As axial load increases, these microcracks can worsen, ultimately degrading the mechanical properties of the steel. 7 In contrast, Poisson's ratio tends to increase with rising corrosion rates. This increase may result from pit corrosion, which leads to a decrease in both transverse strain and axial strain in the specimen. However, the decrease in axial strain is typically greater than that in transverse strain.
It emerges from comprehensive experimental data that this scholarly inquiry introduces an equation of linear fitting with the purpose of determining the reduction coefficient pertinent to Q235 steel's mechanical attributes in fire-resistant contexts. This formulation augments both the convenience and accuracy within the domain of structural engineering, particularly when considering post-corrosion application scenarios involving said steel category. The quantitative relationships between yield strength (fy), elastic modulus (Es), ultimate strength (fu), elongation (ε), and Poisson's ratio (μs) of corroded steel in relation to the corrosion ratio (W) are detailed in Equations (7)–(11). The R2 values for these equations consistently exceed 0.80, which ensures a reliable evaluation of the residual properties of Q235 steel. These equations are specifically applicable to Q235 steel at room temperature.


Comparison with other models
A comparative analysis of degradation models (Figure 12) demonstrates that the linear model proposed in this study provides a strong fit to experimental data within the corrosion ratio range of 5%–25%, while maintaining superior simplicity compared to exponential and quadratic alternatives. Although all models exhibit similar predictive accuracy, the linear formulation offers a more straightforward approach with fewer fitting parameters, making it particularly advantageous for engineering applications requiring rapid and reliable estimations.
The empirical degradation equations developed herein show consistent linear behaviour with high coefficients of determination (R2 > 0.80) across all mechanical parameters, confirming strong correlations between corrosion level and property deterioration. For example, the linear model for ultimate tensile strength fu = 436.97–3.085 W achieves an R2 of 0.817, slightly outperforming the exponential model by Shi et al., 15 fu = 420e−0.02W, which yields an R2 of 0.79. Notably, our model uses 33% fewer parameters, enhancing both computational efficiency and interpretability for field engineers.
In contrast to the bilinear degradation trend reported by Chen et al. 16 under H₂SO4-only conditions (with a transition at W = 12%), the linear trend in this study remains valid across the full corrosion range investigated. This consistency is supported by SEM observations (Results from scanning electron microscopy analysis section), which confirm continuous pitting evolution under realistic NO3−/SO4²− dominated acid rain environments.
In summary, the linear model proposed in this study offers predictive accuracy comparable to, and in some cases exceeding, that of more complex nonlinear formulations, while retaining a simplified analytical structure. This simplicity enhances its practicality for engineering applications, allowing for direct integration into structural safety assessments and design calculations without compromising reliability. These findings highlight the robustness and applicability of linear assumptions in modelling the mechanical degradation of Q235 steel under acid rain exposure. The proposed model provides an efficient and reliable framework for corrosion-informed structural design and service-life prediction in acidic environments.
Model accuracy evaluation
Table 4 presents the comparison of experimental data versus predicted results from the current and reference models in terms of root mean square error for yield strength and ultimate tensile strength. To better evaluate the validity and applicability of the proposed empirical degradation models for corroded Q235 steel, a comparative analysis is conducted against several representative degradation models from the literature. These models include linear, bilinear, and exponential formulations proposed under various corrosion conditions such as chloride attack, marine atmosphere, and acid rain.
Model accuracy evaluation with different.
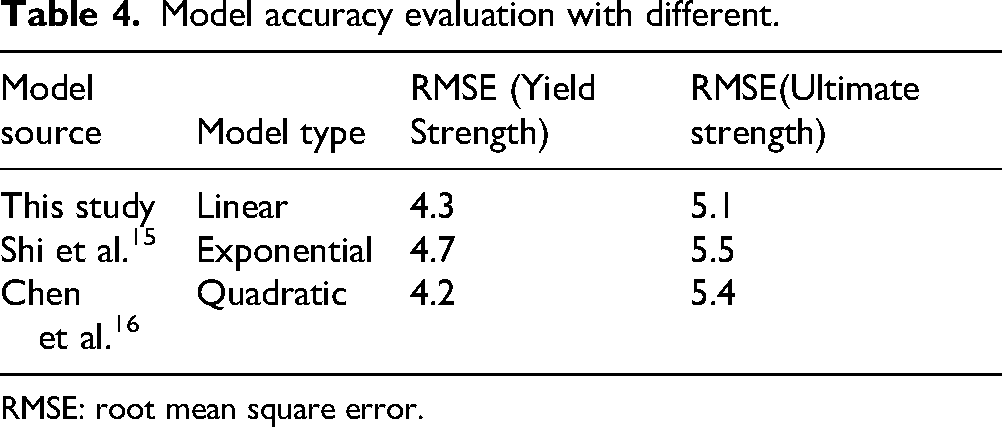
RMSE: root mean square error.
Conclusions
This study systematically investigated the corrosion behaviour and mechanical property degradation of Q235 steel under simulated acid rain exposure. Based on electrochemical corrosion tests, monotonic tensile testing, and multi-scale microstructural analyses (SEM, XRD, EDS), the following conclusions can be drawn:
Acid rain corrosion induces localised pitting on the surface of Q235 steel. Fracture behaviour varies with corrosion ratio: specimens with W ≤ 10% primarily exhibit normal fracture, while those with W ≥ 15% show oblique fracture, indicating a transition toward brittle failure. With increasing corrosion ratio, Q235 steel exhibits a clear degradation trend: yield strength, ultimate tensile strength, elastic modulus, and elongation all decrease, while Poisson's ratio slightly increases. This degradation is linked to pit-induced stress concentrations and strain-hardening suppression, as confirmed by stress–strain curves and SEM fracture morphology. The dominant corrosion form is pitting corrosion, primarily driven by oxygen and nitrate ions. XRD results show that initial corrosion products include α-FeOOH and Fe3O4, which later transform into less protective β-FeOOH and γ-FeOOH, weakening the passivation capacity of the rust layer. Linear empirical models with R2 values exceeding 0.80 were developed to predict mechanical property degradation based on corrosion ratio. These models offer a balance between accuracy and simplicity and outperform or match existing nonlinear models such as those by Shi et al. and Chen et al. for Q235 steel. The proposed models provide a practical tool for assessing the residual performance of corroded steel structures in acid rain–prone regions. Future research will refine these models to incorporate diverse acid rain compositions and loading conditions, enabling broader applicability in durability assessment and structural design.
Footnotes
Acknowledgements
This research is funded by the Natural Science Foundation of Shandong province (Grant No. ZR2024ME141). The authors wish to gratefully acknowledge the support of these organisations for this study.
Funding
The authors received no financial support for the research, authorship, and/or publication of this article.
Declaration of conflicting interests
The authors declared no potential conflicts of interest with respect to the research, authorship, and/or publication of this article.
Data availability
Statement Some or all data, models, or code that support the findings of this study are available from the corresponding author upon reasonable request.
Supplemental material
Supplemental material for this article is available online.