
Abstract
The effects of thin electrolyte film thickness, corrosion product, and electrode size on the galvanic corrosion of 2024/Q235/304 trimetallic couple under thin electrolyte film conditions are investigated by experiments and the finite-element method (FEM) model. Galvanic current curves were measured by zero resistance ammeter. A FEM model was built and validated with considering the electrochemical reaction, the mass transfer, deformation of anode, and deposition of corrosion products, without considering the electrolyte evaporation. It is found that the reduction of thin electrolyte film thickness plays dual roles, that is, decreasing the oxygen diffusion path to accelerate galvanic corrosion and increasing the solution resistance to inhibit galvanic corrosion. The cathode/anode roles of Q235 with medium corrosion potential among three metals are different at its different locations due to the effect of the IR drop of solution resistance. The deposition of corrosion products inhibits the galvanic corrosion, but aggravates the edge effect in the junction between 2024 and Q235.
Introduction
Dissimilar metal connectors are widely used in engineering equipment, resulting in a serious risk of galvanic corrosion.1,2 In the past decades, the investigations mainly focus on the galvanic corrosion of bimetallic couples.3–11 Actually, trimetallic couples are inevitable in practical applications, such as lap structures, tube structures, welding structures, and pipeline structures between three metals. In our previous work,12–14 the effect of corrosive media, oxygen concentrations, and cathode/anode area ratios on the galvanic corrosion of 2024/Q235/304 trimetallic couple has been studied systematically in a marine immersion environment. Actually, the vast majority of engineering equipment is exposed to the marine atmospheric environment and suffers the atmospheric galvanic corrosion. 15 Thus, it is necessary to investigate the galvanic corrosion of trimetallic couples in the marine atmospheric environment.
The essence of atmospheric corrosion is the electrochemical corrosion under the thin electrolyte films of different thicknesses. 16 Although researchers have designed some measuring devices for electrochemical measurements under a thin electrolyte film,17–20 it is still very difficult to accurately control and measure the thin electrolyte film thickness, especially the extremely thin condition. Thus, experimental measurements under a thin electrolyte film are difficult to carry out.
With the development of computing science, the advantages of the finite-element model (FEM) appear, and it is widely used in galvanic corrosion prediction.4,21–24 In our previous work,13,14 a FEM of 2024/Q235/304 trimetallic galvanic corrosion in a marine immersion environment was built, which can obtain the potential and current density distributions on the surface of different electrodes. Deshpand et al. 23 investigated the galvanic corrosion of AE44/AA6063 bimetallic couple in 1.6 wt.% NaCl electrolyte using FEM, which simulated the corrosion dissolution of magnesium alloy using Arbitrary Langrangian-Eulerian (ALE) method, 25 and found that the corrosion of the magnesium alloy near the cathode is the most serious. Sun et al. 26 considered the effect of corrosion product deposition based on Deshpand's model and found that the deposition of corrosion products can reduce the active areas of the electrode surface and then inhibit the galvanic corrosion.
The Marine atmospheric environment is more complex than the marine immersion environment. Tomashov et al. 27 introduced that the corrosion rate of many metals under the thin electrolyte film is determined by the oxygen reduction reaction. In return, the oxygen reduction reaction is controlled by the dissolution and diffusion process of oxygen at air/electrolyte interface and inside the electrolyte, respectively, which means that the thickness of thin electrolyte film plays a key role in the oxygen reduction reaction. 28 Palani et al. 29 built a FEM of AA2024/ carbon-fibre reinforced polymer (CFRP) bimetallic galvanic corrosion using the cathodic polarisation curves of CFRP under different thin electrolyte film thicknesses to describe the reaction kinetics of oxygen reduction, but the deposition of corrosion products and the dissolution process of oxygen at air/electrolyte interface were not considered. Deconinck et al.30–32 studied the oxygen reduction reaction on platinum under different thin electrolyte film thicknesses using a multi-ion transport and reaction model by solving the second Fick's law for oxygen transport. In a word, FEM is a promising method to investigate the galvanic corrosion process under a thin electrolyte film. However, the trimetallic galvanic corrosion under a thin electrolyte film is more complex in comparison with bimetallic galvanic corrosion, especially, considering the deposition of corrosion products, oxygen diffusion process, and so on.
In this article, a FEM of trimetallic galvanic corrosion under the thin electrolyte film without considering the electrolyte evaporation is built and validated by experiments. The electrochemical reactions on the electrodes, the mass transfer and the homogeneous reactions in electrolytes, and the deformation of anode and deposition of corrosion products are considered for the FEM model. Based on this model, the kinetics of trimetallic galvanic corrosion under the thin electrolyte film is investigated, and the effects of the thin electrolyte film thicknesses and electrode sizes on the galvanic corrosion rate are disclosed.
Experimental
The three metals of 2024 Al alloy, Q235 carbon steel, and 304 stainless steel were used in this work, and their chemical composition was the same as reported in previous work.12–14 An electrochemical measurement device of the thin electrolyte film was designed and fabricated as shown in Figure 1. The device included a horizontal platform at the bottom, an electrolytic cell in the middle with temperature of 25 ± 2 °C controlled by a constant temperature water bath, and an electrolyte film thickness measuring device at the top. The working electrode (WE), consisting of three metals sealed by resin, was placed in the electrolytic cell with the working surface upwards. A level vial was placed on the WE to maintain WE level by adjusting the horizontal platform. Then, the thickness of the thin electrolyte film was measured by a micrometer with a platinum needle at the tip. The micrometer and WE were connected to the multimeter. When the platinum needle was in contact with the electrolyte, a closed loop was formed, and there was a value in multimeter and a corresponding length in micrometer d1. It was noted that the deformation of the liquid surface may occur due to surface tension, but the d1 can be determined immediately once the platinum needle touches the electrolyte. Thus, the effect of surface tension on the precision of d1 can be ignored. Rotating the micrometer until touching the WE, there was another value in multimeter and a corresponding length in micrometer d2. The difference between the two values of micrometer was the thickness of the thin electrolyte film. The measurement precision of the thin electrolyte film thickness was 10 μm because the precision of the micrometer is 10 μm. A table, which can be adjusted vertically by screws, was placed in the middle of the electrolytic cell to adjust the thickness of the thin electrolyte film. To ensure the stability of the thin electrolyte film thickness during the testing process, a constant temperature humidifier was used to maintain the humidity at saturation.
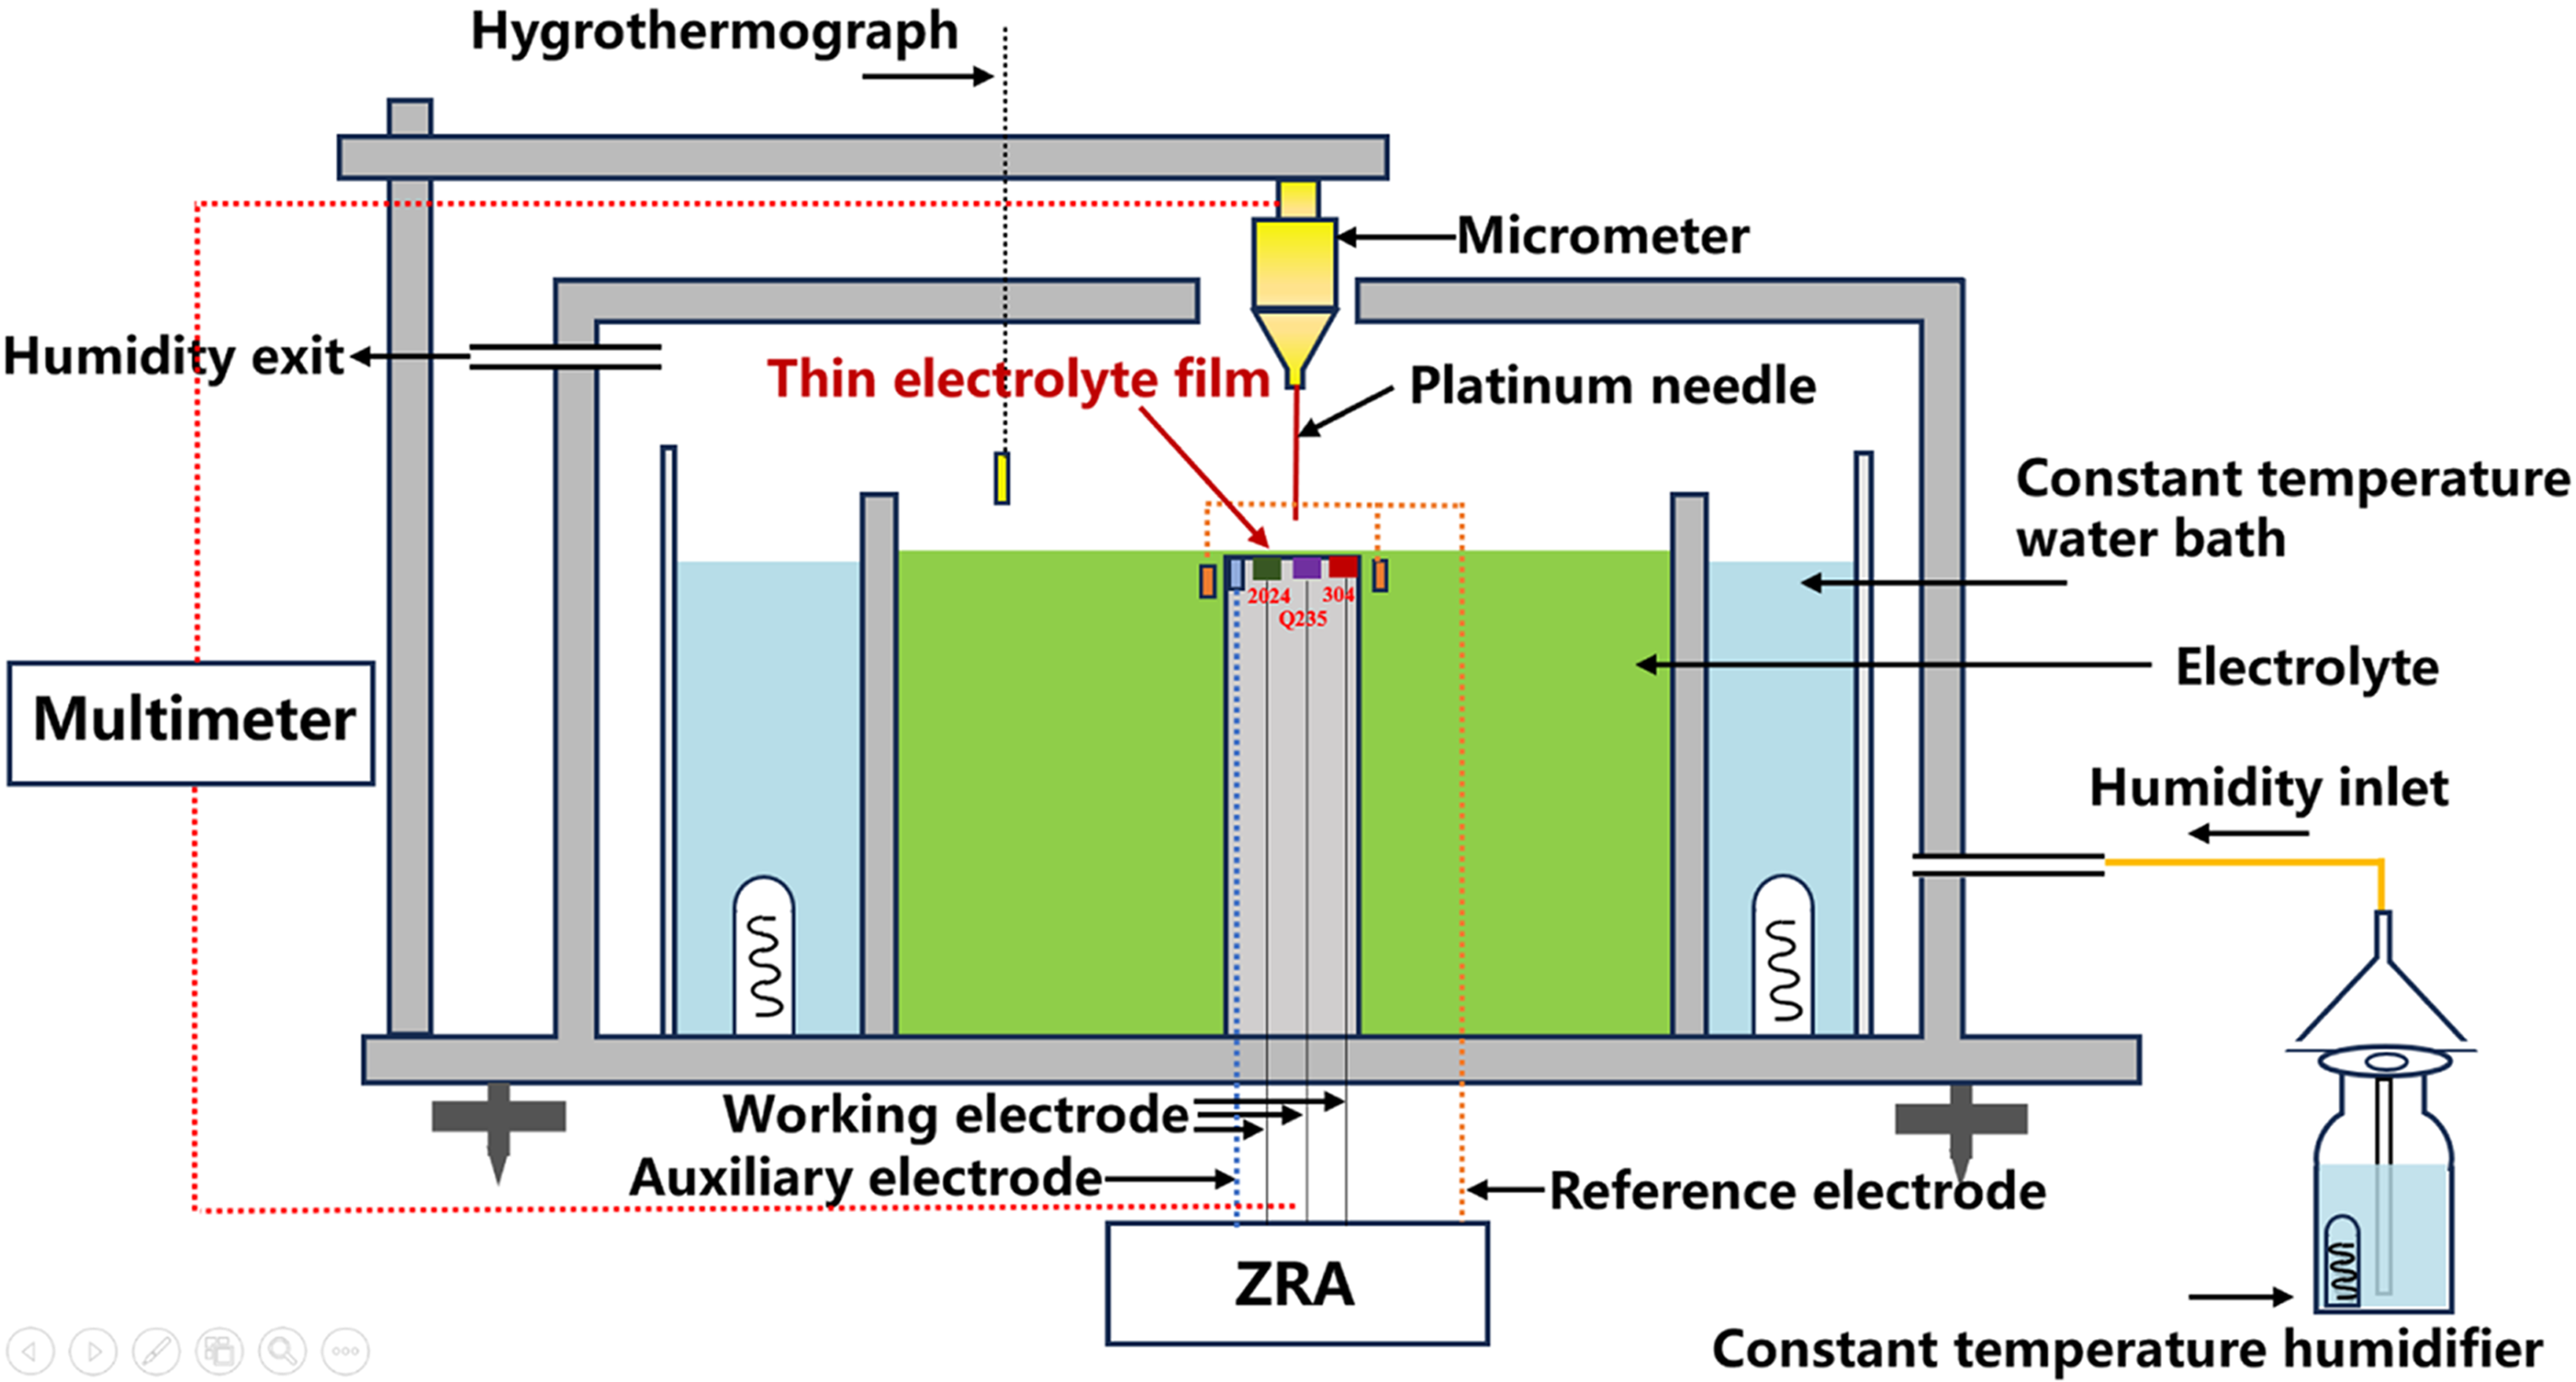
Schematic of the electrochemical measurement device under thin electrolyte film environment.
After the thin electrolyte film thickness was adjusted and measured, a multi-channel galvanic corrosion test device CST508 with zero resistance ammeter model was used to monitor the galvanic current of three metals. Detailed measurement methods were introduced in our previous work. 12
Modelling
A 2D FEM model was built as shown in Figure 2. The domain height of 500 μm represented the thickness of the thin electrolyte film, and it can be adjusted to simulate a thin electrolyte film of different thickness. Based on the result of reference, 30 the thickness of the oxygen diffusion layer is approximately 500 μm. Thus, the thickness range of the thin electrolyte film was set from 500 μm to 10 μm. Although the thickness of the thin electrolyte film under an atmospheric corrosion environment is only some micrometers, this work focuses on a great scope of thin electrolyte thickness of 10~500 μm, aiming to obtain the influence law of different thin electrolyte film thickness on trimetallic galvanic corrosion. 2024, Q235, and 304 with a length of 4 mm represented the corresponding electrodes. COMSOL Multiphysics 5.5® was used to solve the differential equations for describing the electrochemical reactions on the electrodes, the mass transfer and the homogeneous reactions in electrolytes, the deformation of anodes, and the deposition of corrosion products. The model geometry (x-y section) with the corresponding meshing based on the actual electrode arrays in galvanic corrosion experiments can refer to our previous publication. 14
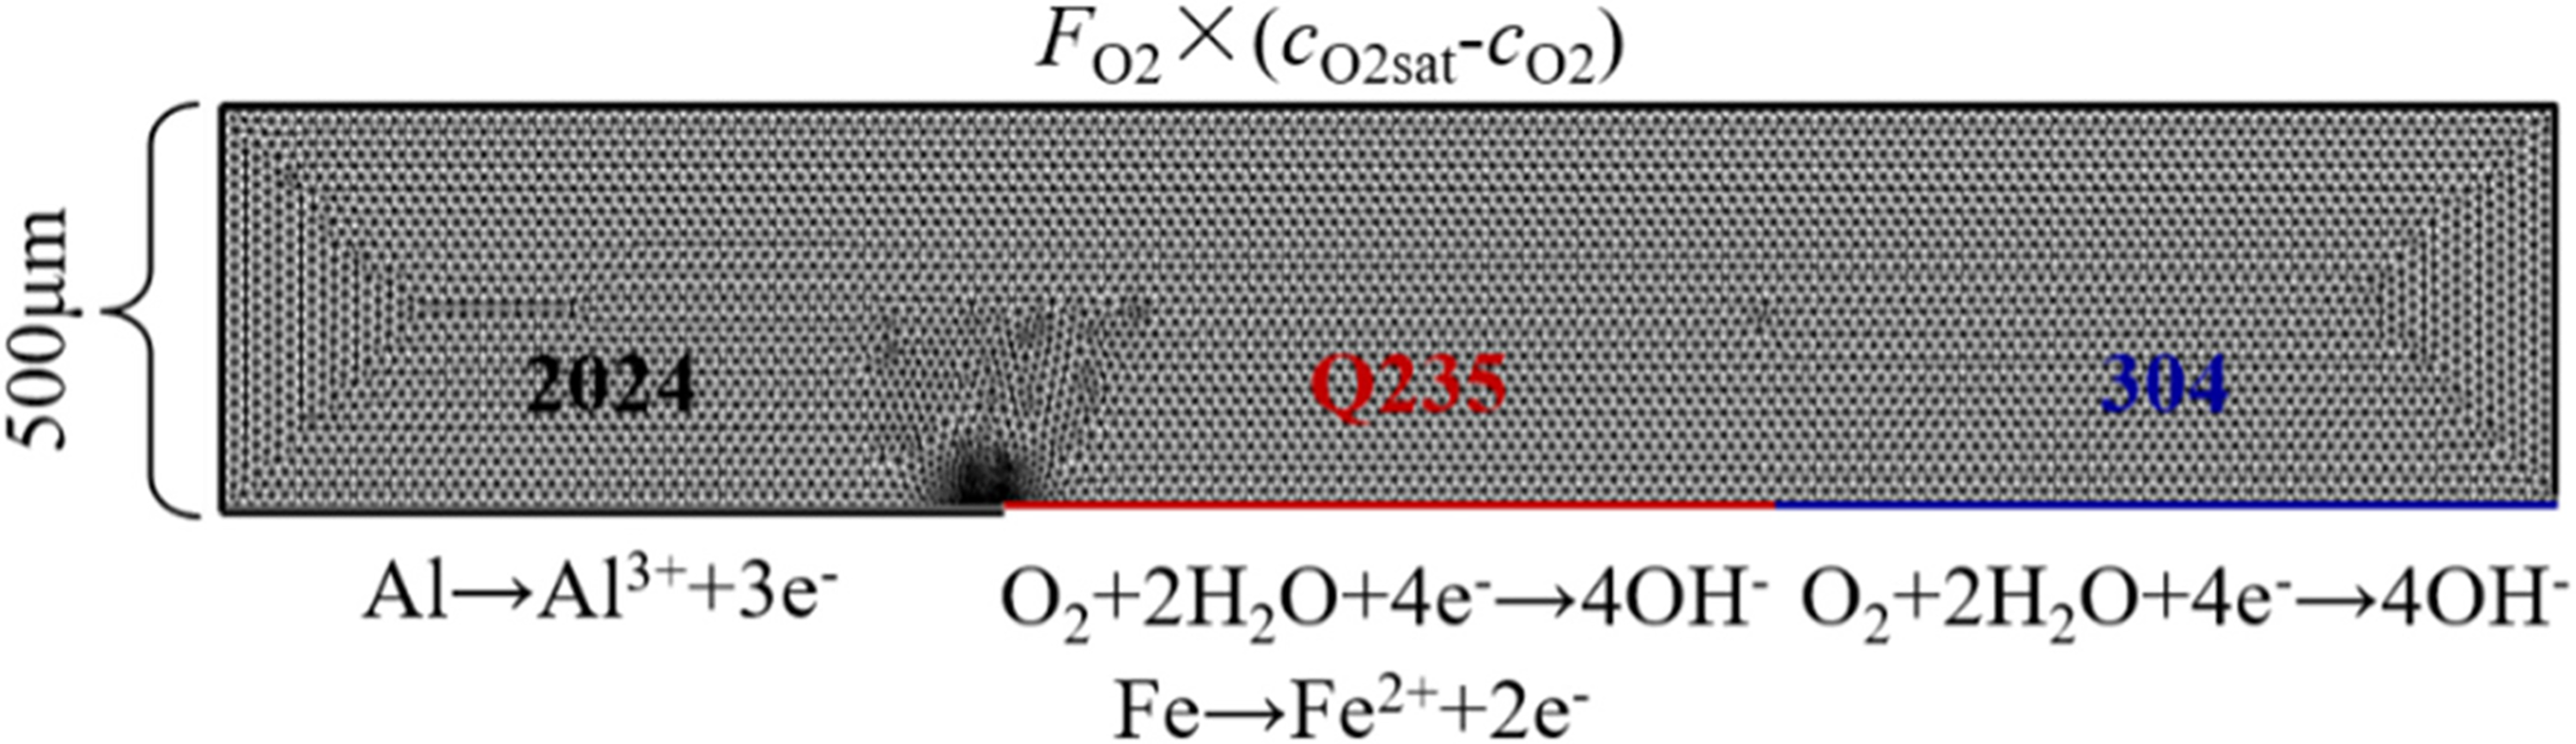
Model geometry with the corresponding meshing of trimetallic galvanic corrosion under thin electrolyte film environment.
This model was established based on the assumptions and features as follows:
The electrolyte conforms to the dilute solution theory, considering only the diffusion and electromigration of species, while neglecting convection and evaporation. The oxygen dissolution process at the gas–liquid interface is taken into account. It is assumed that there is no reduction reaction on the 2024 surface and there is no anodic dissolution reaction on the 304 surface. The anodic dissolution reactions on 2024 and Q235, as well as the oxygen reduction reaction on Q235 and 304 surfaces, are considered. The model allows for adjusting the thin electrolyte film thickness and electrode dimensions through the geometric boundaries shown in Figure 2. The deformation on the 2024 surface due to active dissolution is considered, along with the variations in the areas of the anode and cathode during the galvanic corrosion process. The influence of corrosion product deposition on the corrosion process is taken into account, with the corrosion products having a porous structure.
Electrochemical corrosion is a complex process involving multiple physical fields. Therefore, it is necessary to appropriately simplify the actual electrochemical corrosion process. The model of trimetallic galvanic corrosion under a thin electrolyte film introduced in this paper primarily considers the following process: electrochemical reactions on the electrode surfaces, species transport and homogeneous reactions in the electrolyte, corrosion-induced deformation, and corrosion product deposition.
Electrochemical reactions on the electrode surfaces
The results in our previous work12–14 show that 2024 always acts as an anode, 304 always acts as a cathode, and Q235 could be a cathode or an anode in 2024/Q235/304 trimetallic couples. Thus, the dissolution reactions of 2024 and Q235, and the oxygen reduction reaction on Q235 and 304 are considered in this model.


Different from an immersion environment, the oxygen diffusion path varies with the thickness of the thin electrolyte film, resulting in the variation of the kinetics of oxygen reduction reaction, but it has no effect on anodic dissolution reactions. Therefore, the anodic and cathodic reactions can be described by the Butler–Volmer equation:


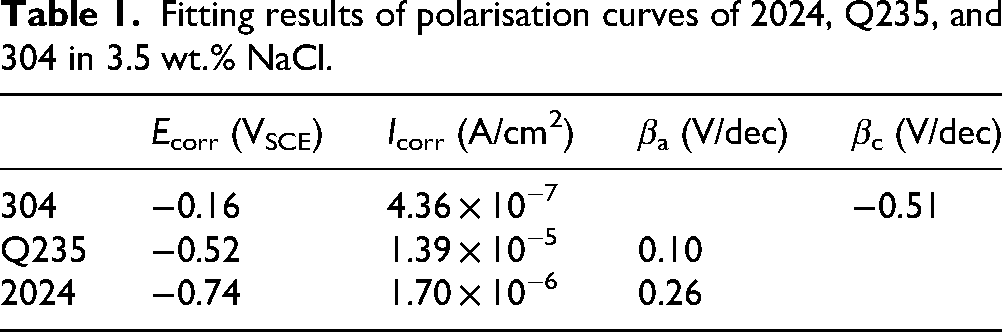
Equations 4 and 5 are the simplified Butler–Volmer equation under strong polarisation conditions, where the cathodic reaction is neglected during anodic polarisation, and the anodic reaction is neglected during cathodic polarisation, where, ia and ic represent the current density of anodic and cathodic reactions, respectively; i0 is the exchange current density of the corresponding reaction;
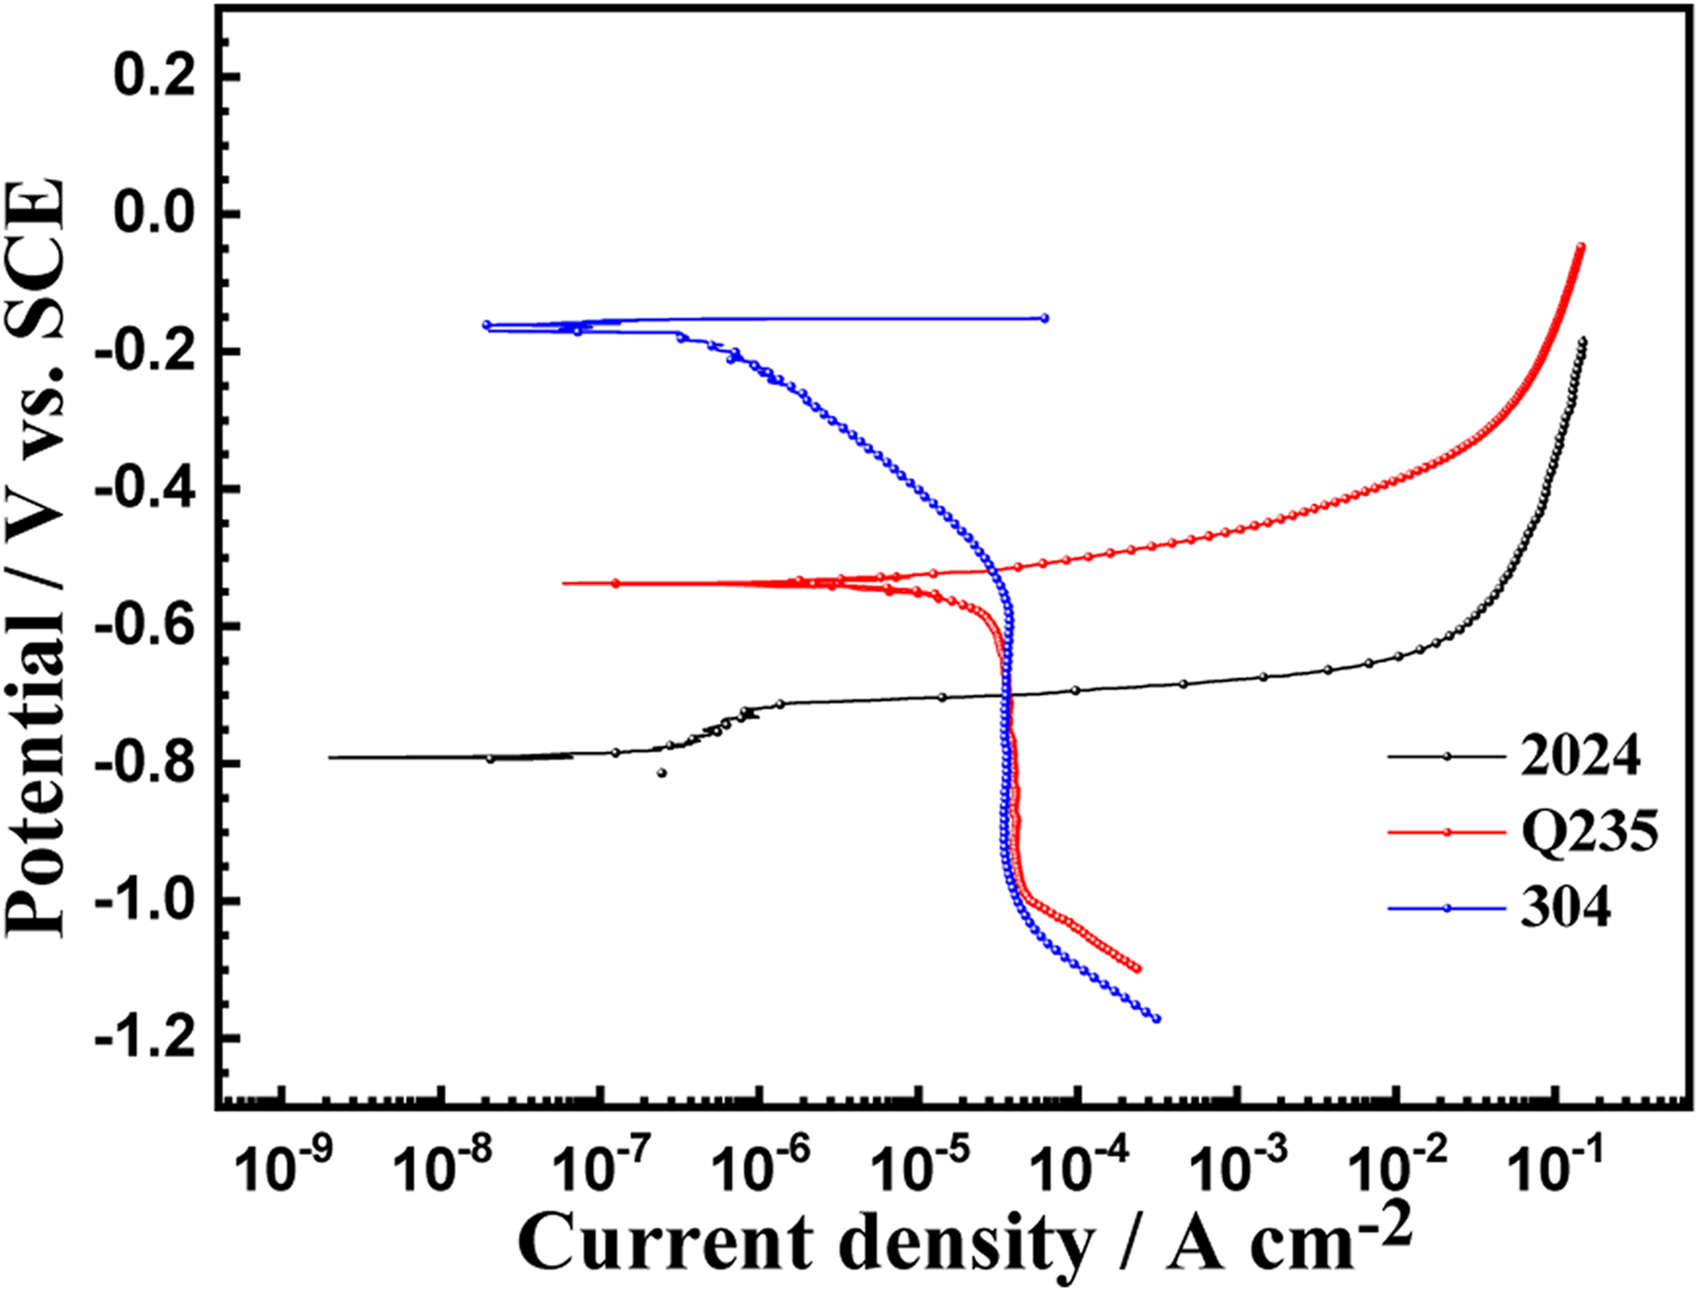
Potentiodynamic polarisation curves of 2024, Q235, and 304 in 3.5 wt.% NaCl.
Fitting results of polarisation curves of 2024, Q235, and 304 in 3.5 wt.% NaCl.
Mass transfer and homogeneous reactions in electrolytes
The Nernst–Plank equation was used to quantitatively describe the diffusion and the electromigration of ion i: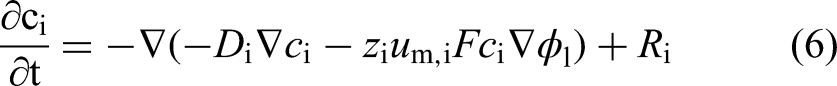
Ri is the source term, i.e. the formation and consumption of species in the electrolyte resulting from the homogeneous reaction in Equation 7. The reaction rate of Equation 7 is very fast. Thus, it can be regarded as an equilibrium reaction, and the equilibrium constant is set as 2.5 × 10−5.33–35
Diffusion coefficients, charge numbers, and initial concentrations of dissolved species.
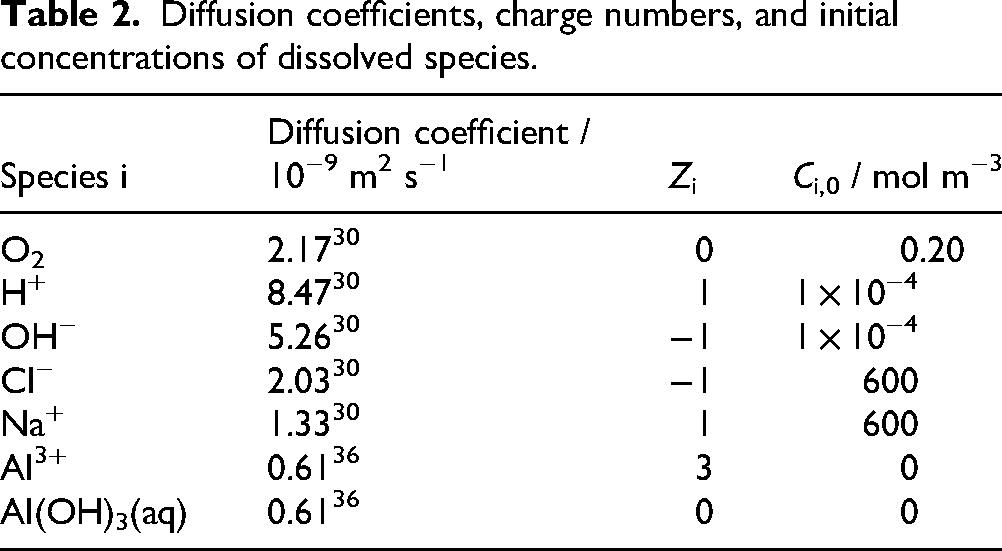

The equation set of Nernst–Plank equation cannot be solved because there are n + 1 variables for n equations. Therefore, the equation set needs to be coupled with the electroneutrality principle (Eq. 8) to solve the additional variable, and then solve the concentration distribution and potential distribution of n species in the model.

Moreover, both of the diffusion and electromigration of charged particles can generate currents. The distribution of current density in the electrolyte can be described using the Faraday law (Eq. 9) and the electroneutrality conditions (Eq. 10):


Besides, the normal flux of oxygen at the electrolyte–air interface is considered as follows30,32: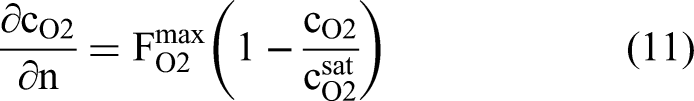
Deformation of anode and deposition of corrosion products
It is well known that galvanic corrosion will accelerate the dissolution of the anode. The dissolution process of 2024 can be quantitatively described by mathematical methods (Eq. 12).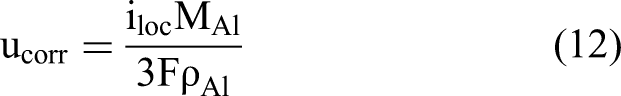
The deposition of corrosion products on the surface of 2024 was observed during experiments, so the deposition of Al(OH)3 was considered in this model to simulate the galvanic corrosion of 2024/Q235/304 trimetallic couple realistically, which can be described by Eq. 13 and Eq. 14.


The diffusion coefficients need to be corrected because of the deposition of corrosion products:

According to the Archie's empirical law,
39
the electrolyte conductivity in the corrosion product deposition region can be described as follows:
Results and discussion
Zero resistance ammeter results under different thin electrolyte film thicknesses
The galvanic current density of 2024/Q235/304 trimetallic couple was measured under different thicknesses of 3.5 wt.% NaCl thin electrolyte films for 20 h using the device shown in Figure 1, and the results are shown in Figure 4. The galvanic current density presents a typical diffusion-controlled process, that is, the anodic current values drop very fast in the initial stage and then reach a constant value, which is the establishment of stationary oxygen diffusion. 30 With the decrease of the thin electrolyte film thickness, both the anodic and cathodic current density increase. It is due to that the oxygen diffusion path decreases with decreasing electrolyte film thickness. As a result, the oxygen reduction reaction is accelerated, and the galvanic corrosion rate is promoted. In addition, the cathodic current density of Q235 and 304 is nearly the same when the electrolyte films are thick (300 μm in Figure 4(a) and 160 μm in Figure 4(b)). However, when the electrolyte films are thin (120 μm in Figure 4(c) and 40 μm in Figure 4(d)), the cathodic current density of Q235 exceeds that of 304, which is mainly associated with the IR drop. Q235 is nearer to 2024 than 304 as observed from Figure 2. When the electrolyte films are thick, the IR drop can be neglected, which is similar to the immersion condition in a strong electrolyte. However, when the electrolyte films are thin, the IR drop is large and has a great effect on the ion transfer rate. Further, the far cathode will exhibit a weak acceleration effect on the galvanic corrosion of anode.
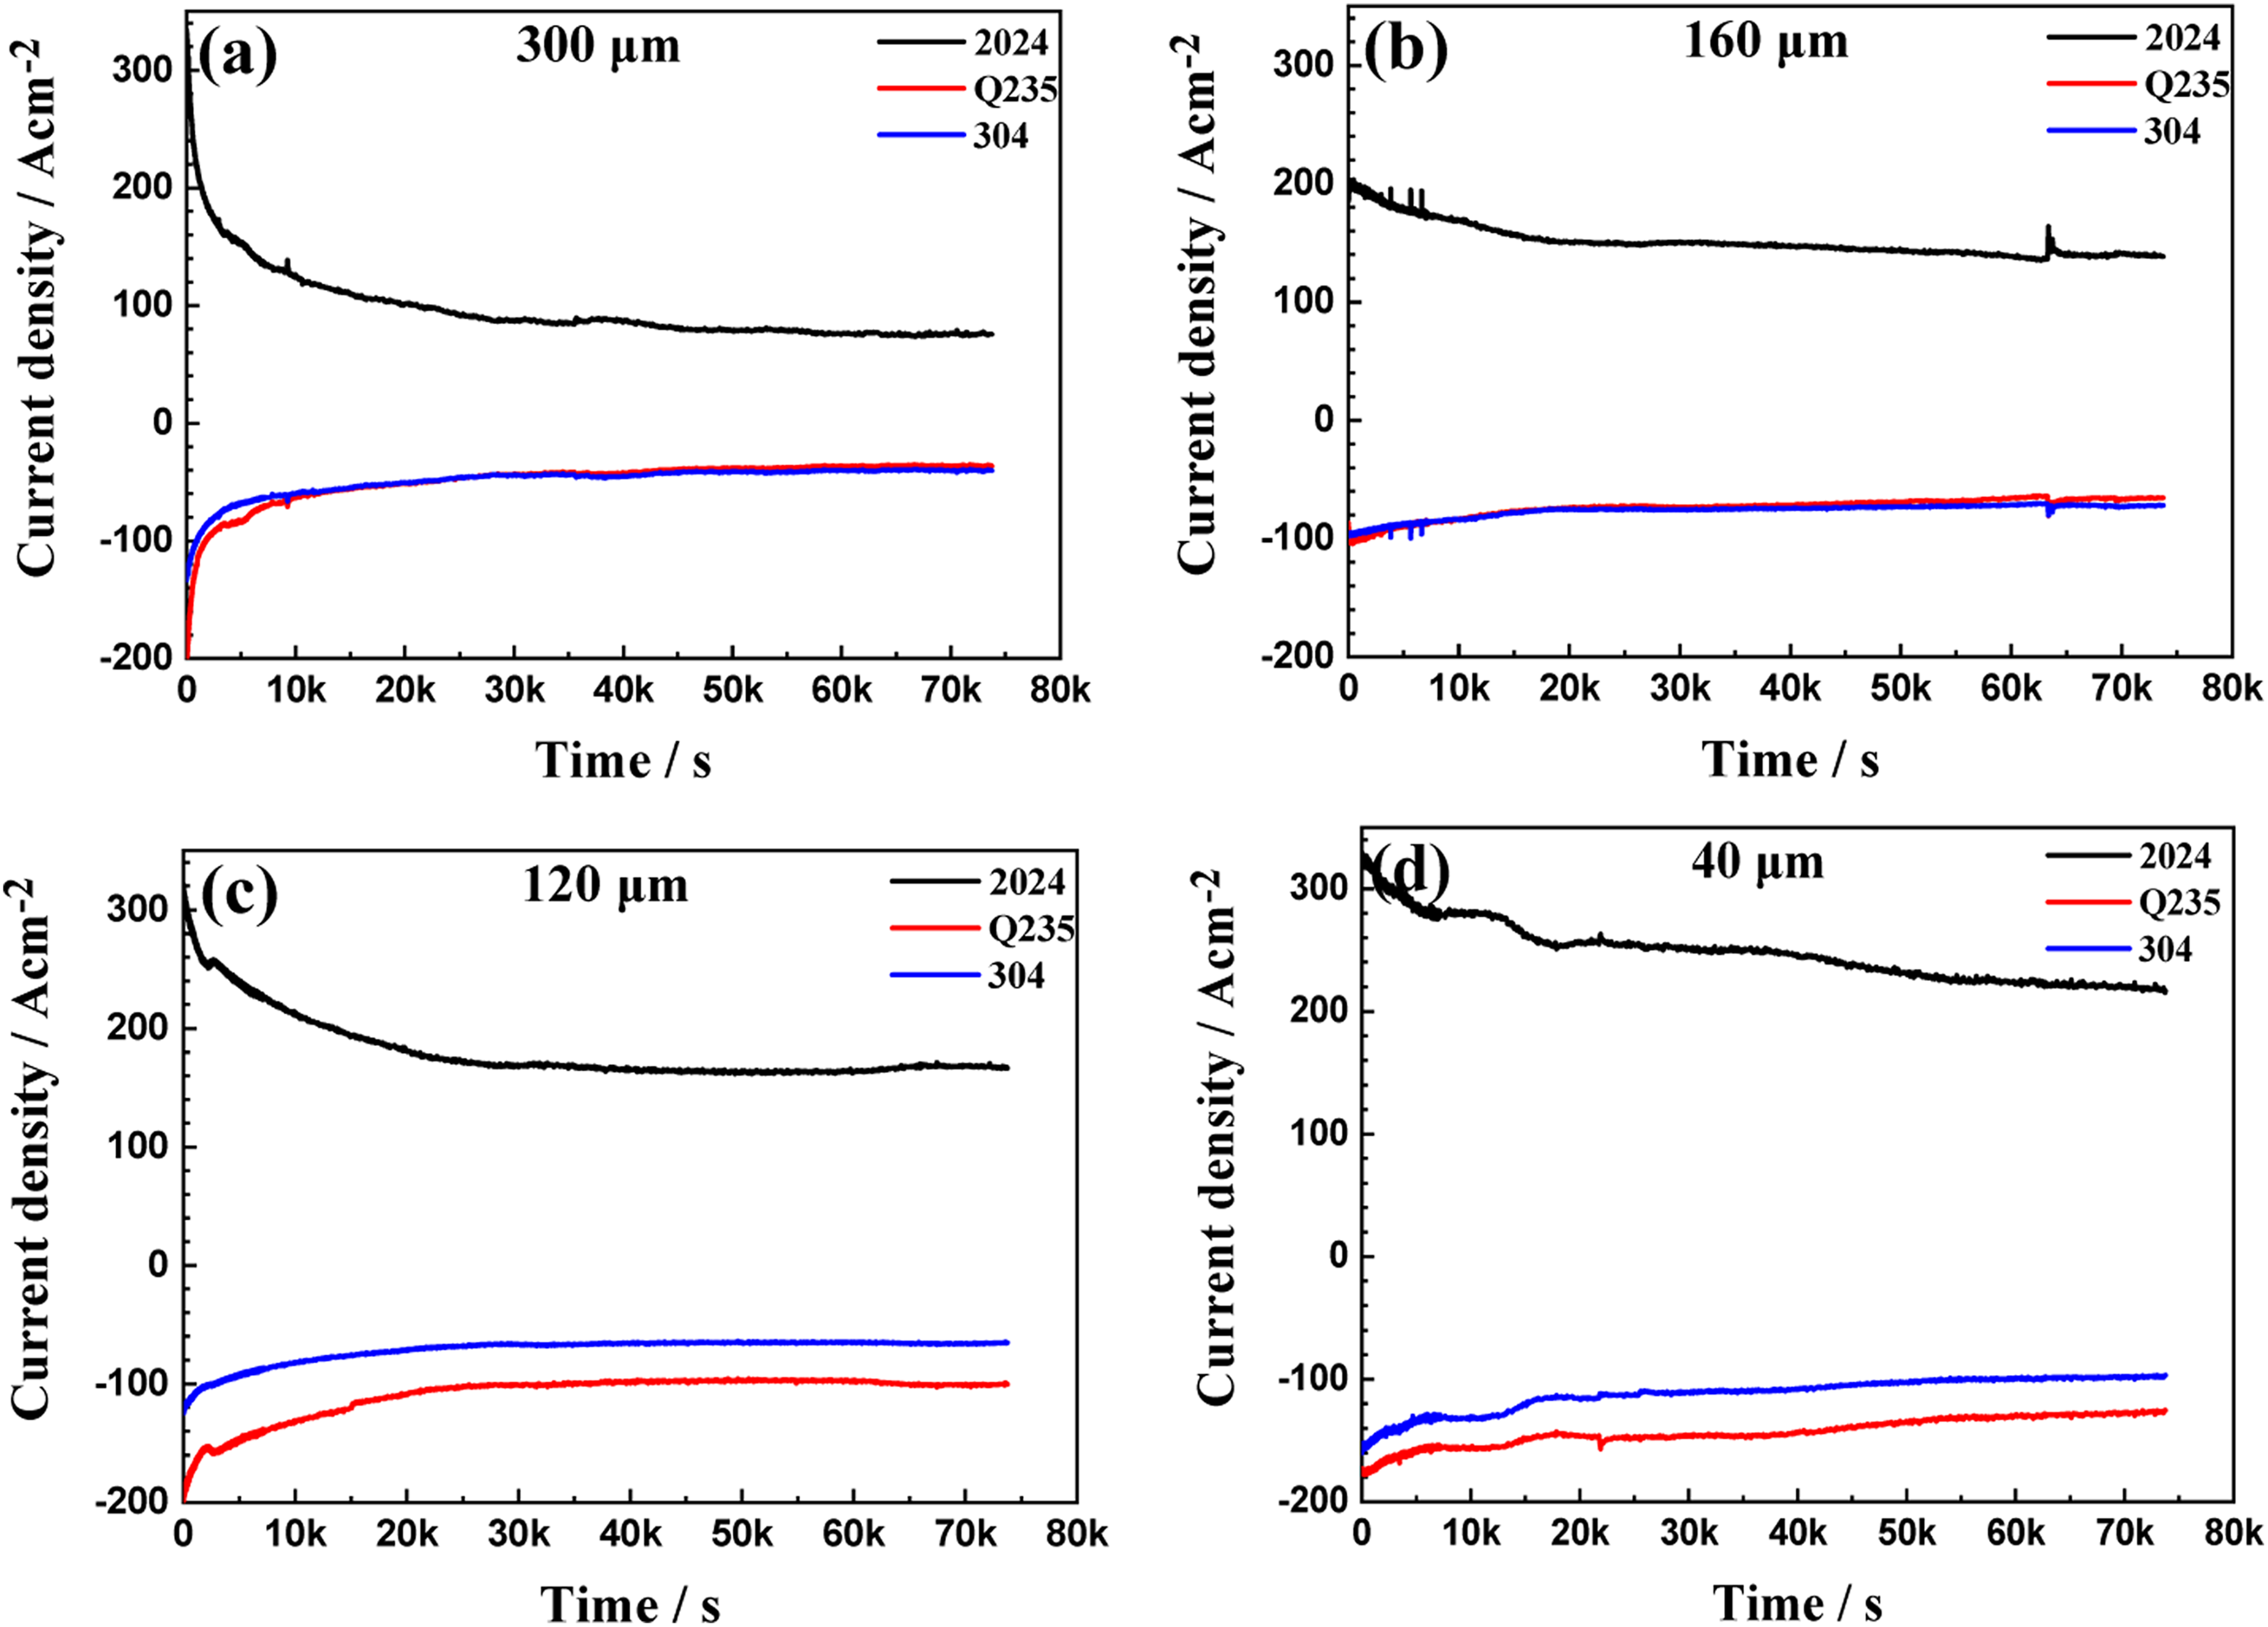
Experimental results of the galvanic current density of trimetallic couples under different thin electrolyte film thicknesses: (a) 300 μm; (b) 160 μm; (c) 120 μm; (d) 40 μm.
Simulation results without corrosion product deposition
To investigate the effect of the electrolyte film thickness, the galvanic corrosion of 2024/Q235/304 trimetallic couples under different electrolyte film thicknesses was simulated without considering the effect of corrosion product deposition. Experimental results show that 2024 always acts as the main anode, and its current density can exhibit the galvanic corrosion degree. Thus, the variations of the average current density of 2024 under different electrolyte film thicknesses are simulated as shown in Figure 5. The three curves show a similar trend that the average current density of 2024 has a slight increase with time. Moreover, with the decrease of electrolyte film thickness, the galvanic current density increases. The reason is shown in Figure 6. Galvanic corrosion accelerates the dissolution of 2024, and the exposed area of Q235 increases with the dissolution process, resulting in an increase of cathodic areas. Thus, the average current density of 2024 increases when it is coupled to the larger cathode. When the electrolyte film thickness is 500 μm (Figure 6(a)) and 200 μm (Figure 6(b)), respectively, the dissolution depth of 2024 is approximately 1 μm and 3 μm, respectively. When the electrolyte film thickness is 80 μm (Figure 6(c)) and 20 μm (Figure 6(d)), respectively, the dissolution depths of 2024 near and away from Q235 are different. It is due to that the decrease of oxygen diffusion path with decreasing thin electrolyte film thickness can accelerate the oxygen reduction reaction.
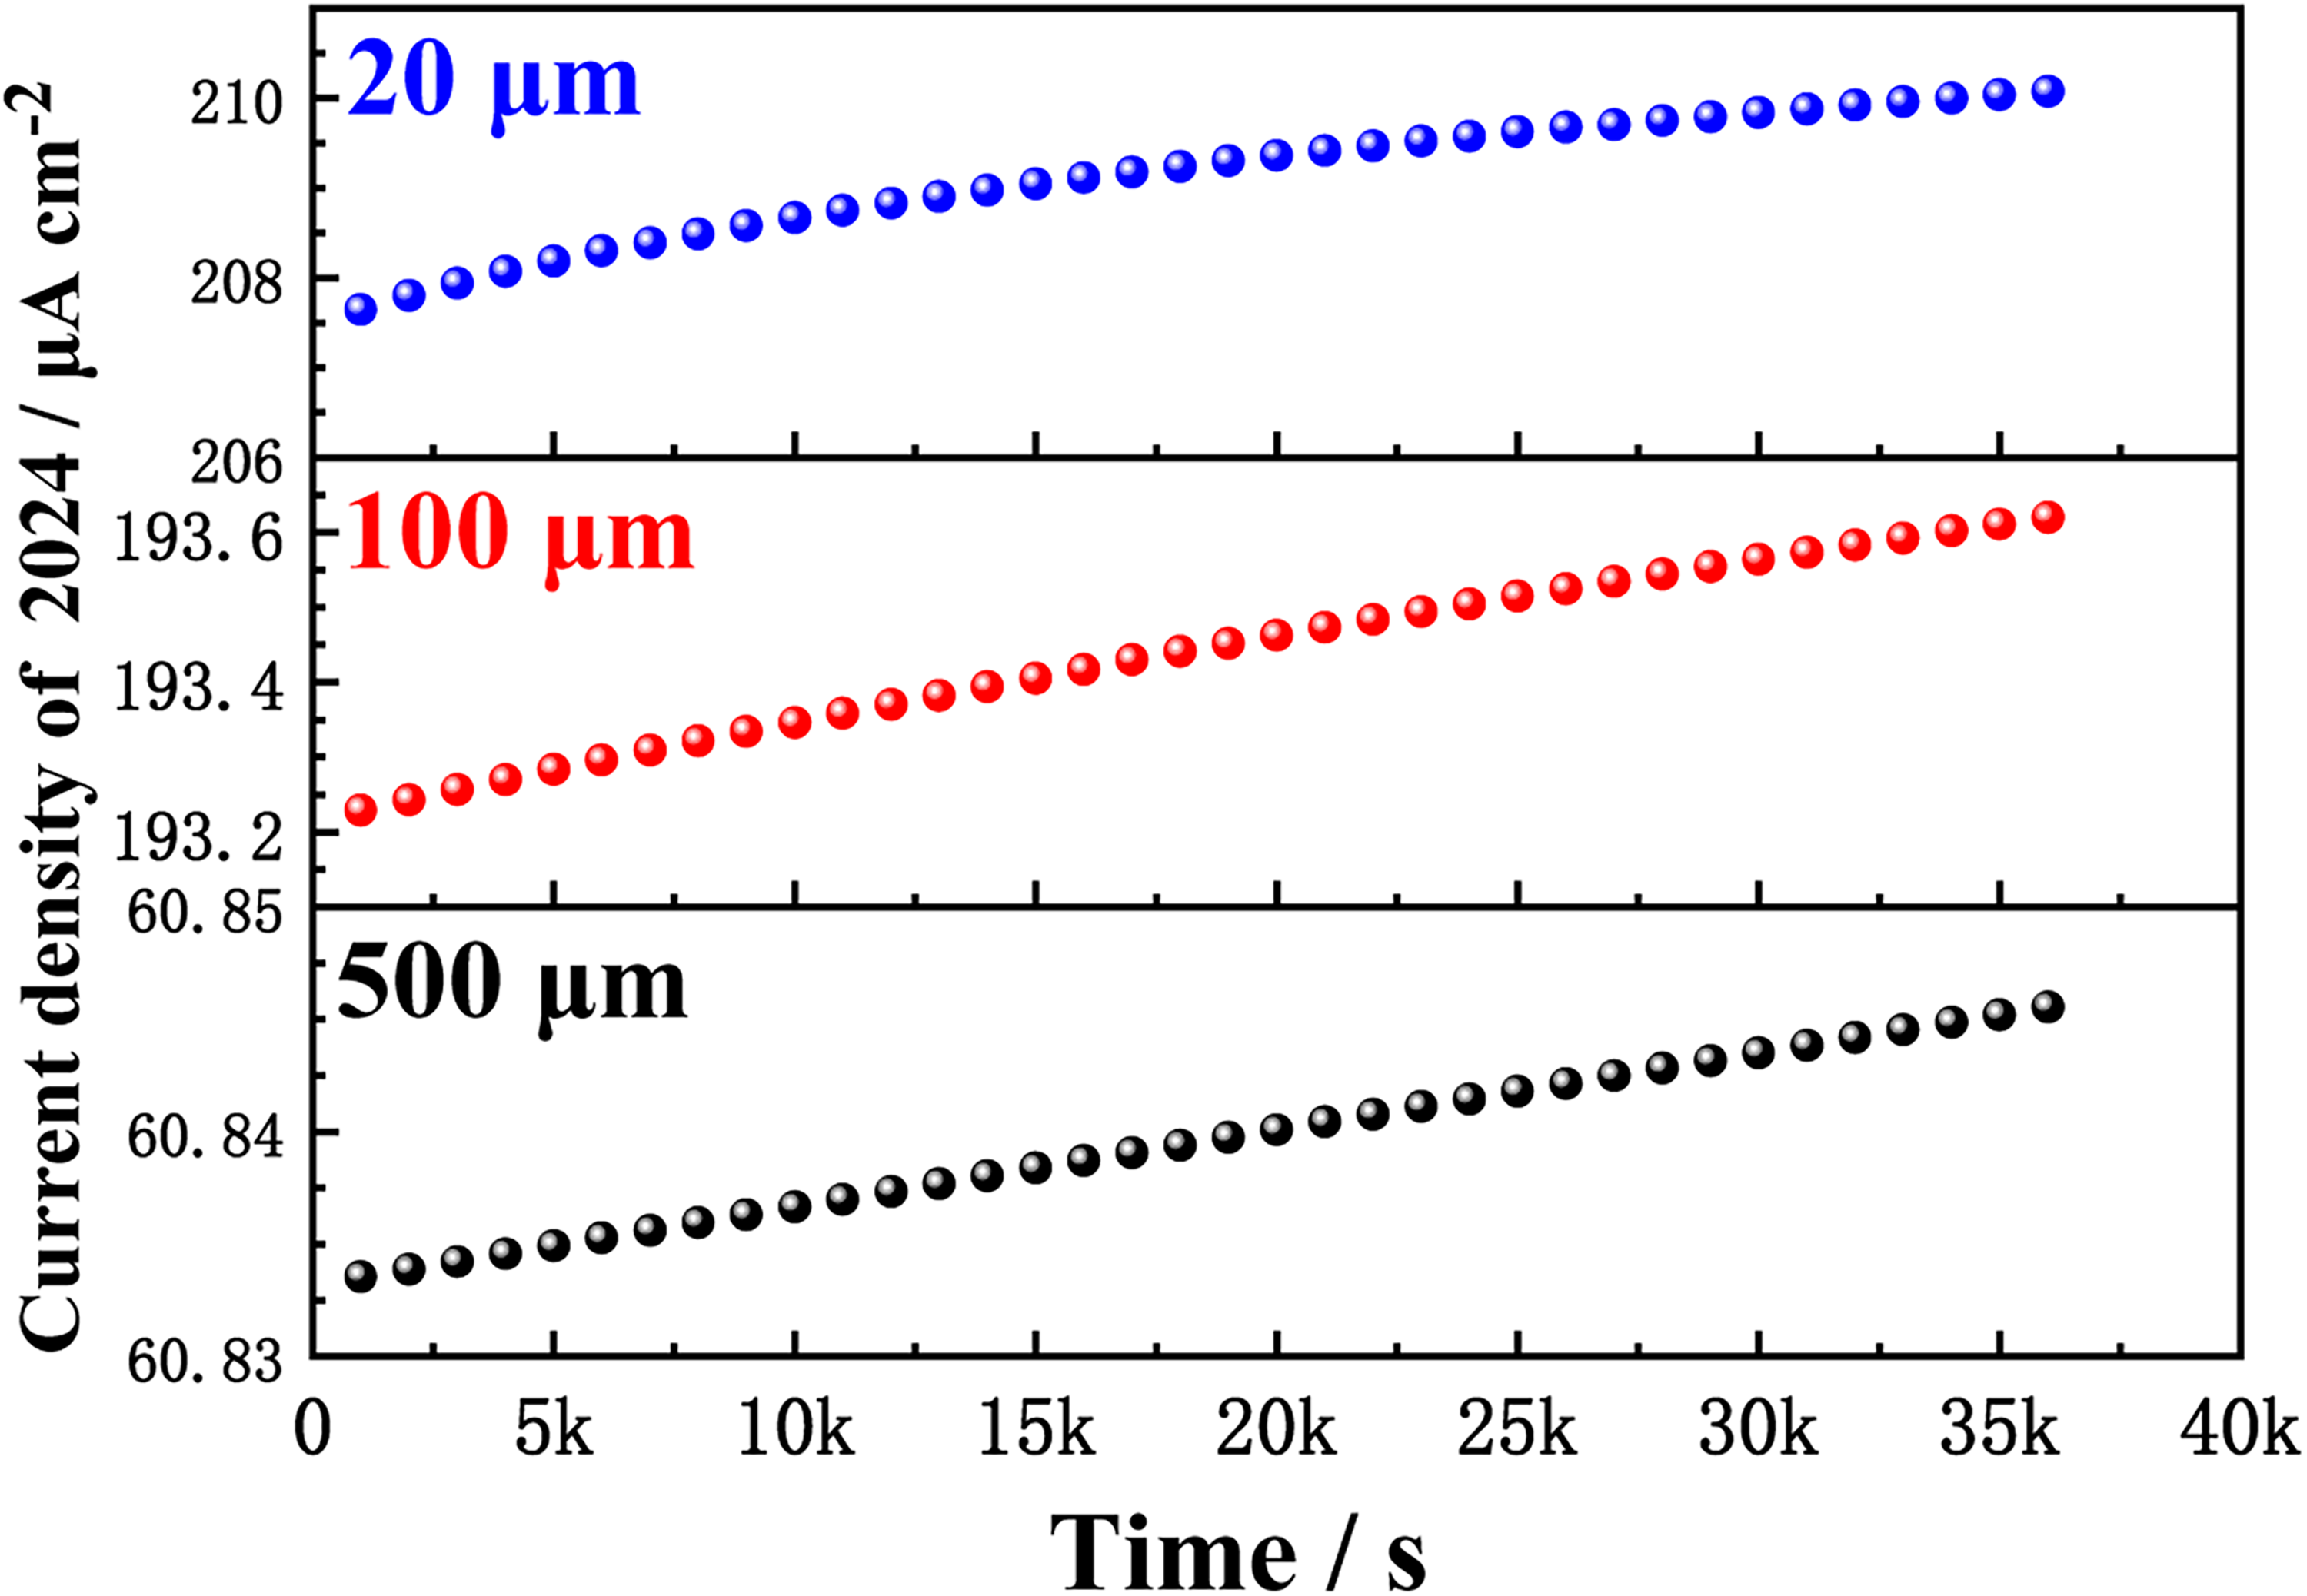
Simulation results of the variations of the average current density of 2024 with time under different thin electrolyte film thicknesses without considering the deposition of corrosion products.
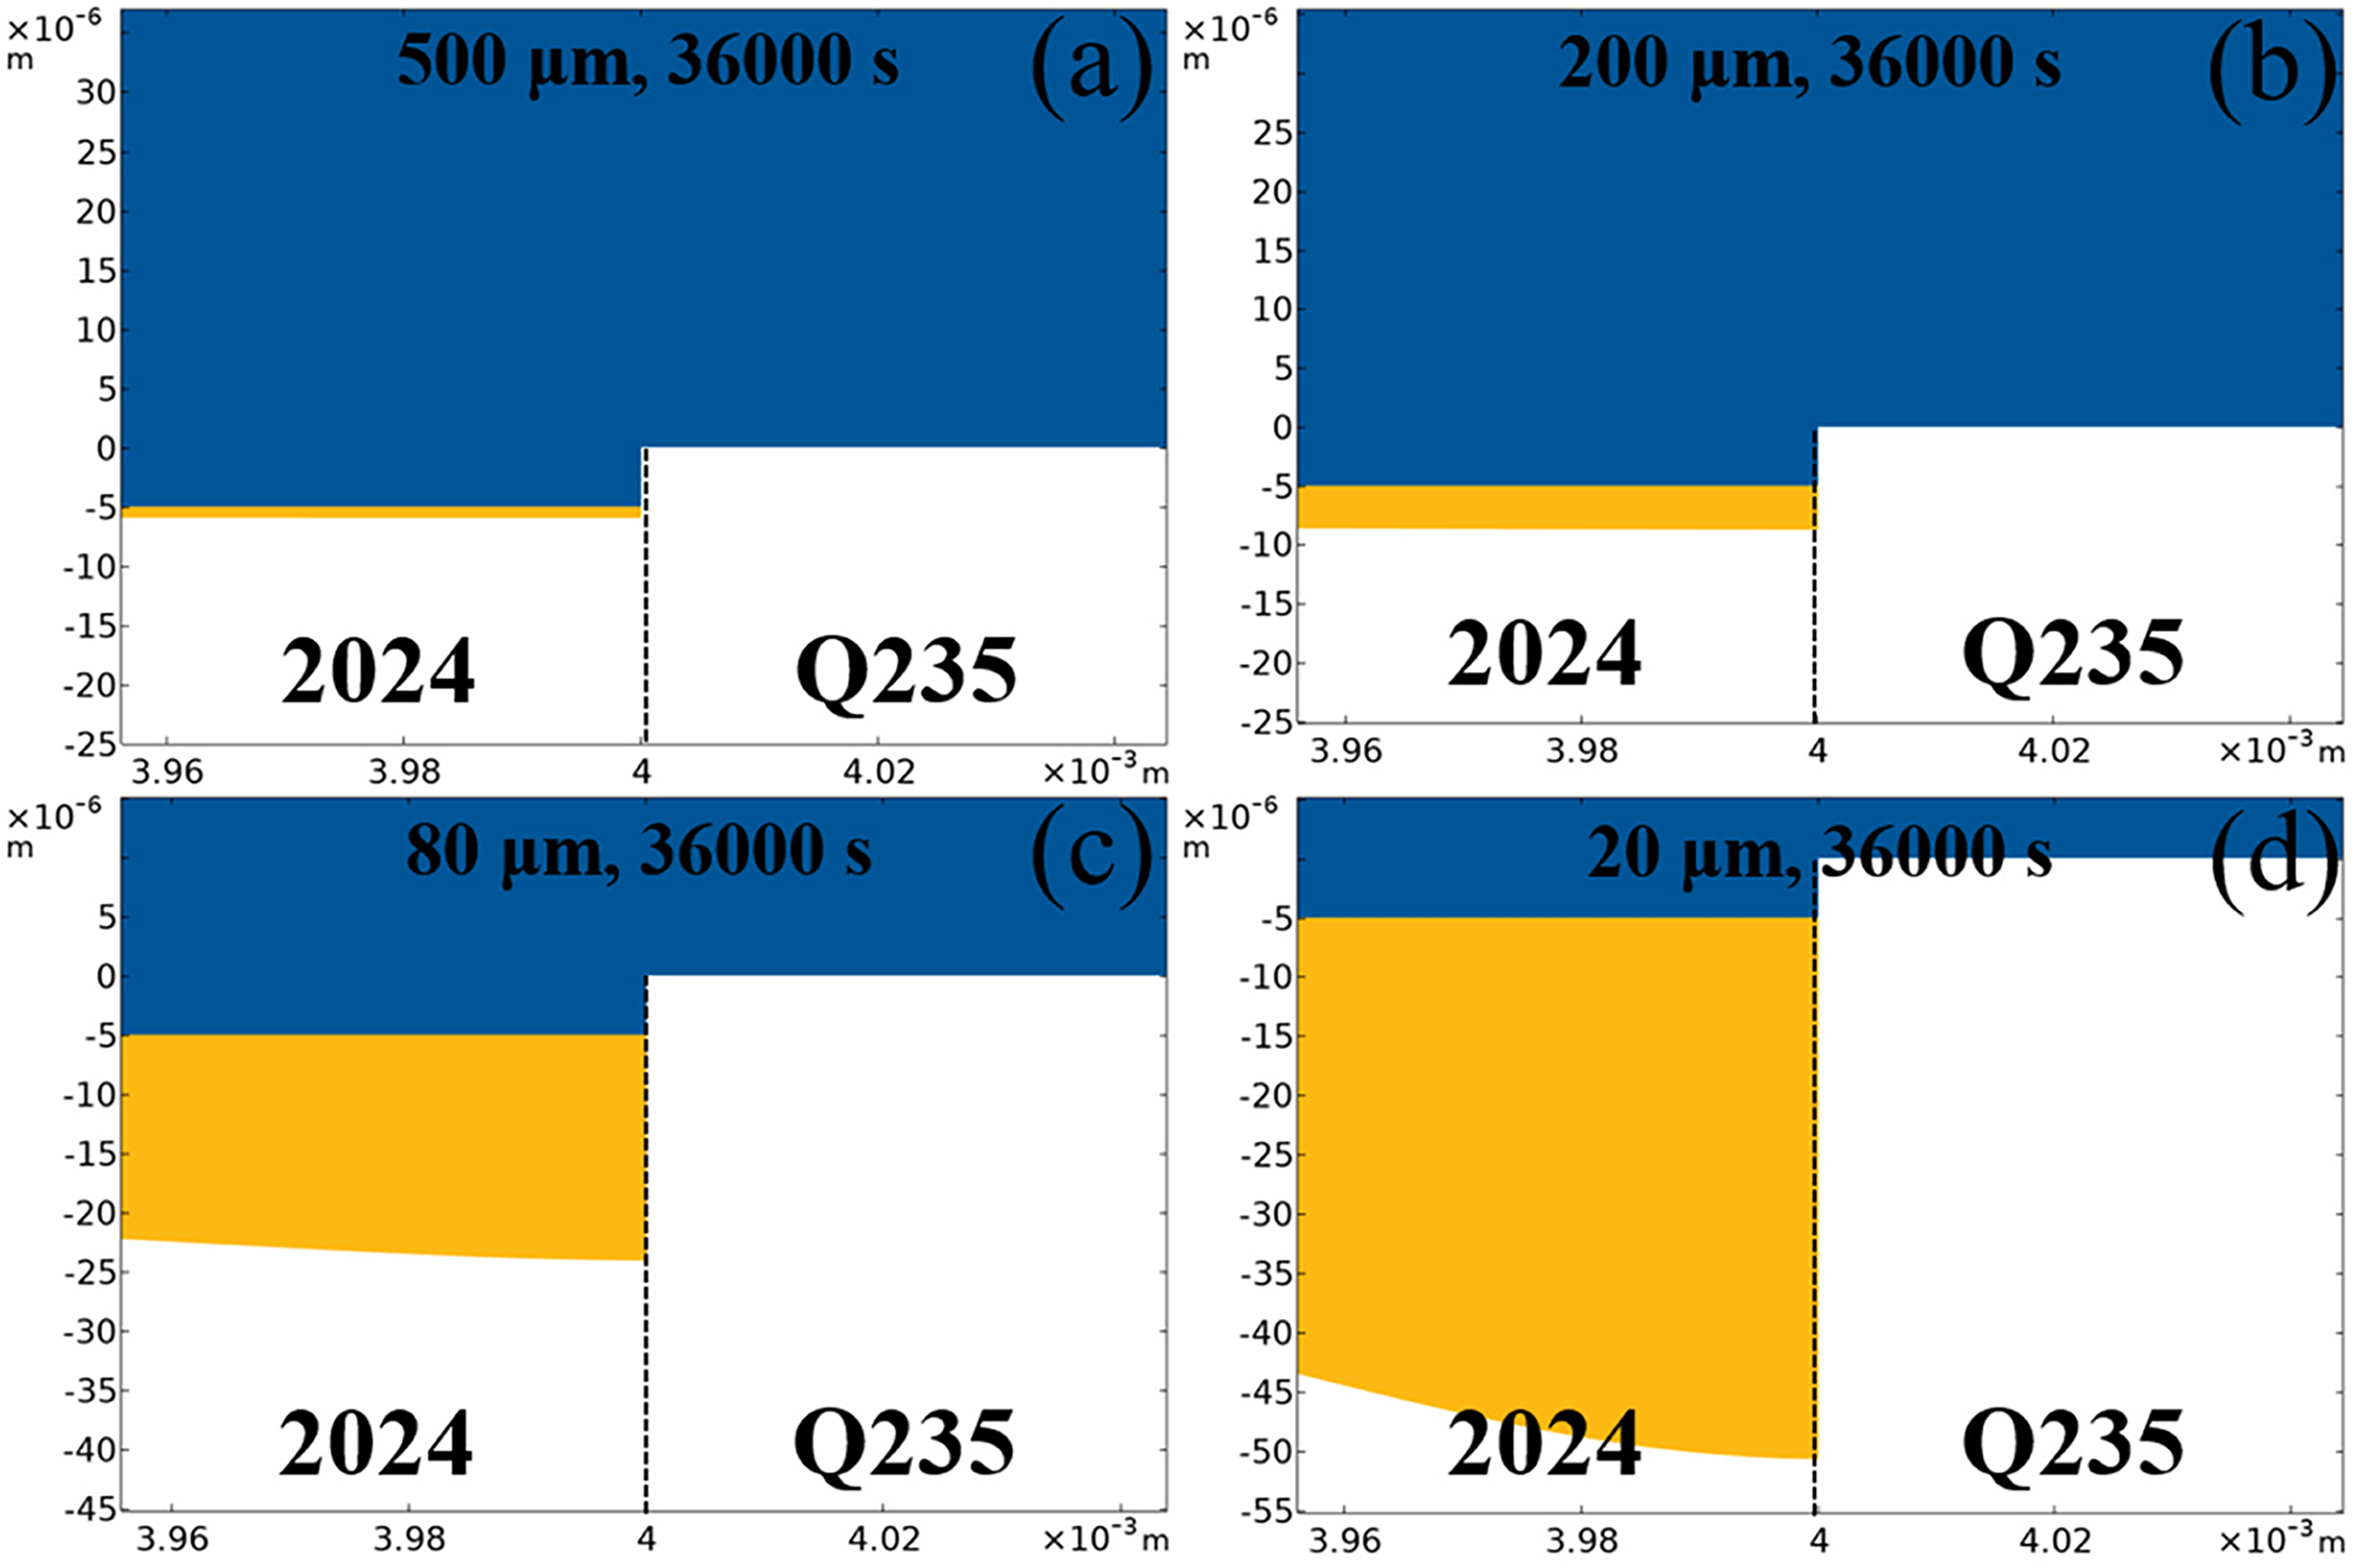
Simulation results of the corrosion dissolution of 2024 after galvanic corrosion for 10 h under different thin electrolyte film thicknesses without considering the deposition of corrosion products: (a) 500 μm; (b) 200 μm; (c) 80 μm; (d) 20 μm. The blue part represents the electrolyte, and the yellow part represents the dissolved out 2024.
Effect of thin electrolyte film thickness on the trimetallic galvanic corrosion
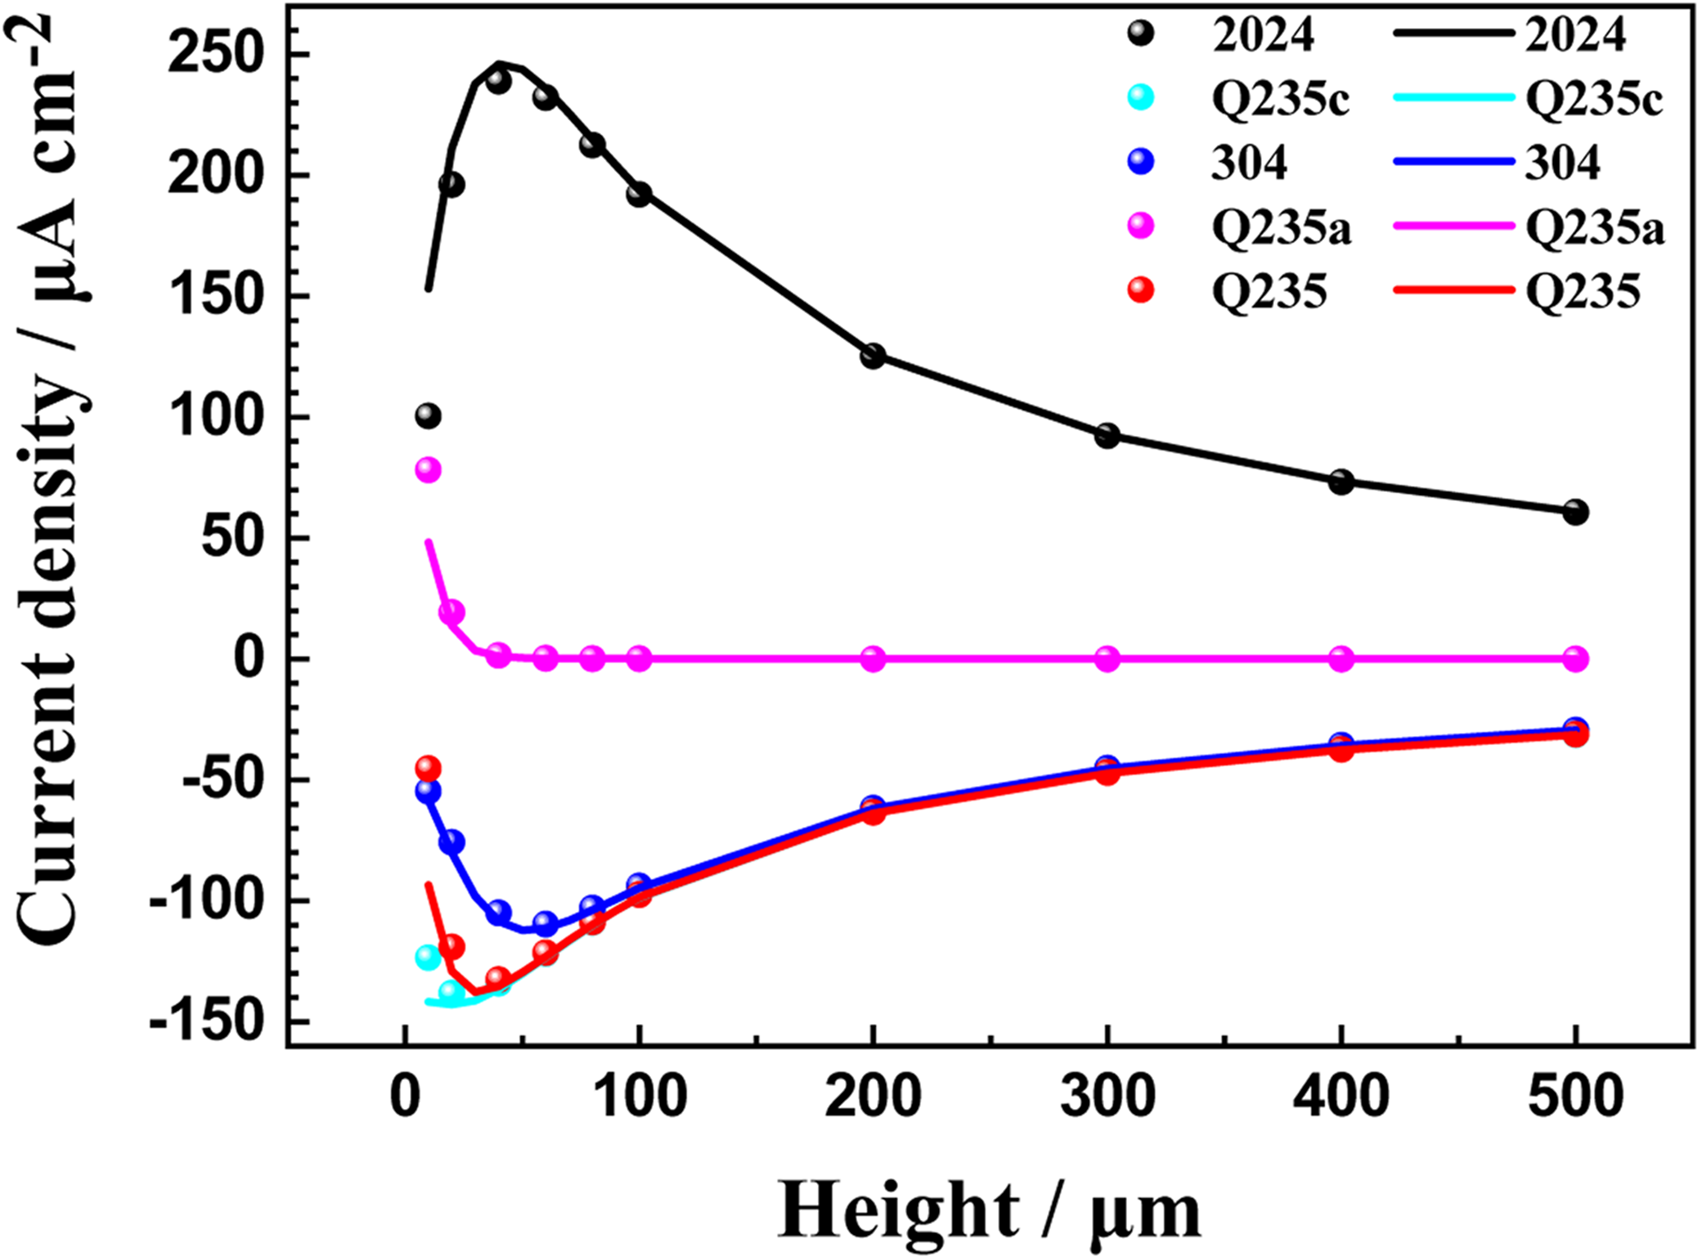
To validate the reliability of the model and investigate the effect of thin electrolyte film thickness on the trimetallic galvanic corrosion, the experimental results and simulation results (average current density) are compared in Figure 7. The galvanic current density both in experimental and simulation results first increases and then decreases with the decrease of electrolyte film thickness. The experimental results always fluctuate around the simulation results, indicating that the FEM model in this investigation is reliable for forecasting trimetallic galvanic corrosion under different thin electrolyte film thicknesses. The results show that 2024, Q235, and 304 reach the maximum current density at different thicknesses: 2024 reaches 240 μA cm-2 at 40 μm; Q235 reaches −137 μA cm-2 at 30 μm; 304 reaches −112 μA cm-2 at 50 μm. Notably, the cathodic current density of Q235 exceeds that of 304 when the thin electrolyte film thickness is decreased to less than 100 μm. Moreover, Q235 shows local anodic currents when the thin electrolyte film thickness is decreased to less than 20 μm.
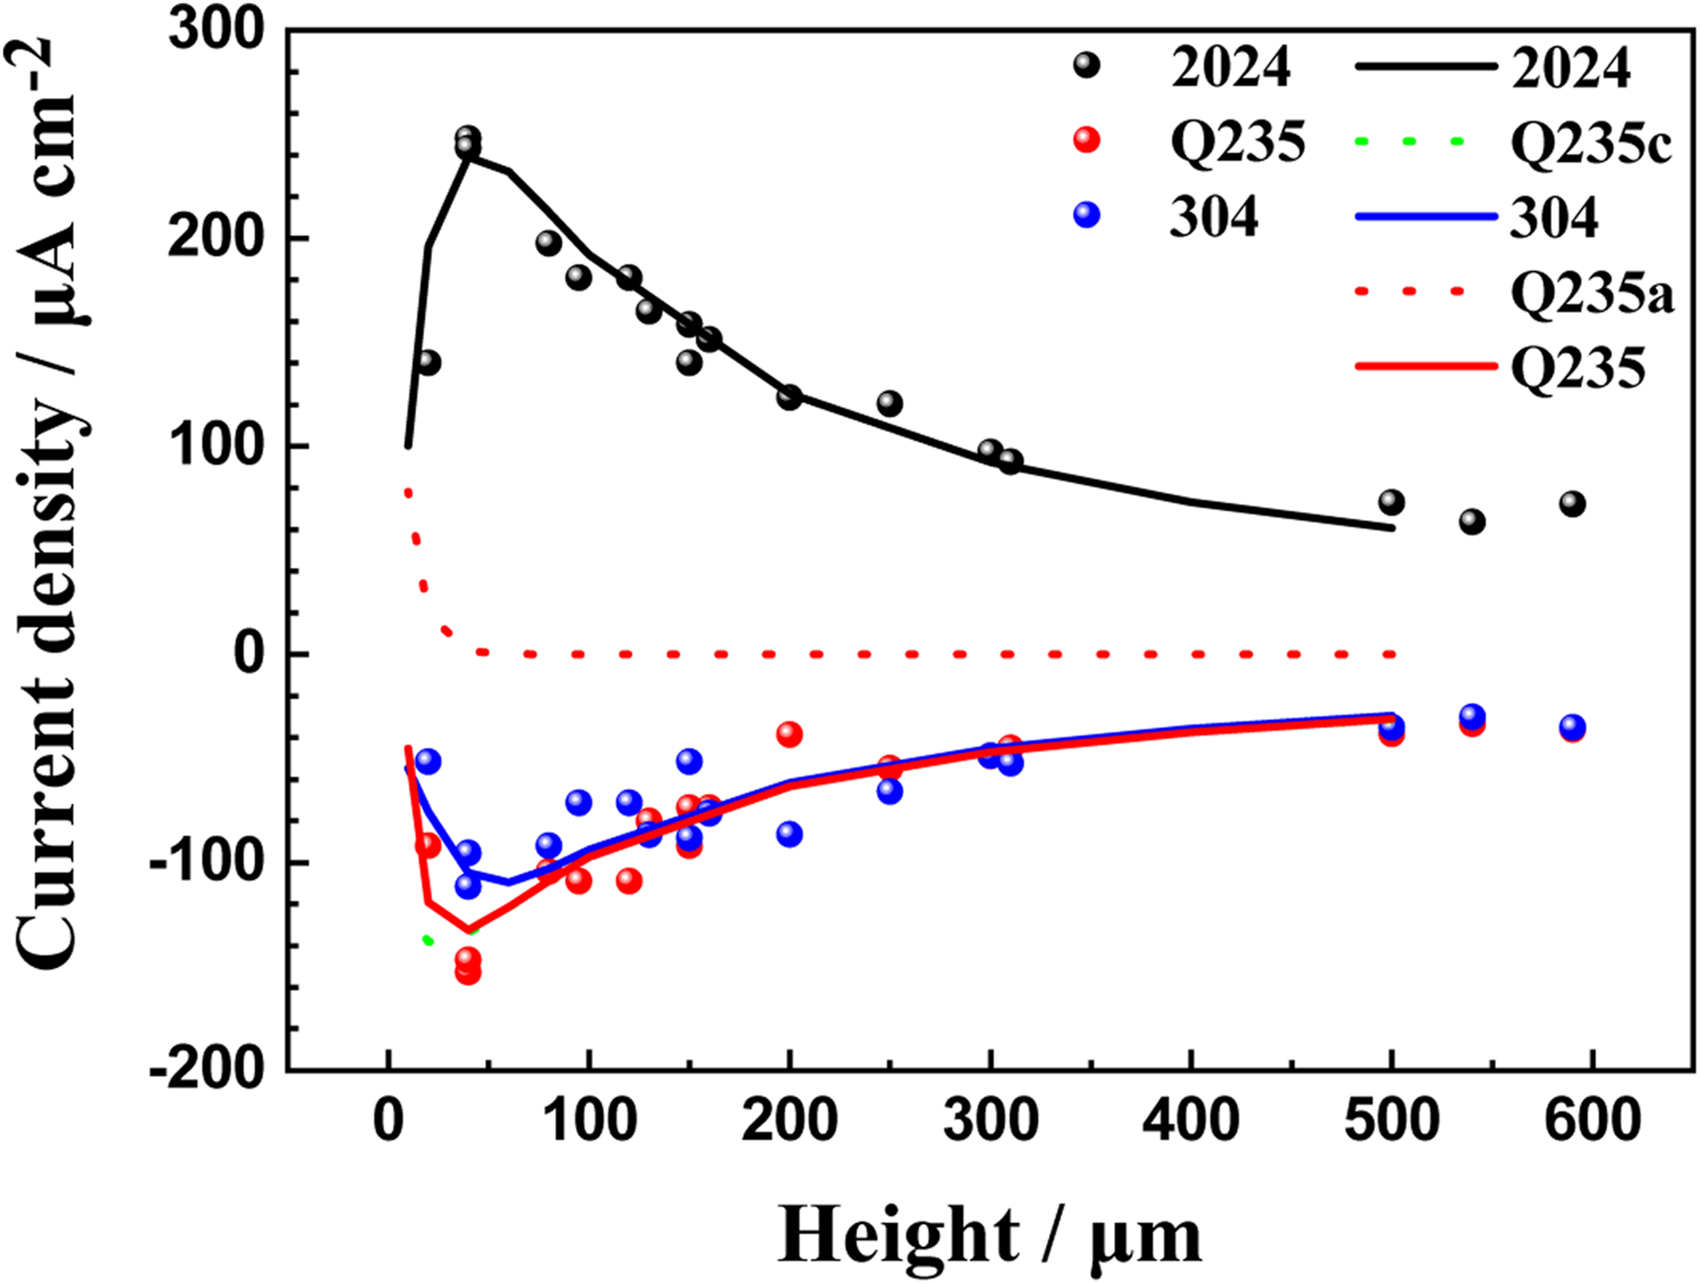
Experimental and simulation results of the variations of the average current density of 2024, Q235, and 304 after galvanic corrosion for 10 h under different thin electrolyte film thicknesses without considering the deposition of corrosion products: spheres are experimental results and lines are simulation results; Q235c represents the cathodic current density, Q235a represents the anodic current density, and Q235 represents the total current density.
In order to explore the kinetics of 2024/Q235/304 trimetallic galvanic corrosion under different thin electrolyte film thicknesses, the oxygen concentration distribution and the potential distribution are shown in Figures 8 and 9. With the decrease of thin electrolyte film thickness, the oxygen diffusion paths decrease and the oxygen reduction reaction is accelerated, resulting in the increase of galvanic current density (both of anodic and cathodic current density). It is easy to understand the increase of galvanic current density with the decrease of electrolyte film thicknesses when the electrolyte film is thick as shown in Figure 7. However, when the electrolyte film thickness is decreased to 40 μm, the residual maximum oxygen concentrations on Q235 and 304 increase gradually. With the further decrease of thin electrolyte film thickness, the residual maximum oxygen concentrations on Q235 and 304 increase continually, which means that the oxygen reduction reaction rate decreases, and the cathodic current density also decreases. The decrease in thin electrolyte film thickness can increase the IR drop, which decreases the oxygen reduction reaction rate on the surface of Q235 and 304. When the oxygen diffusion rate exceeds the oxygen reduction reaction rate, the oxygen diffusion is not the rate determining step, and the accumulation of oxygen can passive the metal to reduce the corrosion rate. Besides, the residual maximum oxygen concentration on Q235 is lower than that on 304, which means the oxygen reduction reaction on Q235 is faster than that on 304. It can be attributed to that the IR drop between 304 and 2024 is larger than that between Q235 and 2024. As a result, the oxygen reduction reaction rate on Q235 is higher than that on 304. These results are consistent with those shown in Figure 7.
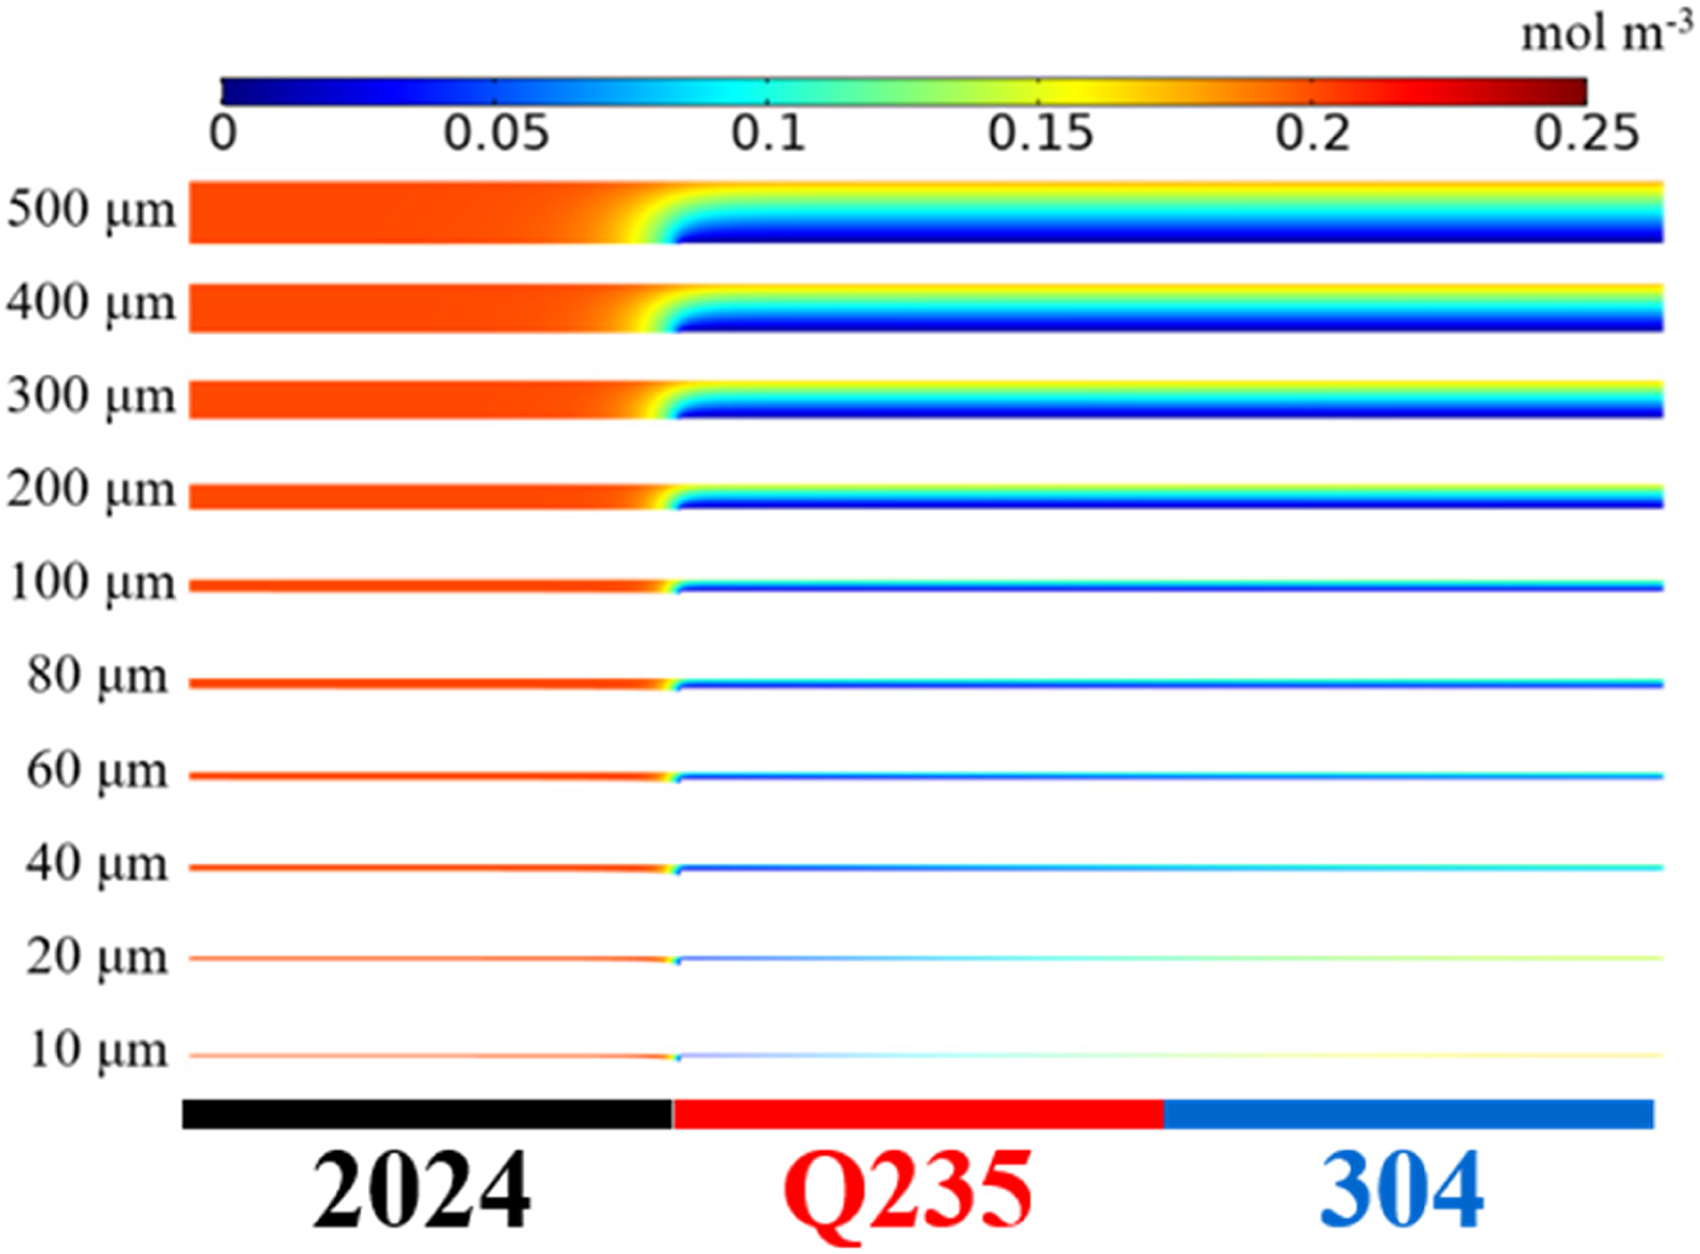
Simulation results of the distribution of oxygen concentrations on 2024, Q235, and 304 under different thin electrolyte film thicknesses without considering the deposition of corrosion products.
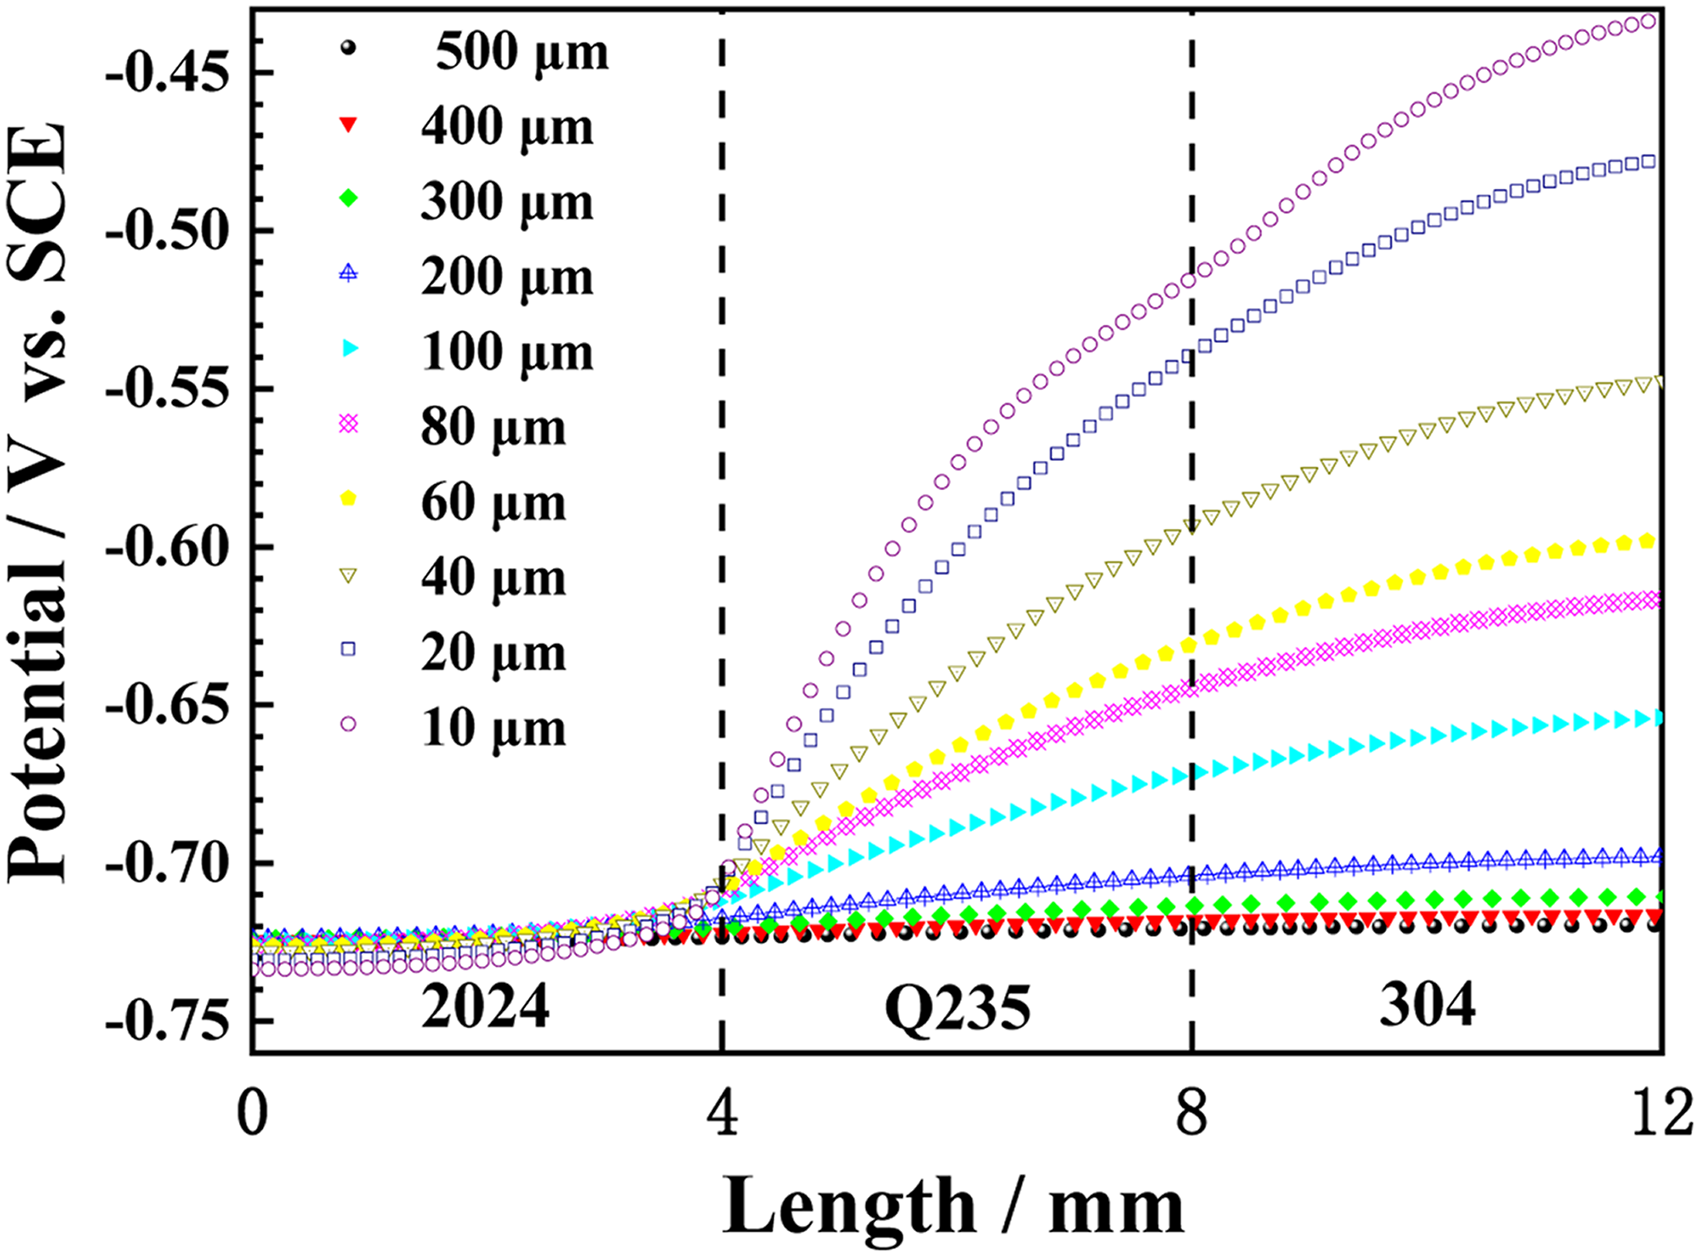
Simulation results of the potential distribution on 2024, Q235, and 304 under different thin electrolyte film thicknesses without considering the deposition of corrosion products.
In addition, it can be seen that the oxygen concentration on 2024 alloy is always the highest. Under galvanic coupling condition, 2024 is strongly anodically polarised, which suppresses the cathodic oxygen reduction reaction on its surface to a negligible level, and the oxygen on the 2024 surface is hardly consumed during galvanic corrosion. Meanwhile, the oxygen consumption by self-corrosion of 2024 is also minimal according to the polarisation curves in Figure 3, which 2024 suffers severe anodic polarisation under coupling potential and the dissolution reaction by self-corrosion can also be ignored. Therefore, oxygen is accumulated on the 2024 surface, showing the highest concentration.
In order to verify the effect of IR drop as mentioned above, the potential distributions of 2024, Q235, and 304 under different thin electrolyte film thicknesses are drawn in Figure 9. When the electrolyte film thickness is larger than 200 μm, there is almost no potential gradient on three electrodes and the potential distribution is relatively uniform, that is, the effect of solution resistance is slight. However, when the thin electrolyte film thickness is decreased to less than 100 μm, the potential distribution gradient increases gradually, and the effect of solution resistance is further enhanced. It can be understood by Ohm's law: the conductivity of 3.5 wt.% NaCl and the distance in x-axis (the electrode size) are constant. The distance in y-axis (the thin electrolyte film thickness) decreases with the decrease of the thin electrolyte film thickness, leading to an increase of solution resistance. The effect of IR drop can reduce the polarisation potential between anodes and cathodes, resulting in the decrease of anodic and cathodic reaction rates (current density).
Moreover, the largest difference between a bimetallic couple and a trimetallic couple is the existence of the metal with media potential in the trimetallic couple. For bimetallic couples, the IR drop cannot result in the transformation of the cathodic or anodic roles of the coupling metals, and both metals are suffering self-corrosion when the solution resistance is infinite. However, for 2024/Q235/304 trimetallic couple, the increase of the solution resistance can make the surface of Q235 suffering different polarisation states: the part close to 2024 is cathodically polarised, acting as cathodes, while the part close to 304 is anodically polarised, acting as anodes. This is the reason for the existence of local anodic current on the surface of Q235 when the thin electrolyte film thickness is decreased to less than 20 μm (Figure 7).
Generally, the variation of thin electrolyte film thicknesses mainly affects the oxygen diffusion path and the solution resistance. With the decrease of the thin electrolyte film thickness, the oxygen diffusion path decreases and the oxygen reduction reaction is enhanced, accelerating the galvanic corrosion; meanwhile, the ion transport channel in y-axis decreases and the solution resistance increases, inhibiting the galvanic corrosion. When the electrolyte films are thick, the decrease of oxygen diffusion path plays a dominant role. When the electrolyte films are thin, the IR drop of solution resistance plays a dominant role, resulting in the galvanic current density first increasing and then decreasing with the decrease of electrolyte film thicknesses.
Effect of corrosion product deposition on the trimetallic galvanic corrosion
In the course of experiment, some white corrosion products can be observed on the surface of 2024. In theory, the concentrations of Al3+ and OH− in the electrolyte will increase as the galvanic corrosion proceeding, resulting in the increase of the concentration of Al(OH)3(aq). The concentration distributions of Al(OH)3(aq) under different electrolyte film thicknesses are compared in Figure 10. The images of 500 μm, 1000 s and 500 μm, 36000 s are used to analyse the variation of Al(OH)3 concentration distribution at the same electrolyte film thickness but at different corrosion durations, while the images of 500 μm, 36000 s, and 200 μm, 36000 s are used to analyse the variation of Al(OH)3 concentration distribution at the same corrosion durations but under different electrolyte film thicknesses. For the electrolyte film thickness of 500 μm, Al(OH)3(aq) is formed at the junction between 2024 and Q235, and then gradually diffuses to other sites in the electrolyte. With prolonging galvanic corrosion time from 1000 s to 36000 s, the maximum concentration of Al(OH)3(aq) increases from 4 × 10⁻¹² mol m−3 to 8 × 10⁻⁶ mol m−3. Moreover, the maximum concentration increases to 1 × 10⁻² mol m−3 in the electrolyte film thickness of 200 μm after galvanic corrosion for 36000 s, which is four order of magnitudes larger than the saturated concentration of Al(OH)3(aq), 1 × 10⁻⁶ mol m−3. It should be emphasised that although the colour visual for 500 μm, 36000 s and 200 μm, 36000 s is similar, the concentration ranges of both conditions are different, which indicates that the distribution law of Al(OH)3 concentrations on both conditions is similar, but the concentration values are different.
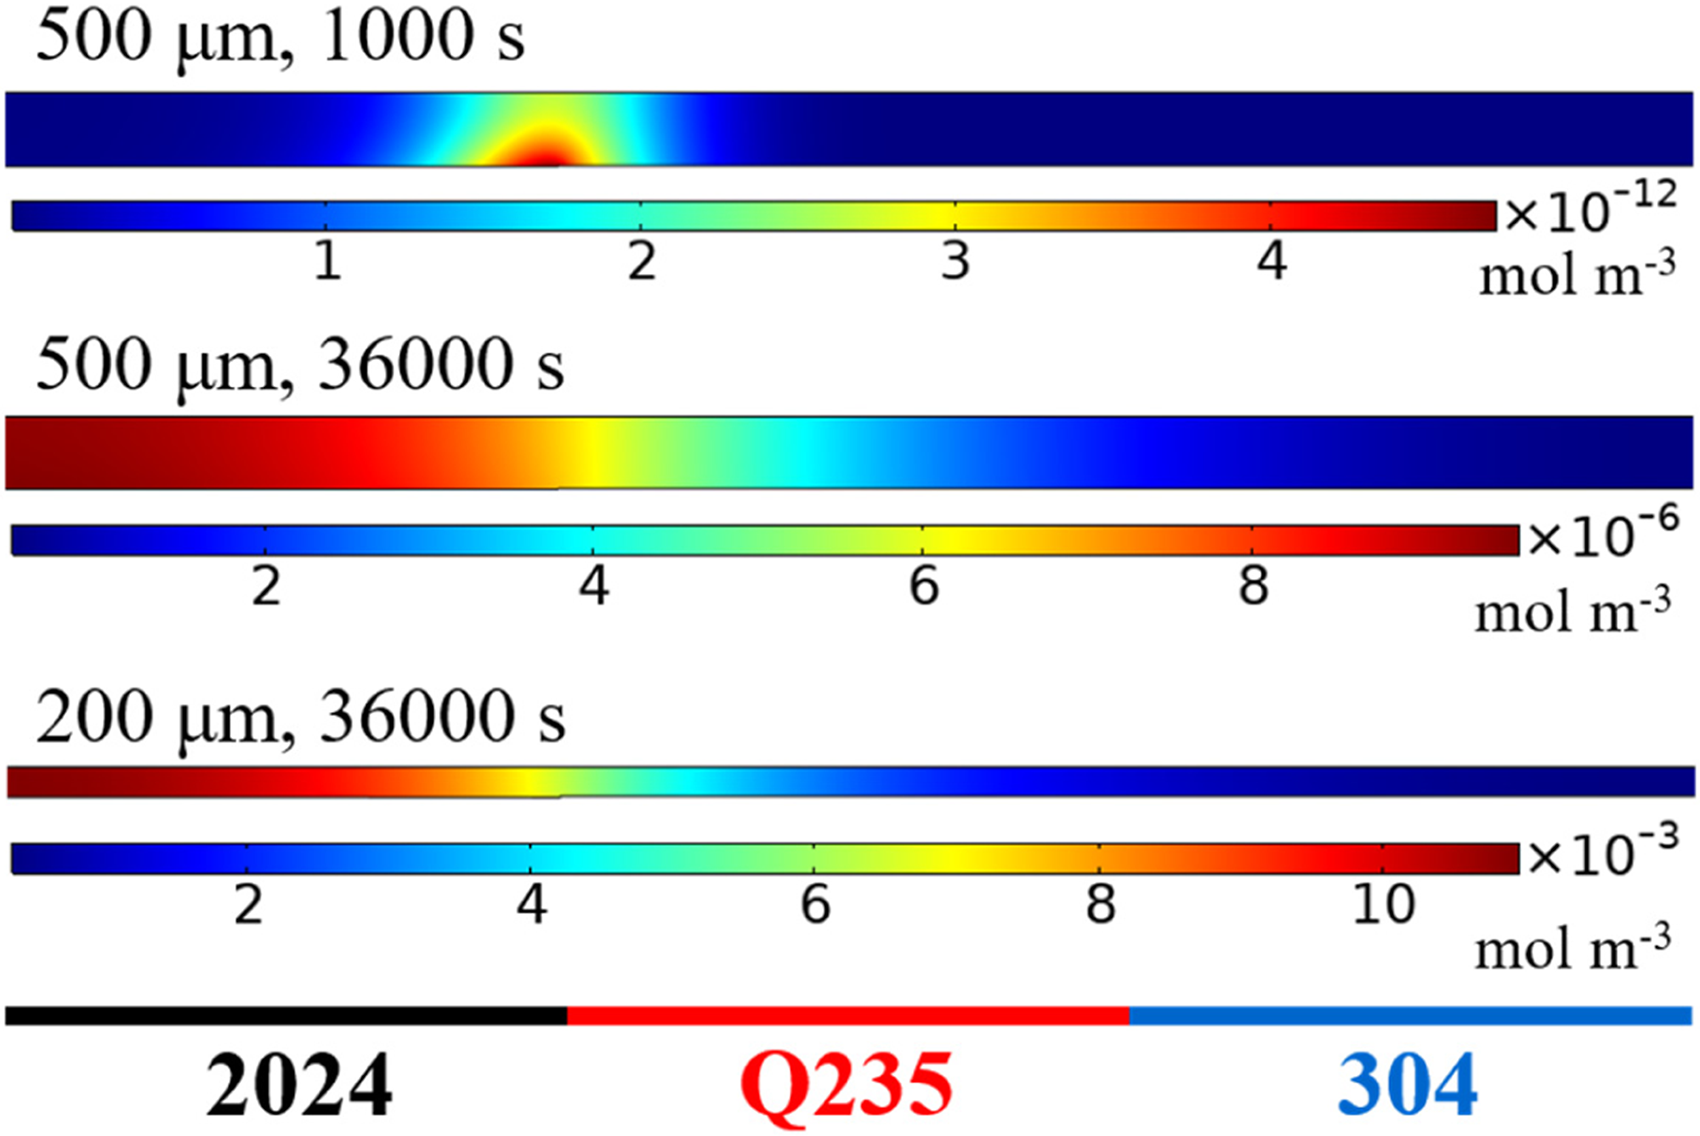
Simulation results of the concentration distributions of Al(OH)3 on 2024, Q235, and 304 under different thin electrolyte film thicknesses without considering the deposition of corrosion products, and the Al(OH)3 is not the solid phase.
The average concentrations of Al(OH)3(aq) after galvanic corrosion for 10 h under different thin electrolyte film thicknesses are plotted in Figure 11. It should be noted that the average concentrations of Al(OH)3 refer to the average values of the concentrations in the whole thin electrolyte film. It can be observed that the concentration of Al(OH)3(aq) is low when the electrolyte film is thick, and the effect of corrosion product deposition on the galvanic corrosion is weak. However, when the electrolyte film thickness is decreased to less than 100 μm, the concentration of Al(OH)3(aq) increases sharply, and the maximum value reaches 620 mol m−3, which far exceeds the saturated concentration of Al(OH)3(aq). Al(OH)3(aq) will nucleate and grow to form Al(OH)3(s), and then deposited on the surface of electrodes to affect the mass transfer and the surface activity of electrodes.
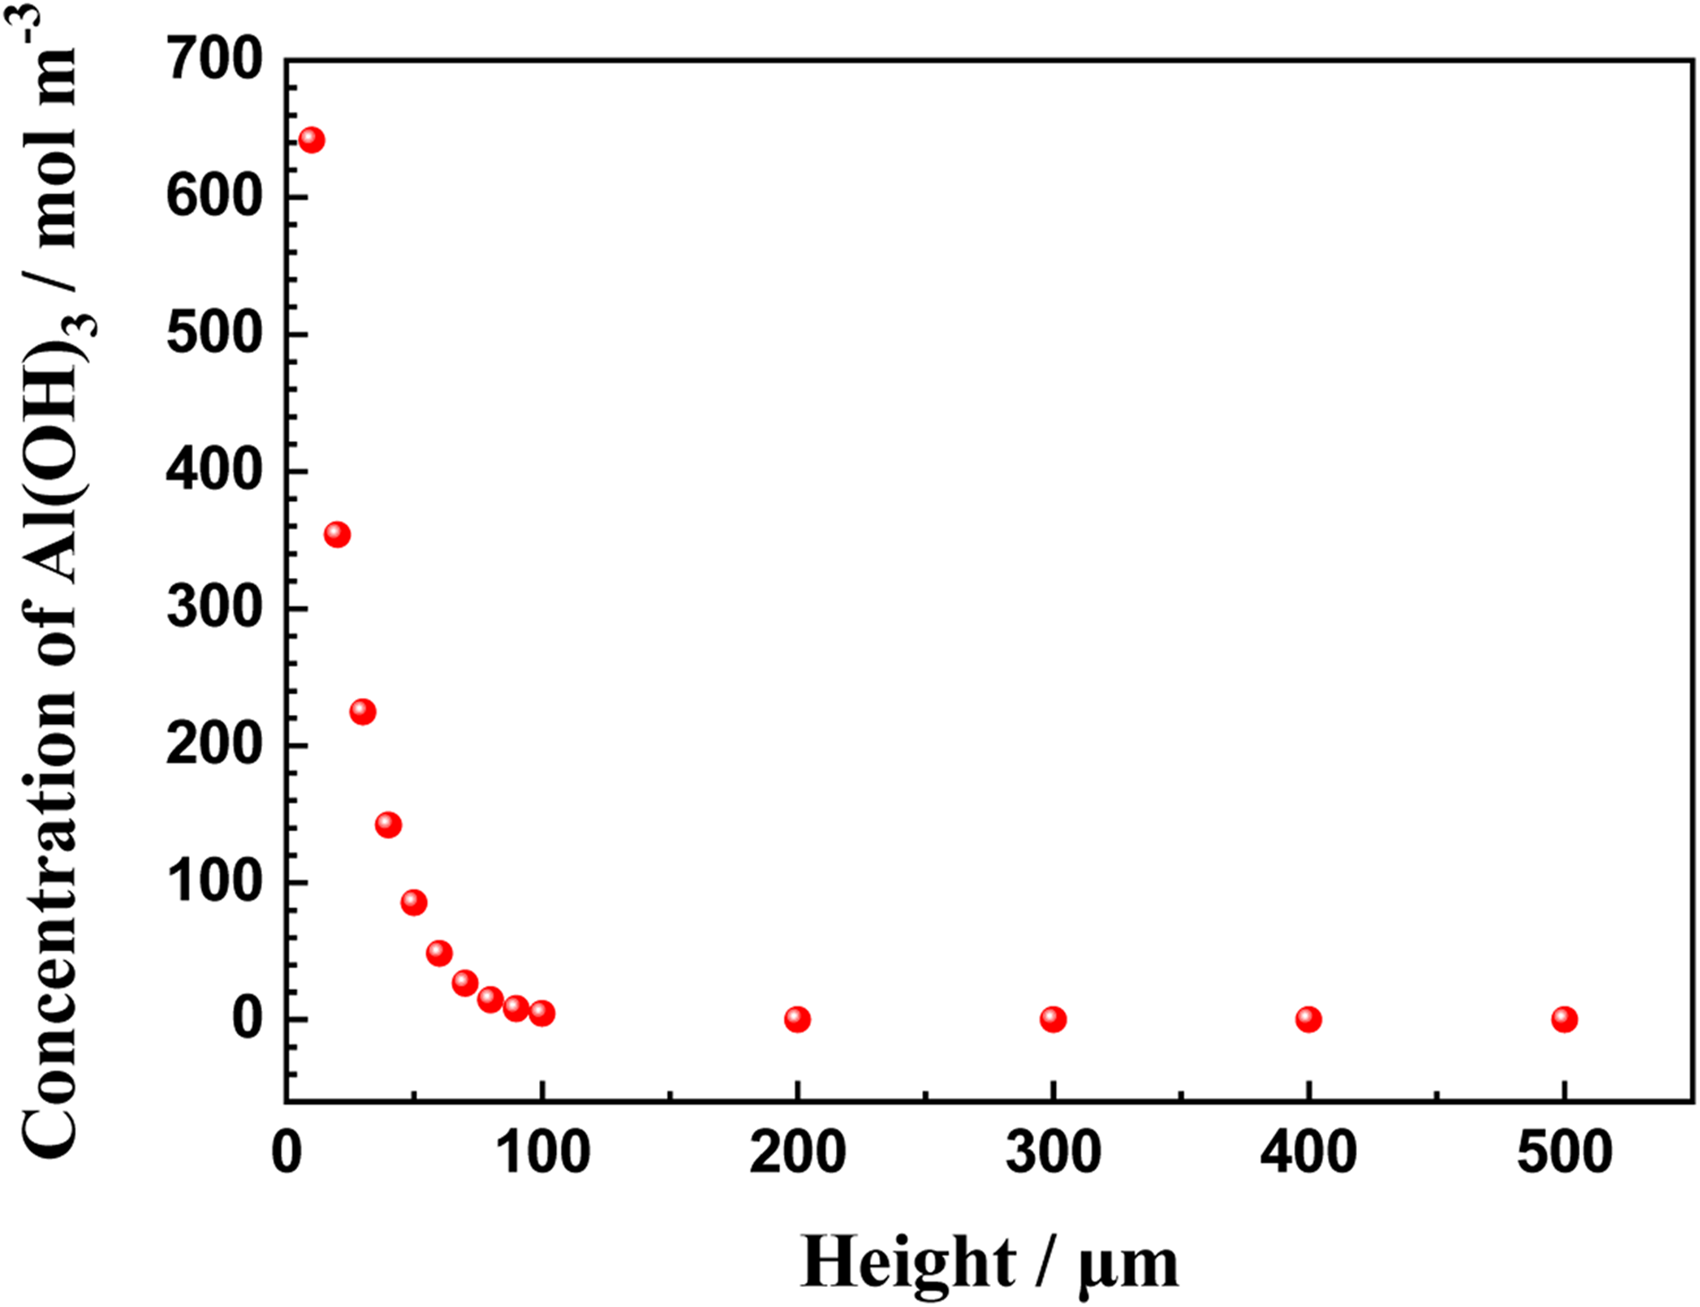
Simulation results of the variations of the average concentrations of Al(oh)3 on 2024 under different thin electrolyte film thicknesses after galvanic corrosion for 10 h without considering the deposition of corrosion products. Average concentrations of Al(OH)3 refer to the average values of the concentrations in the whole thin electrolyte film.
The concentration of Al(OH)3(aq) depends not only on the degree of galvanic corrosion but also on the thin electrolyte film thickness. In theory, the more severe the galvanic corrosion is, the higher the concentration of Al(OH)3(aq) is formed in the electrolyte. Thus, it is speculated that the variation trend of the average Al(OH)3(aq) concentrations with the thin electrolyte film thicknesses should be consistent with the galvanic corrosion degree. However, the average concentrations of Al(OH)3(aq) increase constantly with the decrease of thin electrolyte film thickness rather than increasing first and then decreasing. Although the amount of Al(OH)3(aq) linearly depends on the galvanic corrosion degree and increases first and then decreases with the thin electrolyte film thickness, the volume of the electrolyte decreases as well with the decrease of the thin electrolyte film thickness, resulting in an increase in concentrations. Thus, the average concentrations of Al(OH)3(aq) increase constantly with the decrease in the thin electrolyte film thickness. It is known that the electrolyte film is thinner, the more corrosion products are deposited, which is in agreement with the actual atmospheric corrosion condition.
In order to describe the effect of corrosion products on the trimetallic galvanic corrosion, the average current density of 2024, Q235, and 304 in the model considering corrosion products (spheres) and without corrosion products (lines) are compared in Figure 12. Because the galvanic current varies dynamically with galvanic corrosion process, the average current values of every metal within 10 h galvanic corrosion are used. It can be found that the current density with and without corrosion products is almost the same when the electrolyte film is thick. However, when the thin electrolyte film thickness is decreased to less than 100 μm, the current density in model with corrosion products is smaller than that without corrosion products, and the difference increases with the decrease of the thin electrolyte film thickness. This is consistent with the results deduced from Figure 11. When the thin electrolyte film thickness is decreased to less than 100 μm, the concentrations of Al(OH)3(aq) sharply increase. Correspondingly, the deposition amount of corrosion products promotes. With the further decrease of the thin electrolyte film thickness, the concentrations of Al(OH)3(aq) further increase together with the further increase of the deposited corrosion products. The inhibiting effect of corrosion products on the corrosion process increases significantly. 40
Simulation results of the variations of the average current density of 2024, Q235, and 304 after galvanic corrosion for 10 h under different thin electrolyte film thicknesses: spheres are simulation results with corrosion products and lines are simulation results without corrosion products; Q235c represents the cathodic current density, Q235a represents the anodic current density, and Q235 represents the total current density.
To observe the corrosion dissolution and deposition of corrosion products, the profiles of 2024/Q235 junction after galvanic corrosion for 10 h under different thin electrolyte film thicknesses are drawn in Figure 13. The blue region represents the liquid phase (electrolyte), the black line is the initial boundary, and the red region represents the solid phase (corrosion products). When the electrolyte film thickness is 500 μm (Figure 13(a)), the dissolution depth of 2024 is only 1 μm, and there is almost no corrosion product deposited on the electrode surface. When the thickness is 200 μm (Figure 13(b)), the dissolution depth of 2024 is 3 μm, and some corrosion products can be observed on the surface of 2024. When the thickness decreases to 80 μm (Figure 13(c)), the dissolution depths in different areas of 2024 are different: dissolution depth close to Q235 is about 20 μm and far from Q235 is about 17 μm. The thickness of corrosion product increases significantly and is almost deposited on the whole surface of 2024. When the thickness is further decreased to 20 μm (Figure 13(d)), the dissolution depth close to Q235 reaches about 45 μm and far from Q235 is about 35 μm, and the whole surface of 2024 is covered with corrosion products.
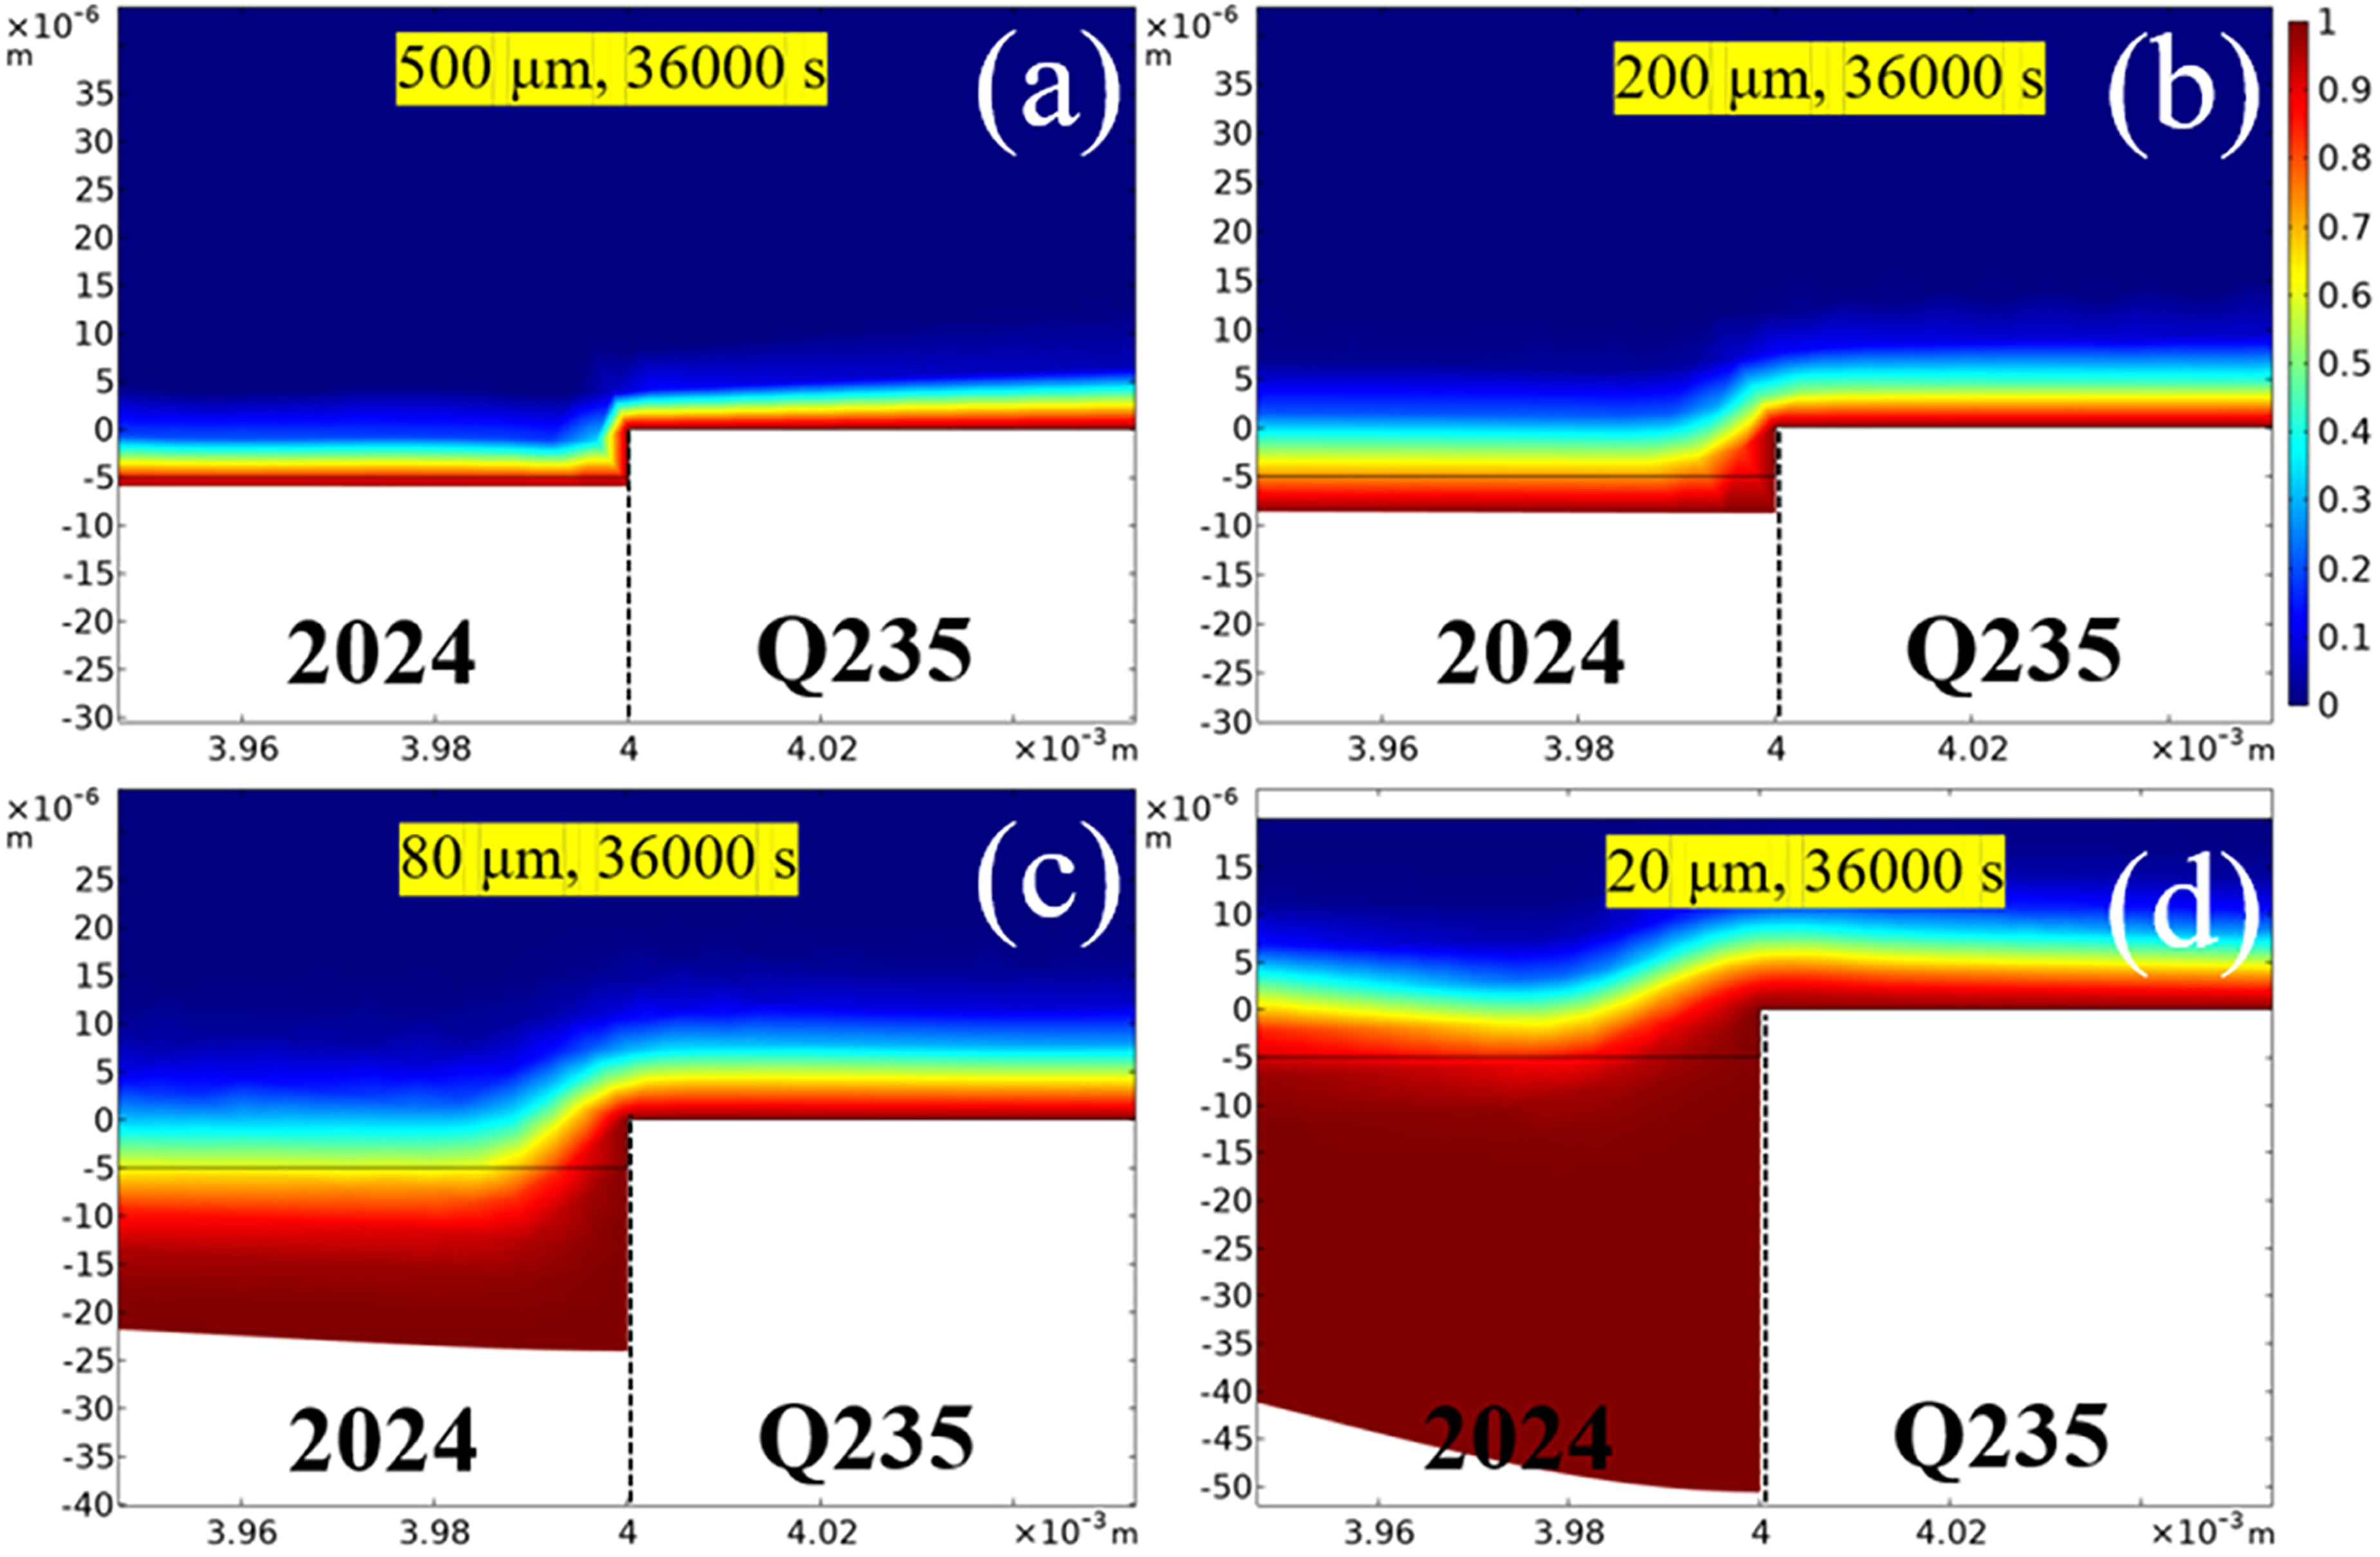
Simulation results of the corrosion dissolution and corrosion product deposition on 2024 after galvanic corrosion for 10 h under different thin electrolyte film thicknesses: the black solid line represents the initial surface of 2024, the red part represents the solid phase of corrosion products, and the blue part represents the liquid phase of electrolyte.
In general, the deposition of corrosion product depends on the galvanic corrosion degree and thin electrolyte film thickness, that is, the more serious the galvanic corrosion is, the more the amount of Al(OH)3(aq) is. Meanwhile, the thinner the electrolyte film is, the higher the concentration of Al(OH)3(aq) is. The deposited Al(OH)₃ layer may physically hinder the transport of oxygen to the cathode surfaces, further suppressing the oxygen reduction reaction and inhibiting the galvanic corrosion, especially under very thin electrolyte films.
The influence factor of edge effect
It can be seen from Figure 6 that the corrosion of 2024 presents obvious edge effect, that is, 2024 is corroded more severe in the region near to Q235 than that far from Q235 when the electrolyte film is thin. Moreover, the edge effect in the model considering corrosion product deposition (Figure 13) is more serious than that without considering corrosion product deposition (Figure 6) when the thin electrolyte film thickness is 20 μm. The work of Deshpande 23 shows the similar result: the edge effect in experimental result (with corrosion product) is more serious than that in simulation result (without corrosion products), but further explanation was not given.
To clarify the reason, the current density distributions after galvanic corrosion for 10 h under different thin electrolyte film thicknesses in model with and without corrosion products are compared in Figure 14. Figure 14(a) shows the current density distributions on the three metals with considering the deposition of corrosion products. It can be found that the current density on 304 is distributed uniformly, but there is an obvious edge effect on the junction between 2024 and Q235. When the thicknesses of thin electrolyte film are larger than 300 μm, the current distribution on the surface of 2024 is relatively uniform, and the current density differences between different positions are small. When the thin electrolyte film thickness is decreased to less than 200 μm, the current density at the junction between 2024 and Q235 shows significant edge effect, that is, the maximum current density is approximately 301 μA cm−2, while the minimum current density is approximately 75 μA cm−2 for 2024. With the further decrease of the thin electrolyte film thickness, the edge effect is further enhanced. It is obvious that the corrosion current density at the junction between 2024 and Q235 gradually increases.
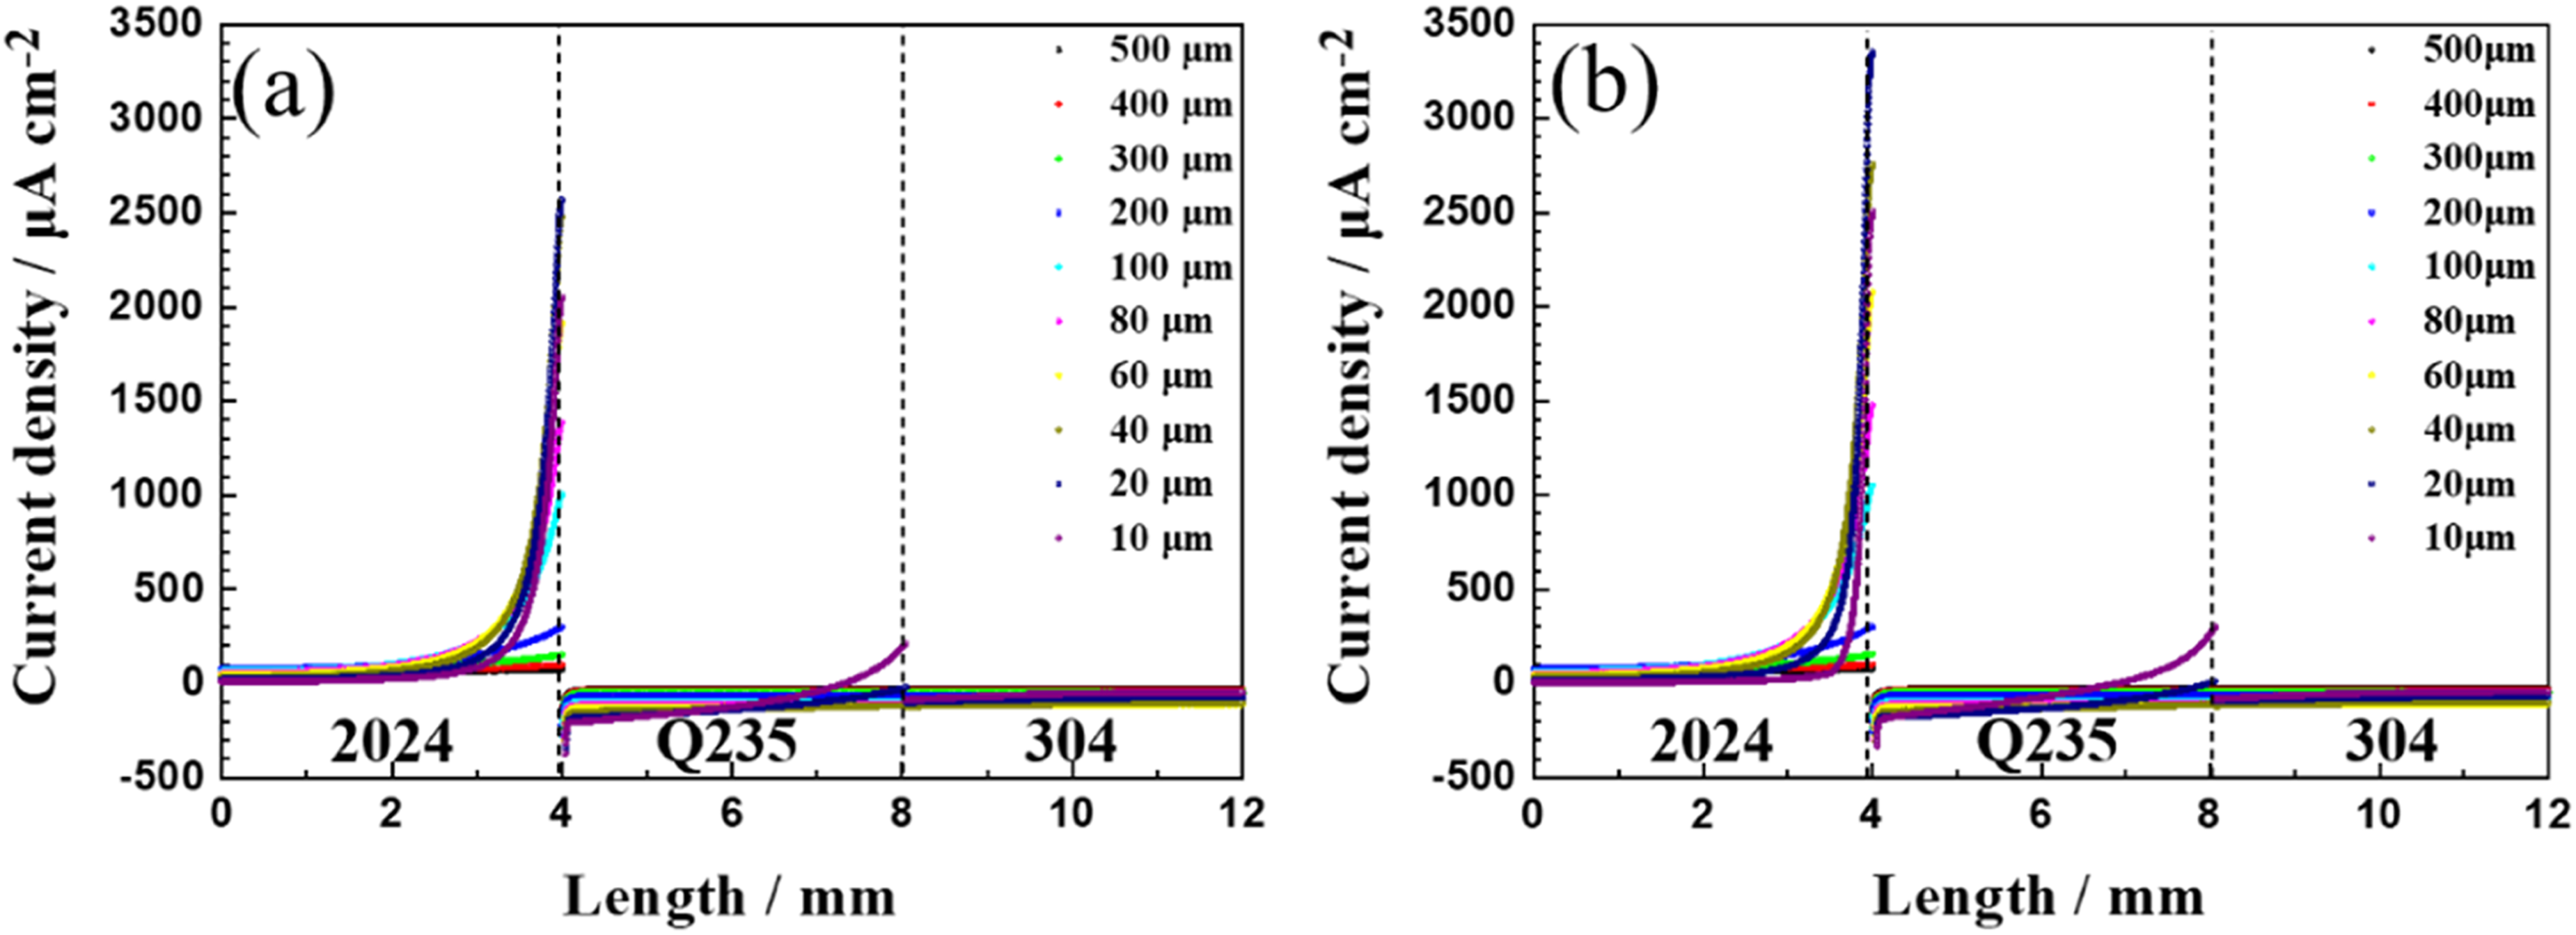
Simulation results of the current density distributions on 2024, Q235, and 304 under different thin electrolyte film thicknesses: (a) without corrosion product deposition; (b) with corrosion product deposition.
As for Q235, it can be visually observed that when the thin electrolyte film thicknesses are larger than 20 μm, whole Q235 acts as a cathode. When the thin electrolyte film thickness is decreased to 20 μm, the side of Q235 close to 304 presents anodic currents and acts as an anode, whereas the side of Q235 close to 2024 presents cathodic currents and acts as a cathode. This phenomenon can be associated with the increase of solution resistance due to the reduction of electrolyte film thickness, which results in the variation of polarisation effects at different positions of the three metal couples. The Q235 near to 304 electrode suffers an anodic polarisation with a more positive potential than its own, thereby exhibiting an anodic current.
In the model without corrosion products (Figure 14(a)), the edge effect of 2024 depends on the exposed areas of Q235 and the solution resistance during galvanic corrosion. The more severe 2024 is corroded, the larger the exposed areas of Q235 are, resulting in the increase of the current density at the junction between 2024 and Q235. Moreover, the solution resistance increases with decreasing the thin electrolyte film thickness, resulting in the accelerated corrosion of the 2024 near to Q235 due to the shortest distance. In the model with corrosion products (Figure 14(b)), the edge effect of 2024 at the junction between 2024 and Q235 is further increased, and the highest current density can reach approximately 3400 μA cm−2, which is much higher than the situation without corrosion products (approximately 2600 μA cm−2). The continuous deposition of corrosion products will block the transportation of corrosive medium, and the polarisation effect is mainly concentrated at the junction between 2024 and Q235. As a result, the side of 2024 near to Q235 is severely accelerated corrosion, displaying the enhancement of edge effect.
As for the edge effect of Q235, it can be found that the current density distribution is relatively uniform, and only the cathodic current density of Q235 at the junction between 2024 and Q235 is slightly high. It is obvious that the edge effect on Q235 is weak in comparison with 2024. On the one hand, with the decrease in thin electrolyte film thickness, the corrosion of 2024 is accelerated, and the actual exposed area of Q235 at the junction region increases, resulting in a decrease in the corresponding cathodic current density. On the other hand, the cathodic reaction on Q235 surface is primarily determined by oxygen concentrations, and the reduction in thin electrolyte film thickness facilitates oxygen diffusion, accelerating the cathodic reaction rate and thereby increasing the cathodic current density. The coupling of both factors results in a weak edge effect on Q235. However, due to the short distance at the junction between 2024 and Q235, which facilitates ion transport, resulting in a slight high cathodic current density in this region. Regarding the influence of corrosion products on the edge effect on the Q235 side, Figure 13 shows that the corrosion products are mainly deposited on the surface of 2024, and a small amount of corrosion products on Q235 has little effect on its surface activity. As a result, the effect of corrosion products on the edge effect of Q235 can be ignored.
The effect of the electrode size
In this part, the effect of electrode sizes on trimetallic galvanic corrosion was investigated by comparing the galvanic corrosion of 2024/Q235/304 trimetallic couples with different electrode sizes (1 mm∼10 mm) under different thin electrolyte film thicknesses.
The potential distributions of 2024/Q235/304 trimetallic couples with different electrode sizes after galvanic corrosion for 10 h under different thin electrolyte film thicknesses are shown in Figure 15. It can be observed that the potential distribution gradient on the electrode surface always increases with the decrease of the thin electrolyte film thickness. However, the obvious potential gradient (≥ 30 mV) appears in different thicknesses, and the maximum potential gradient is different when the electrode sizes are different. When the electrode size is 1 mm, an obvious potential gradient appears in the thin electrolyte film thickness of 20 μm, and the maximum potential gradient is approximately 87 mV. When the electrode size is 2 mm, the obvious potential gradient appears in 60 μm, and the maximum potential gradient is approximately 200 mV. When the electrode size is 3 mm, the obvious potential gradient appears in 100 μm, and the maximum potential gradient is approximately 260 mV. When the electrode size is 5 mm, the obvious potential gradient appears in 200 μm, and the maximum potential gradient is approximately 280 mV. When the electrode size is 10 mm, the obvious potential gradient appears in 400 μm, and the maximum potential gradient is approximately 430 mV. In general, with the increase of the electrode sizes, the obvious potential gradient appears in the thicker electrolyte film, and the maximum potential gradient increases, that is, the increase of electrode sizes would enhance the IR drop of the solution resistance.
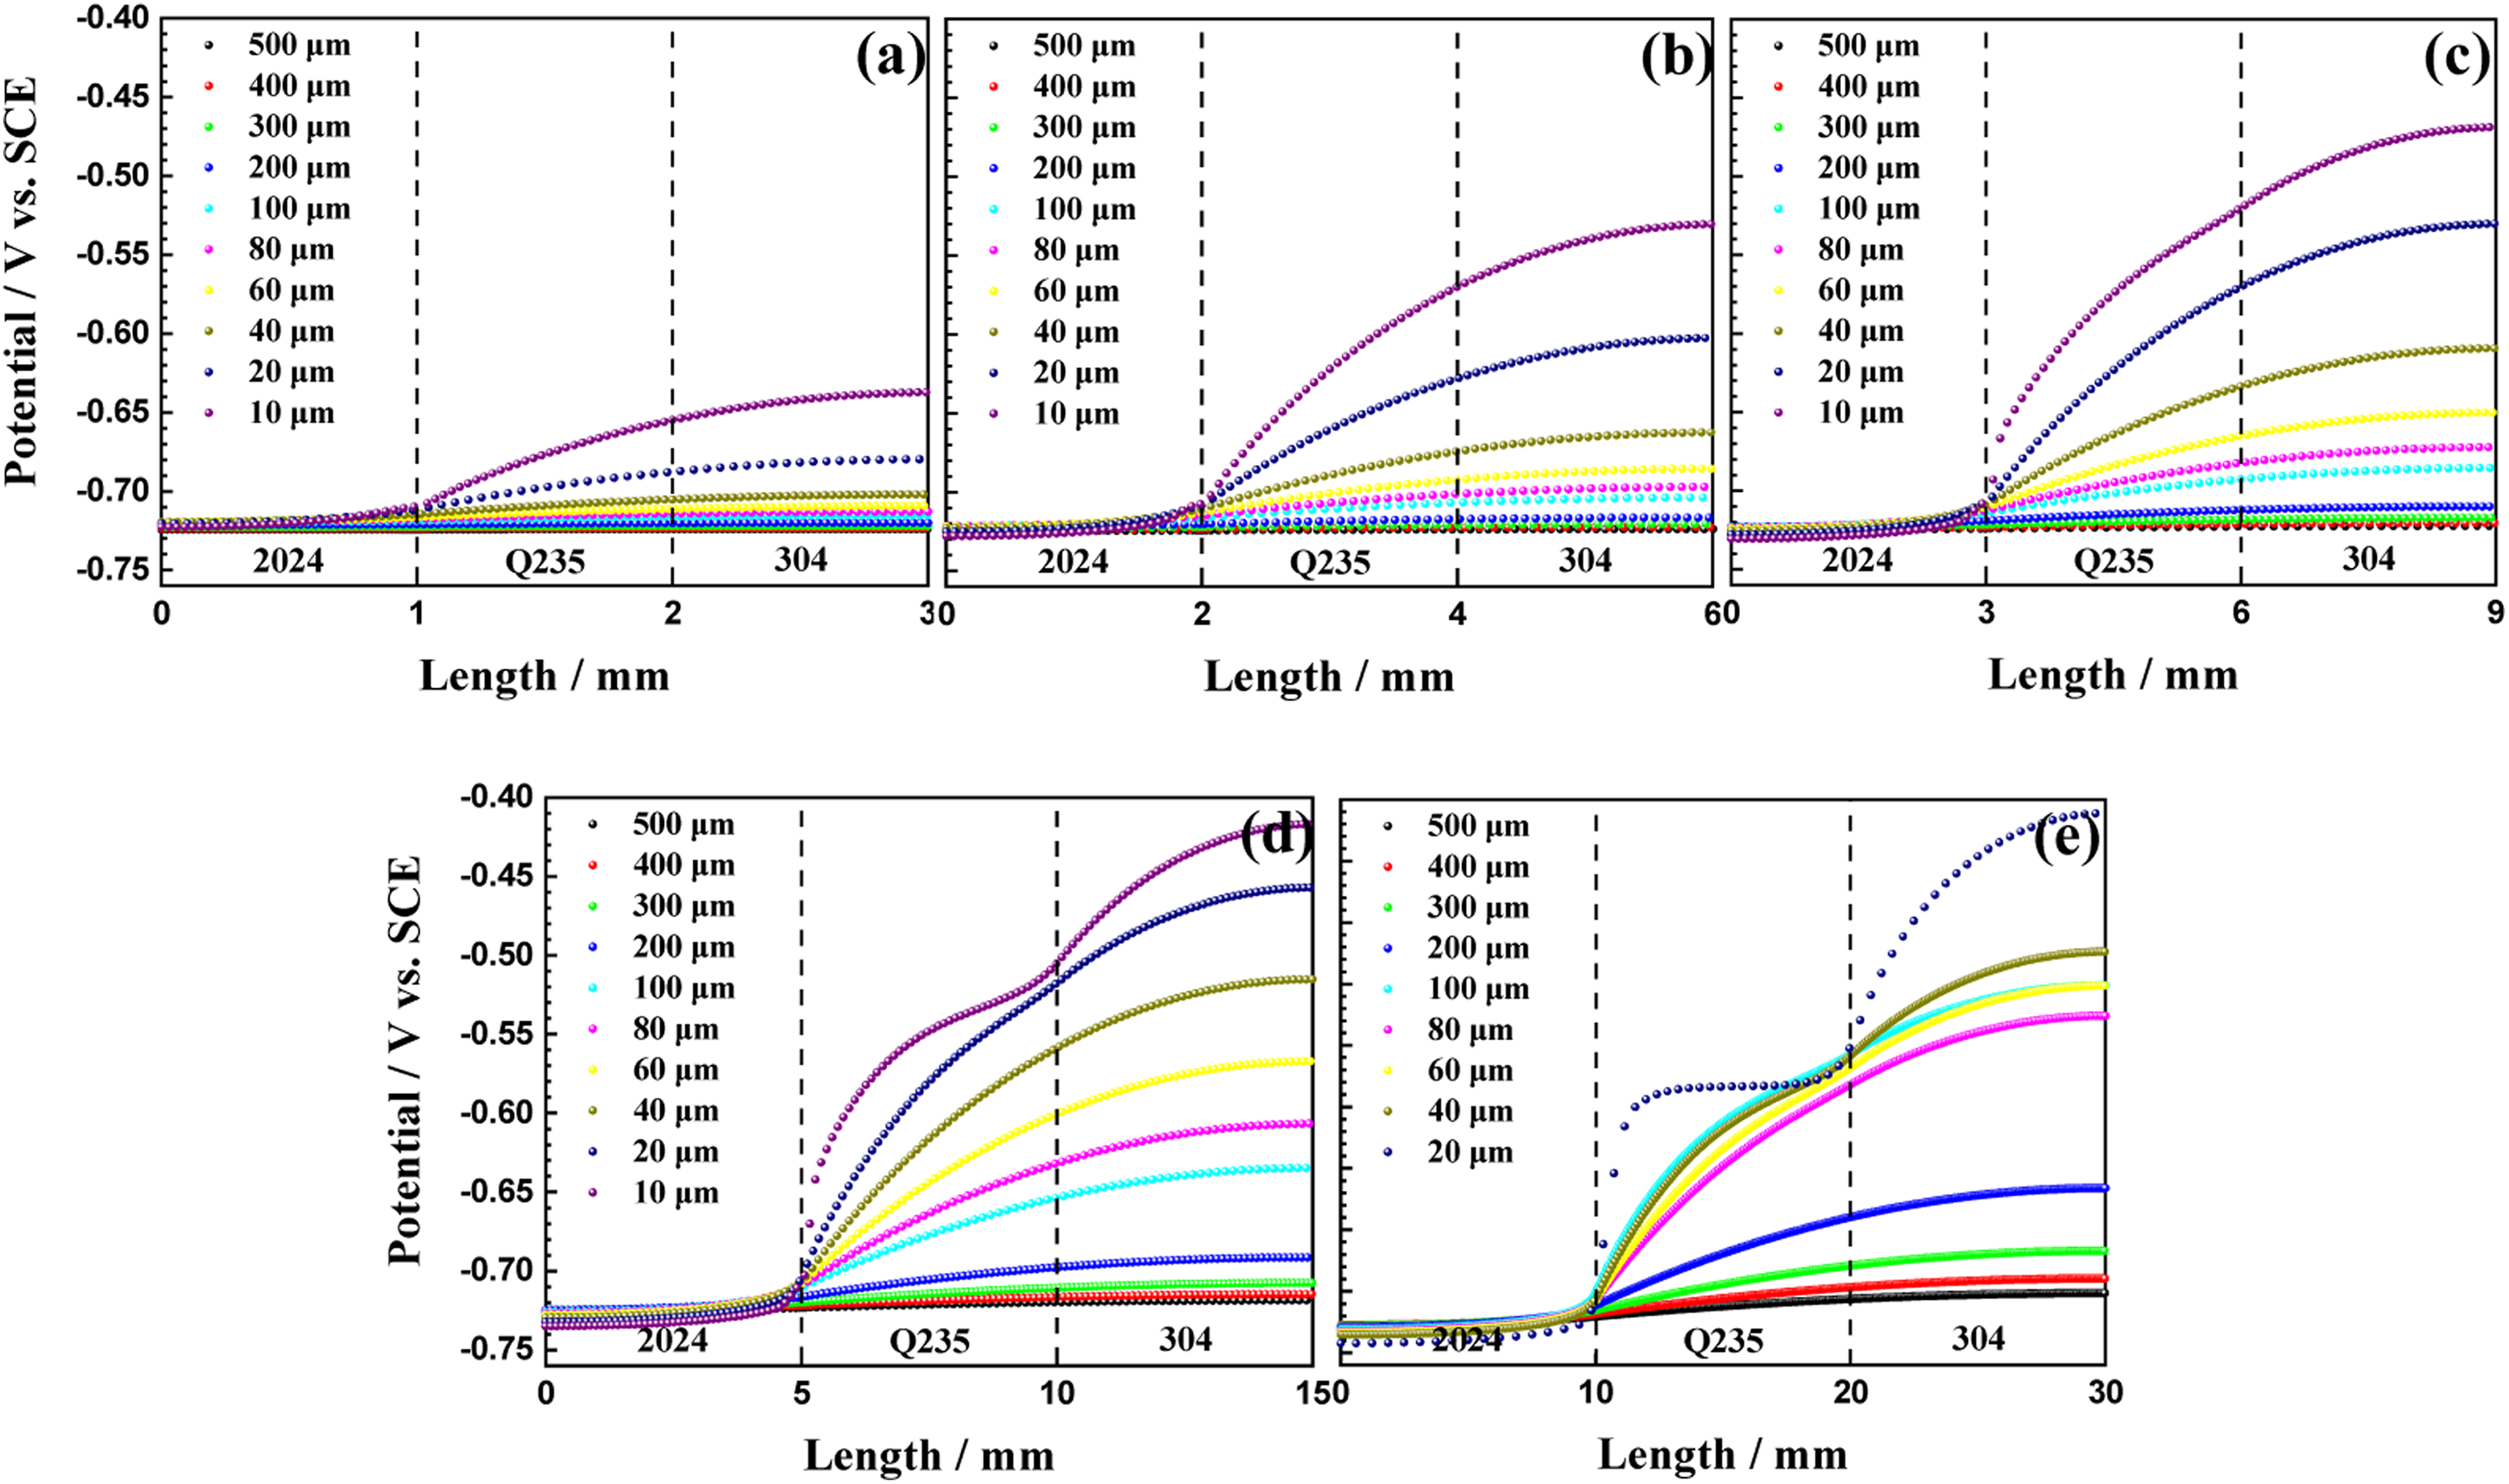
Simulation results of the potential distribution on trimetallic couples with different electrode sizes under different thin electrolyte film thicknesses: (a) 1 mm; (b) 2 mm; (c) 3 mm; (d) 5 mm; (e) 10 mm.
The average current density of 2024/Q235/304 trimetallic couples with different electrode sizes after galvanic corrosion for 10 h under different thin electrolyte film thicknesses is shown in Figure 16. When the electrode size is 1 mm, the current density constantly increases with the decrease of the thin electrolyte film thickness instead of the trend of first increase and then decrease as shown in Figure 9. Q235 does not present anodic current as well, and the cathodic current density of Q235 and 304 is always almost the same except for the thickness of 10 μm. It means that when the electrode size is less than or equal to 1 mm, the effect of the solution resistance is tiny, and the galvanic corrosion is controlled by the decrease of oxygen diffusion path, resulting in the constant increase of the galvanic current density.
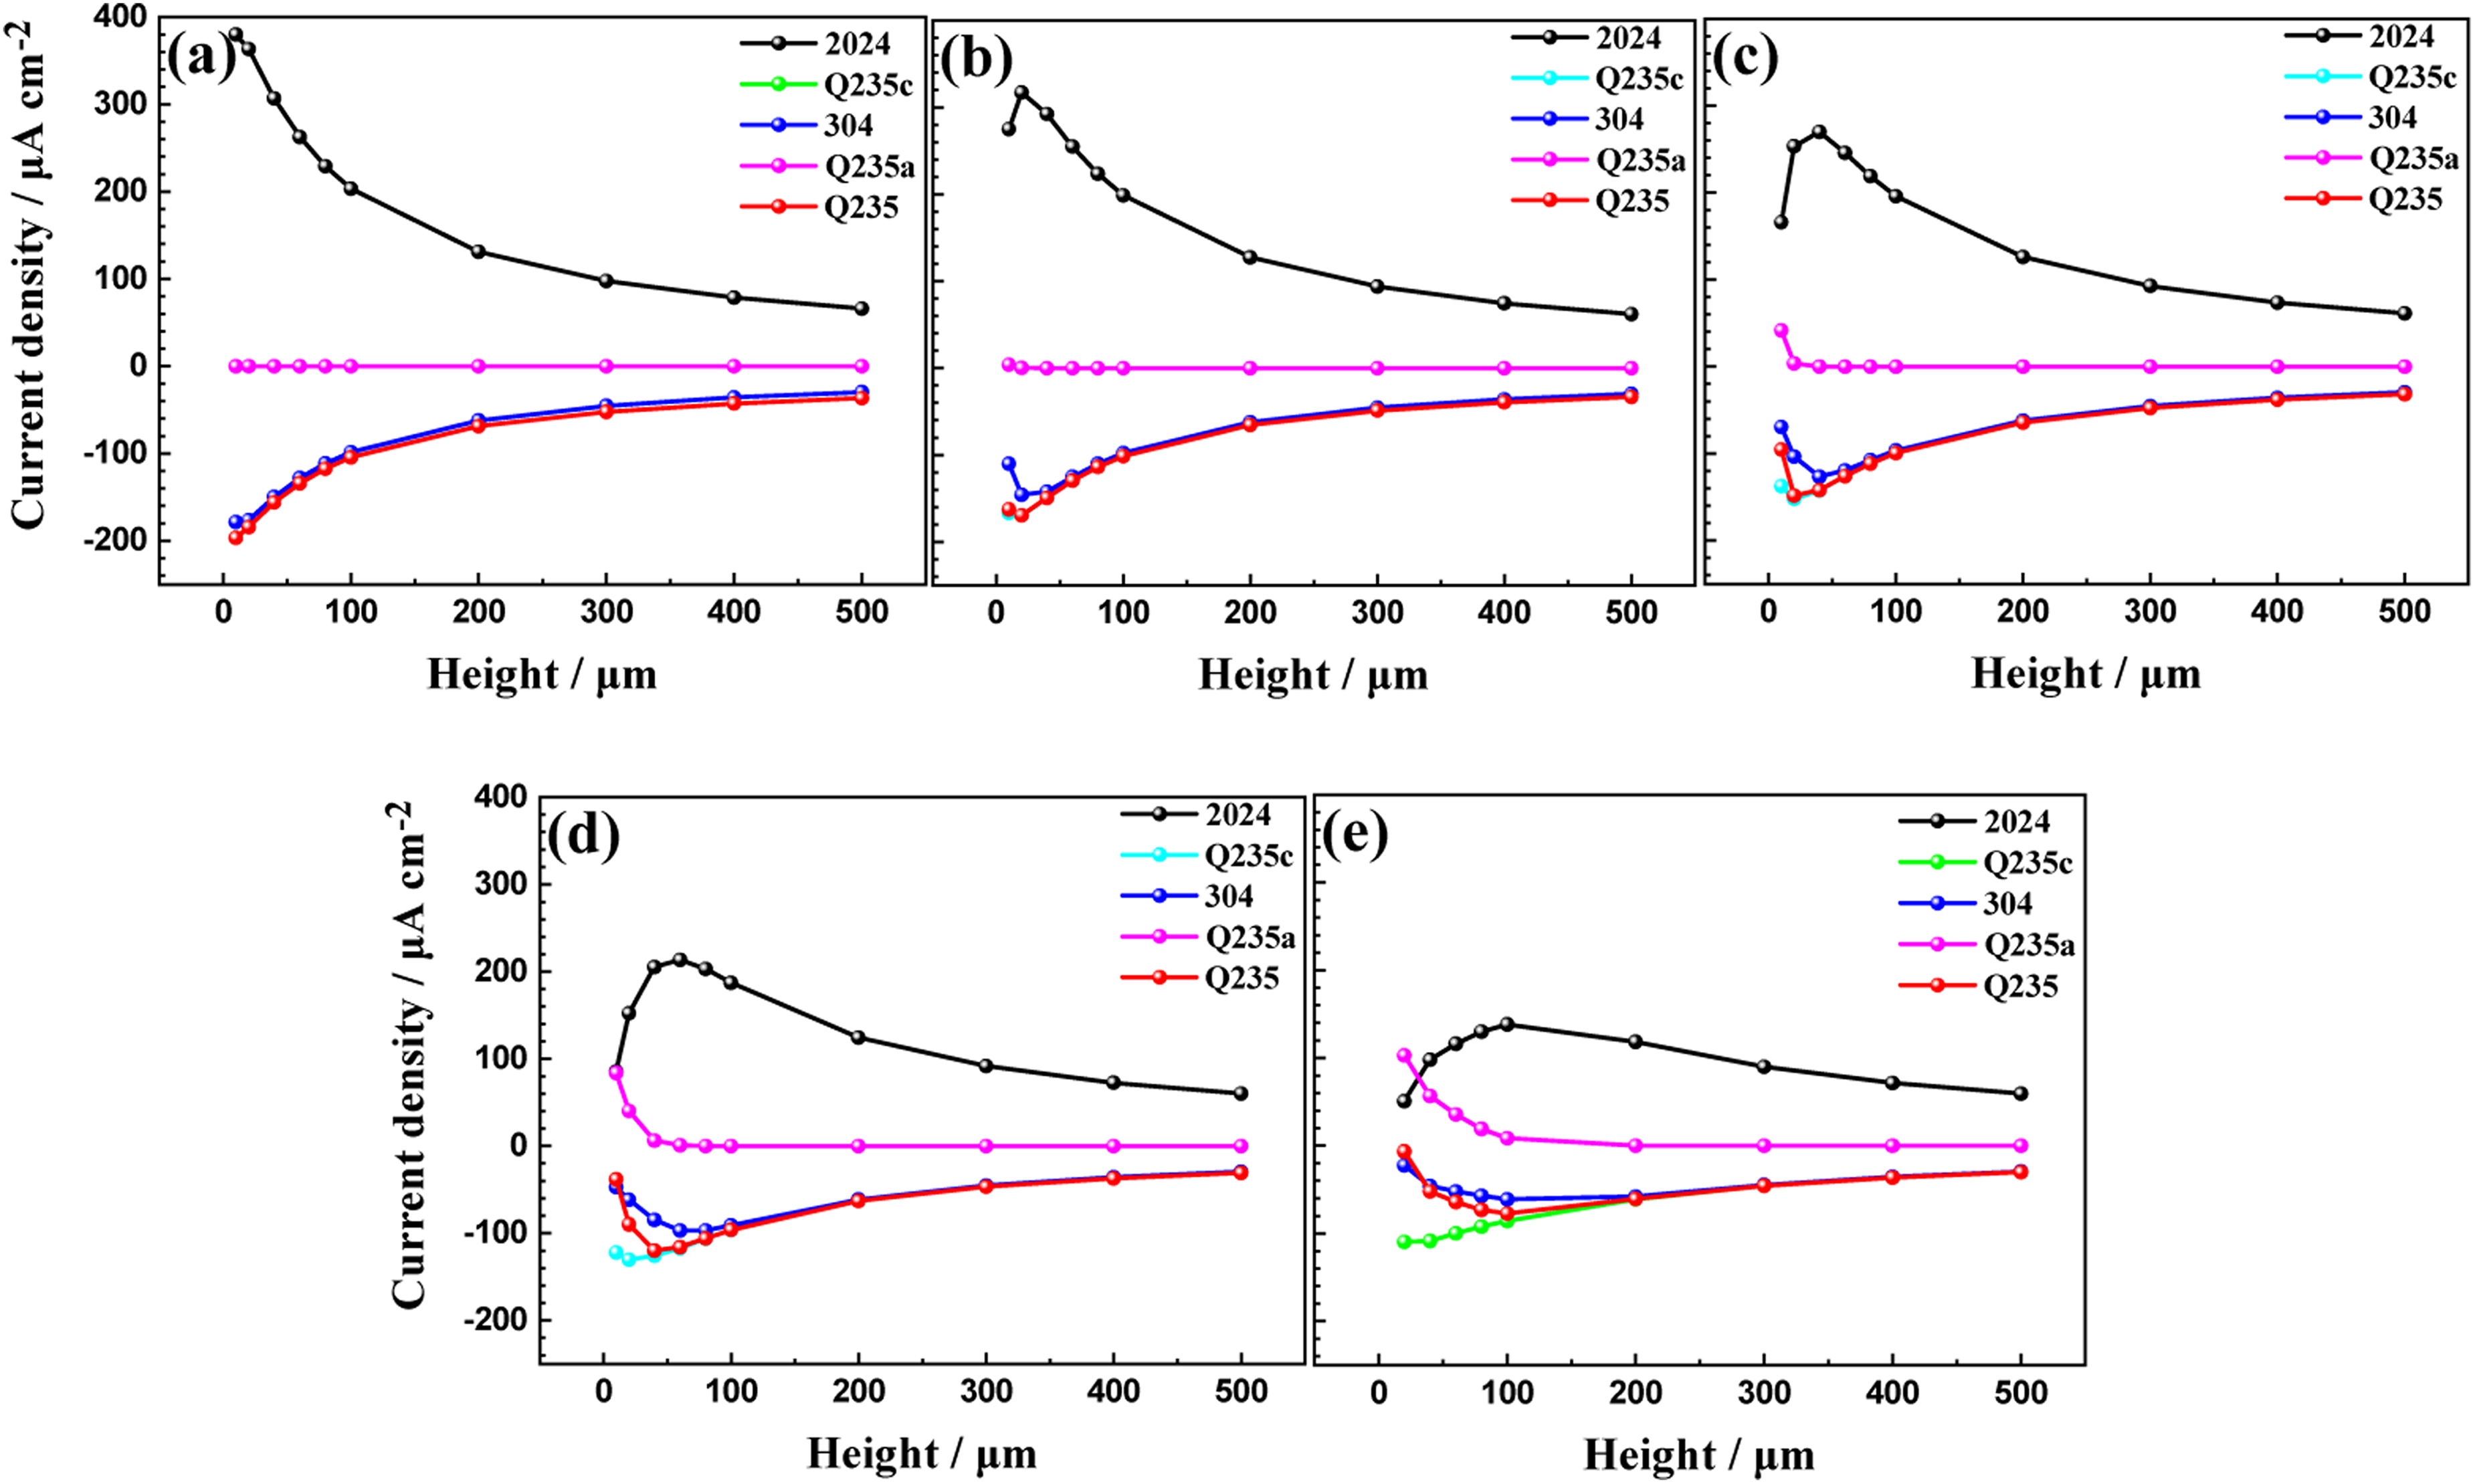
Simulation results of the variations of the average current density of trimetallic couples with different electrode sizes under different thin electrolyte film thicknesses: (a) 1 mm; (b) 2 mm; (c) 3 mm; (d) 5 mm; (e) 10 mm. Q235c represents the cathodic current density, Q235a represents the anodic current density, and Q235 represents the total current density.
With the increase of electrode sizes (2 mm, 3 mm, 4 mm, 5 mm, and 10 mm), the IR drop of the solution resistance increases and gradually becomes the dominant role, resulting in the first increase and then decrease trend of galvanic current density with the increase of electrode sizes. The maximum current density appears at a thick electrolyte film, the cathodic current density of Q235 exceeds that of 304, anodic currents present on the surface of Q235 at a thick electrolyte film and the maximum anodic current density increases as well.
The limitation of this work
In this paper, a static electrolyte film is assumed. However, in the actual atmosphere environment, the thickness of thin electrolyte film will change dynamically due to the evaporation process as the temperature rises and the humidity decreases. Deconinck et al.30,32,41,42 simulated the dynamic changes of the oxygen reduction reaction during the evaporation process of the thin electrolyte film, and the control steps of the oxygen reduction reaction under different thin electrolyte film thicknesses was clarified, and the relationship between the electrolyte concentrations, ion diffusion and electrical migration was disclosed, but the reaction processes on multiple electrodes during the trimetallic galvanic corrosion process were not mentioned. As the thin electrolyte film evaporates, the concentrations of NaCl increase, which leads to changes in the saturated oxygen concentration, diffusion coefficient, and conductivity of the electrolyte, and thereby affects the galvanic corrosion process. The limitation of this work is based on a static electrolyte film, and the evaporation process is not considered. The predicted trends may deviate from the actual atmospheric environment to some degree. However, based on these results, it is helpful to understanding the complex trimetallic galvanic corrosion process under different thin electrolyte film thicknesses.
Conclusion
In this work, a FEM model of trimetallic galvanic corrosion under a thin electrolyte film was built and validated with systematical considering the mass transfer, deformation of anodes, and deposition of corrosion products.
(1) The variations of the electrolyte film thickness mainly affect the oxygen diffusion path and solution resistance. When the electrolyte film is thick, the change of oxygen diffusion path becomes a dominant factor, and galvanic current density increases with the decrease of electrolyte film thickness. When the electrolyte film is thin, the change of solution resistance becomes a dominant factor, and galvanic current density decreases with the decrease of electrolyte film thickness. Moreover, the IR drop of solution resistance can result in Q235 presenting different cathode/anode roles at its different locations in the 2024/Q235/304 trimetallic couple. (2) Both the increase of Al(OH)3(aq) amount and the decrease of electrolyte film thickness result in the increase of the Al(OH)3(aq) concentrations and the deposition of corrosion product Al(OH)3(s). On the one hand, the deposition of corrosion products inhibits the galvanic corrosion on the whole; on the other hand, it aggravates the edge effect at the junction between 2024 and Q235. (3) With the increase of the electrode size, the effect of the solution resistance is enhanced, resulting in the decrease of the average current density but the increase of the maximum local anodic current density. (4) This work is based on a static electrolyte film. Actually, the thin electrolyte film thickness will change dynamically due to the evaporation process. The increase of NaCl concentration can lead to the change of saturated oxygen concentration and electrolyte conductivity, affecting the galvanic corrosion process. Although the predicted trend in this work may deviate from the actual atmospheric environment to some degree, it is helpful to understanding the complex trimetallic galvanic corrosion under different electrolyte film thicknesses.
Footnotes
Funding
The authors disclosed receipt of the following financial support for the research, authorship, and/or publication of this article: This work was supported by the National Natural Science Foundation of China, Strategic Priority Research Program of the Chinese Academy of Sciences, (grant numbers: 52371082 and XDB1210303).
Declaration of conflicting interests
The authors declared no potential conflicts of interest with respect to the research, authorship, and/or publication of this article.
Data availability statement
The data that support the findings of this study are available from the corresponding author upon reasonable request.