
Abstract
The study focuses on the effects of liquefaction on structures taken from data on about 1000 private residential masonry buildings located in several municipalities struck by the 2012 Emilia earthquake. Survey data were collected by teams of experts coordinated by the Italian Department of Civil Protection in the immediate post-earthquake emergency phase. They included information on building characteristics and the level and extent of the damage to structural and non-structural components. Furthermore, according to data related to the reconstruction process, information on the liquefaction-induced type and extent of the damage was also collected. Through a comparative analysis of the empirical damage, it was found that liquefaction strongly affected the buildings, confirming its relevance in the damage scenario under specific subsoil conditions. Based on this evidence, the article proposes a correlation between structural damage and liquefaction when it comes to deriving proper preliminary empirical fragility curves. A suitable parameter to define liquefaction effects at ground level is introduced and correlated to damage grades defined according to the European Macroseismic Scale: EMS-98.
Introduction
Liquefaction may become a major source of seismic risk for structures and infrastructures when loose and saturated sandy soil layers are shallow enough to affect the behavior of buildings via loss of bearing capacity, potential for lateral spreading, liquefaction-induced settlements. Severe structural damage induced by liquefaction has occurred over time during the earthquakes in Anchorage (USA, 1964), Niigata (Japan, 1964), Kobe (Japan, 1995), Kocaeli (Turkey, 1999), Christchurch (New Zealand, 2010–2011), Emilia-Romagna (Italy, 2012) and, more recently, Hualien (Taiwan, 2018) and Palu (Indonesia, 2018). The effects of liquefaction on the buildings in these areas were catastrophic, with rotations of entire structural complexes leading to a loss of functionality and operative state (Chiaradonna et al., 2019; Cubrinovski, 2013; Fioravante et al., 2013; Tokimatsu et al., 1996; Yoshida et al., 2001). Consequently, a great effort was made to understand building movements on shallow foundations using centrifuge testing and numerical modeling (Adamidis and Madabhushi, 2018; Allmond et al., 2015; Balakrishnan and Kutter, 1999; Bouckovalas et al., 2015; Bray and Dashti, 2014; Hayden et al., 2015; Hughes and Madabhushi, 2019; Karamitros et al., 2013; Kutter et al., 2004). In detail, Dashti and Bray (2013) individualized possible liquefaction-induced displacement mechanisms in three different typologies: (a) volumetric strains caused by water flow in response to transient gradients, (b) partial bearing failure due to soil softening, and (c) soil–structure–interaction-induced building ratcheting during earthquake loading. Nevertheless, most of the research was devoted to soil–structure–interaction studies on individual buildings, and these are strictly dependent on the specific case under study, for example, the type of structure and foundation system (Luque and Bray, 2017). Very little research has been conducted on fragility curves related to soil liquefaction. Zhang et al. (2008), however, derived fragility functions for different classes of typical bridges in California when subjected to seismic shaking or liquefaction-induced lateral spreading. Lopez-Caballero and Khalil (2018) assessed numerically the effect on a levee of the liquefaction-induced settlement of the soil foundation in terms of analytical fragility curves constructed on the basis of a nonlinear dynamic analysis. Furthermore, using a database of buildings affected by liquefaction during the 2010 Mexicali, 2010 New Zealand, and 2011 Japan earthquakes, and with reference to building damage, Cazares et al. (2012) proposed vulnerability functions that are obtained as a result of a combination of the functions defined as empirical and those obtained through damage statistics.
Several approaches have been developed in the literature for correlating types of damage with seismic intensity parameters through a fragility curve. There are methods based on simplified mechanism-based procedures (Borzi et al., 2008; Cosenza et al., 2005), capacity spectrum methods (Del Gaudio et al., 2015; Iervolino et al., 2007), and displacement-based methods (Borzi et al., 2008; Calvi, 1999; Crowley et al., 2004). There is, however, also a group of methods based on empirical observations of the expected damage suffered during seismic events (Del Gaudio et al., 2017; Rota et al., 2008).
In this study, the structural and non-structural damage caused to masonry buildings is analyzed and empirical liquefaction2 fragility curves are produced using observational damage data collected after the 2012 Emilia earthquake (section “Reconstruction process and data collection on damaged buildings”). Starting from an analysis of the structural damage described in Field Manual for post-earthquake damage and safety assessment and short term countermeasures (AeDES) forms (Baggio et al., 2007), it has been possible to carry out both a qualitative and quantitative analysis of the observed damage (section “Analysis of liquefaction-induced damage”). In this way, the damage has been subsequently correlated with a new parameter characterizing the liquefaction phenomenon. Different methodologies for estimating fragility functions from data on damage grades (DGs) and the parameters of potential liquefaction are illustrated, discussed, and applied to the database, leading to the derivation of European Macroseismic Scale (EMS)-98-based fragility curves (section “Empirical fragility curves”).
Reconstruction process and data collection on damaged buildings
This section presents the reconstruction procedure and data collected after the 2012 Emilia-Romagna earthquake. At the beginning, reconstruction process ordinances involved residential buildings: Ordinance n. 29, 2012 for temporarily or partially unusable buildings; Ordinance n. 51, 2012 for unusable buildings that have suffered severe damage; and Ordinance n. 86, 2012 for severely damaged buildings requiring a seismic strengthening intervention or demolition and reconstruction. For the first time in Italy, it was also possible to obtain grants for improving the foundation soil. An increased economic contribution for reconstruction up to 15% of the total grant was provided in the areas affected by liquefaction. Note that a specific documentation, aiming at certify liquefaction effects, was required to obtain such extra funding. Moreover, microzonation studies were carried out in the areas struck by the seismic events in order to identify and delimit areas with homogeneous seismic behavior, distinguishing the areas susceptible to the amplification of seismic motion and those susceptible to liquefaction.
Several municipalities were affected by liquefaction, including Cavezzo, Bondeno, Cento, Pieve di Cento, the hamlet of San Carlo in Sant’Agostino, and Mirabello (Gruppo di lavoro RER, 2012). The data related to liquefaction sites were collected and subsequently georeferenced in the GIS environment (Morga et al., 2018; Spacagna et al., 2018). Figure 1a shows the spatial distribution of cases affected by liquefaction (black squares), with a ShakeMap superimposition related to the event of 20 May 2012.
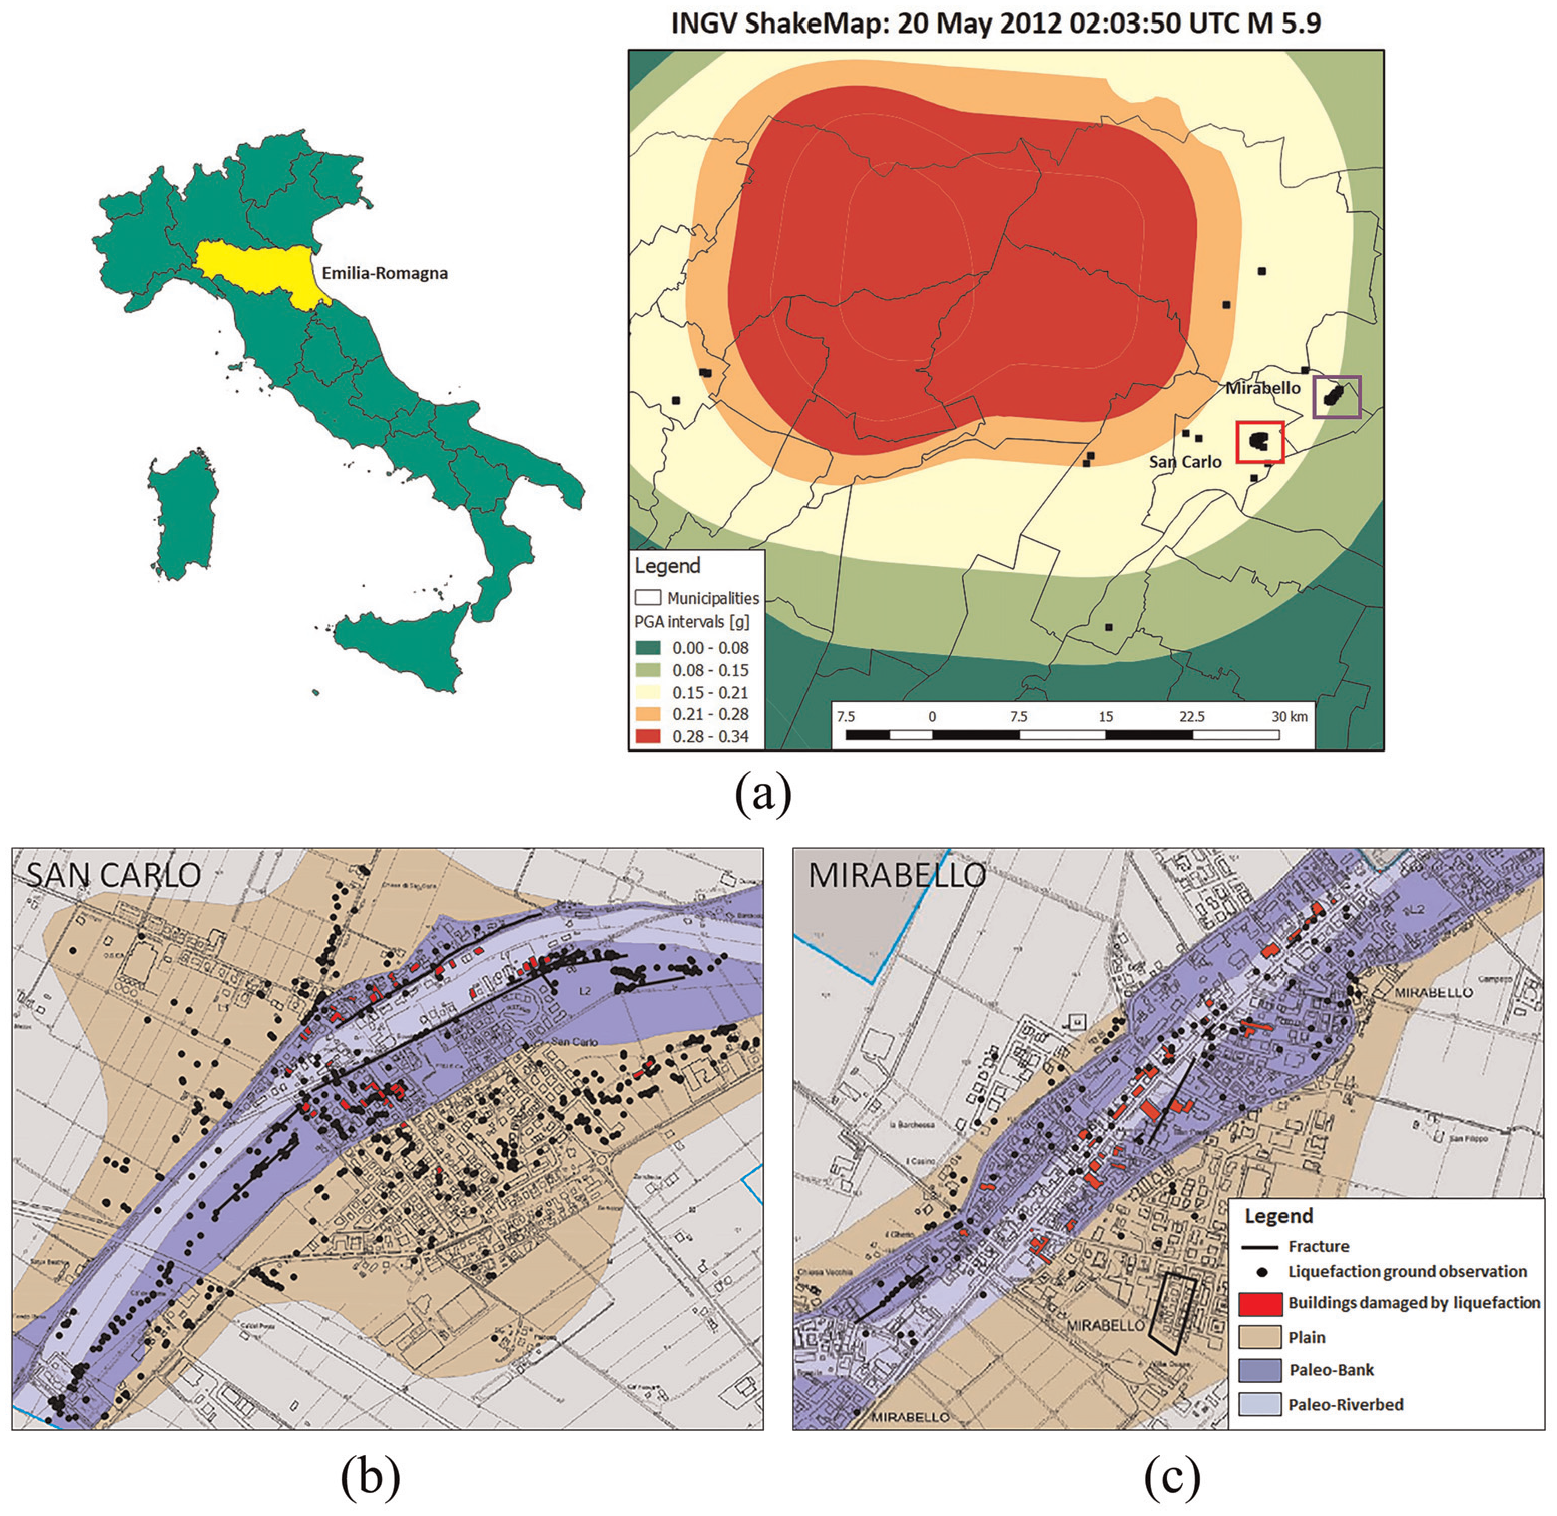
(a) ShakeMap (http://shakemap.rm.ingv.it/shake/index.html) representing the spatial distribution of peak ground acceleration (PGA) and the buildings affected by liquefaction; (b) San Carlo and (c) Mirabello dataset with geological maps and liquefaction evidences.
The peak ground acceleration (PGA) in the area under investigation ranged between 0.0 and 0.34 g. The overlap with the spatial distribution of the liquefaction cases allowed us to see that most buildings fall within an acceleration range of 0.15–0.21 g. The distribution of the sites affected by liquefaction is concentrated in the areas related to the municipalities of San Carlo and Mirabello (Modoni et al., 2019). Since most of the buildings affected by liquefaction are located in these two municipalities, this study will only refer to them. Figure 1b and c shows a comparison between the distributions of liquefaction evidences and the geological maps of the two considered municipalities. It can be observed that most of the liquefaction manifestations occurred along paleo-river beds and paleo-channel systems originating from the depositional activity of the Reno river (Facciorusso et al., 2012).
In order to investigate the effects of liquefaction on the behavior of structures, data related to masonry residential buildings located in San Carlo and Mirabello were collected. In detail, two sets of samples were identified and divided into two classes: (a) a sample of structures not damaged by liquefaction (these structures may rest on soils that did not liquefy or that liquefy at depth without any consequence for the foundations; in the following, these cases will be referred to as structures not damaged by liquefaction—NDL); and (b) a sample of structures damaged by liquefaction (DL). Table 1 shows the frequencies of the samples.
Number of masonry buildings from ISTAT (2011) and for NDL–DL samples
ISTAT: Istituto Nazionale Di Statistica; NDL: not damaged by liquefaction; DL: damaged by liquefaction.
The number of buildings was also compared with the masonry residential buildings contained in the census data (ISTAT, 2011). It was assumed that buildings without a usability request (1114-650-101 = 363) did not suffer any structural damage. This hypothesis is reliable since requests for the evaluation of building usability were made by owners via the AeDES forms after the earthquake. Accordingly, the lack of data obtained from in situ inspections mainly means that no damage was suffered by these buildings.
The data contained in the AeDES forms were used to make an initial comparison between the NDL and DL buildings, in terms of construction age, number of floors, average story surface area, and masonry quality. These macro-parameters may greatly affect building behavior in case of seismic events and were thus analyzed to verify if they play a crucial role in defining the different empirical damage detected in the NDL and DL buildings. Indeed, the construction age allows defining the building type of design (i.e. for gravity loads only or with reference to obsolete or current seismic design rules), number of floors and surface area strongly affect the structural fundamental period of vibration and thus its behavior under seismic actions, and masonry quality determines the capacity of structural components to sustain horizontal actions provided by seismic events.
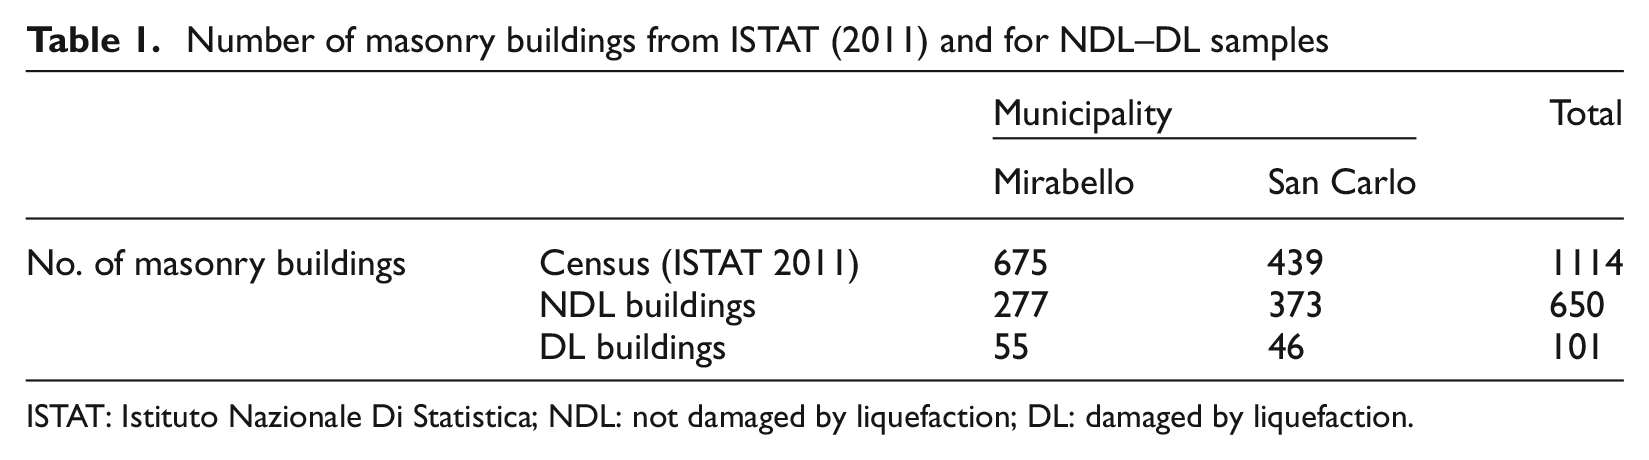
Figure 2 reports the frequency and cumulative percentage of the two classes of structure, that is, NDL and DL (751 buildings) as a function of the construction age, number of stories, and average story surface area. The construction age was classified according to eight periods (before 1919, between 1919 and 1945, 1946–1961, 1962–1971, 1972–1981, 1982–1991, 1991–2001, and after 2001), as commonly adopted in the census data (and the AeDES forms). The trend of the cumulative percentage was similar. Figure 2a shows that 82.6% of the NDL building dataset (corresponding to 455 buildings) and 73.3% of the DL building dataset (corresponding to 92 buildings) were built before 1971. The graph in Figure 2b shows that about 98% of the buildings in the datasets (corresponding to 635 buildings for the NDL class and 99 buildings for the DL class) had between one and three stories. Finally, Figure 2c highlights that about 40% of the buildings (corresponding to 365 buildings for the NDL and 63 buildings for the DL classes) had an average story surface area between 70–100 and 170–230 m2.
Distribution and cumulative percentage of the not damaged by liquefaction (NDL) and damaged by liquefaction (DL) buildings as a function of (a) the construction age, (b) number of stories, and (c) average story surface area.
Consequently, it was possible to assume that the two classes are comparable in terms of the macro-parameters affecting the structural vulnerability to seismic action. Moreover, the data related to the quality of the masonry revealed a percentage of buildings of good quality and with regular texture masonry (77% and 61% for the NDL and DL classes, respectively).
Analysis of liquefaction-induced damage
In the post-Emilia earthquake reconstruction process, documentation was required to illustrate the damage sustained, to describe the interventions needed to achieve building usability, and to quantify the financial support sought from the government. The documentation related to the DL buildings shows that the typical damage caused by foundation settlement largely occurred in buildings that were also damaged by inertial effects (i.e. seismic effects on the superstructure). In particular, according to the observed damage, it can be assumed that in this case liquefaction was activated at different stages of the seismic event at different sites, even if relatively close. The different behaviors mostly depend on local conditions in terms of liquefiable soil layer density and thickness.
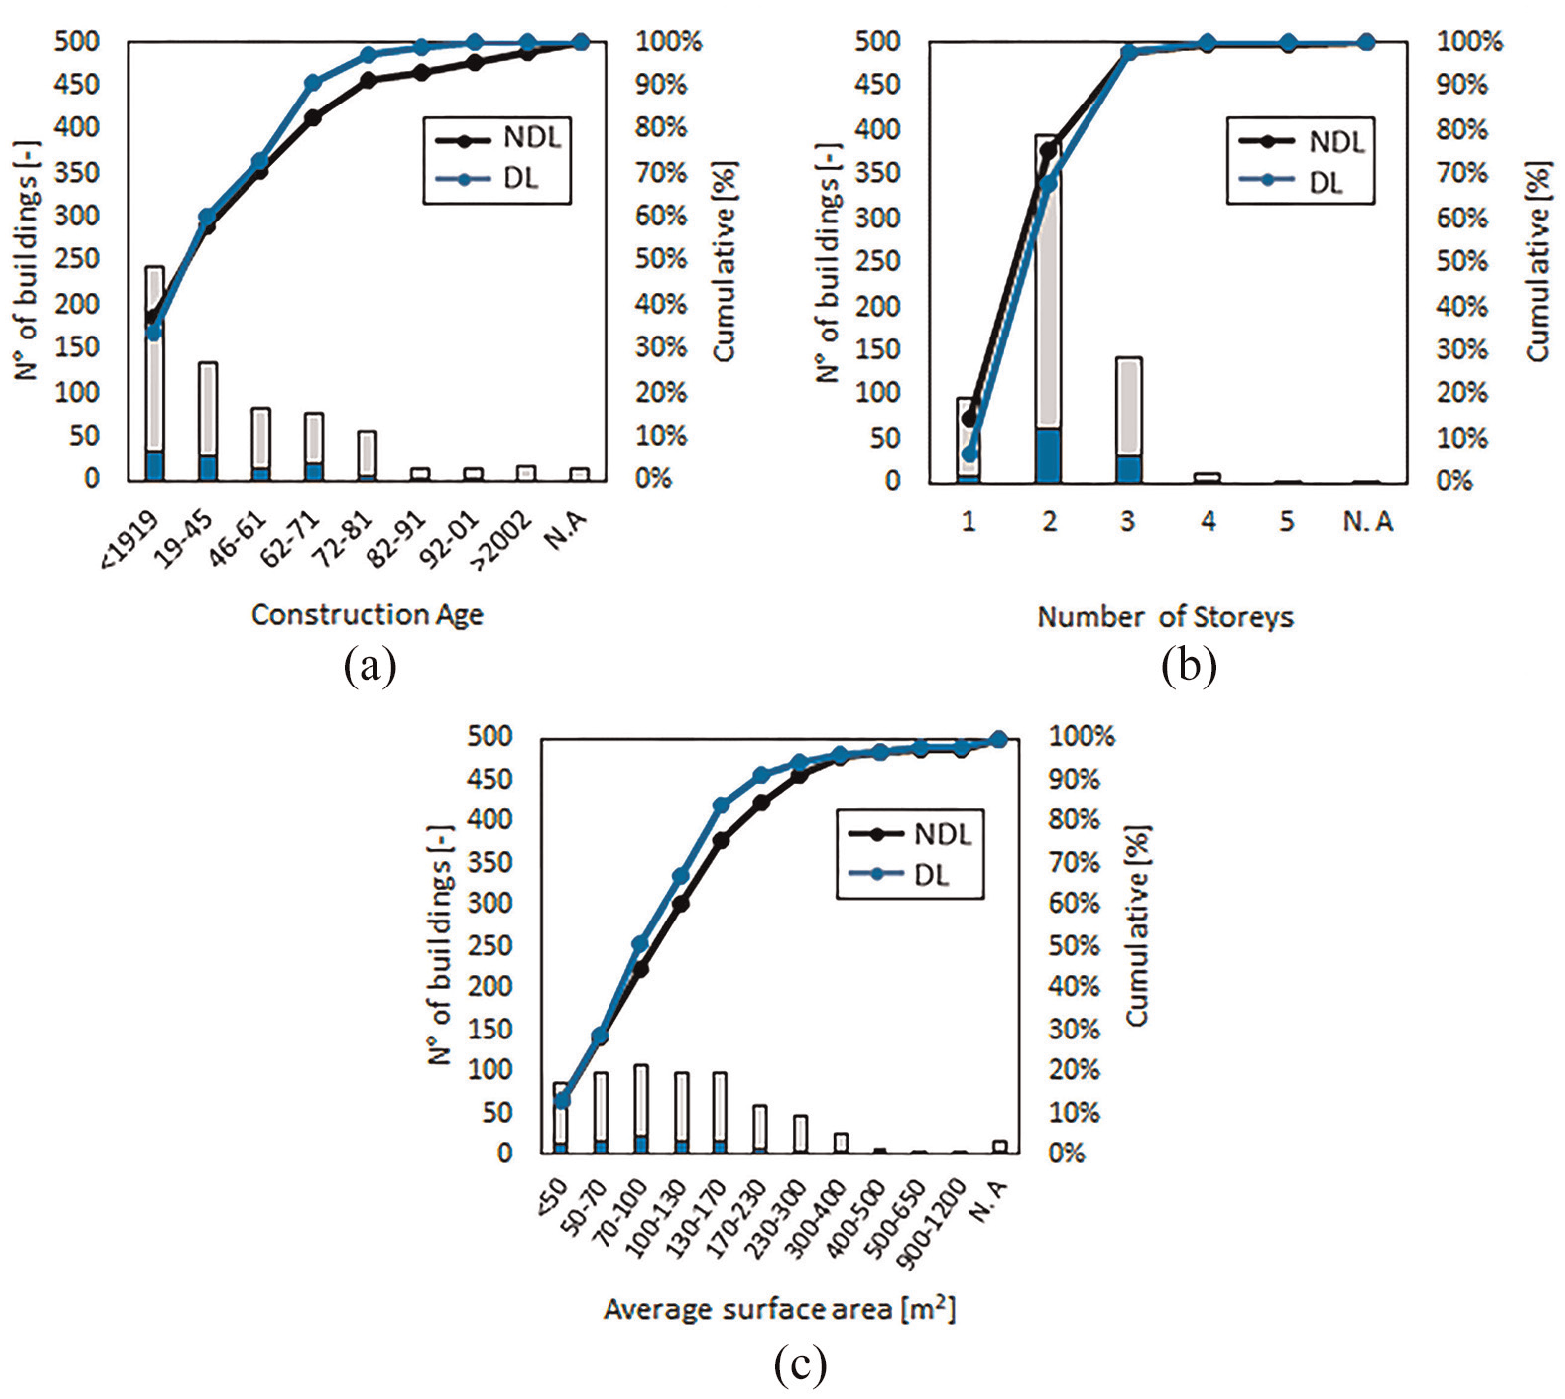
Figure 3 schematically represents three possible conditions related to the absence of liquefaction (Figure 3a), or the attainment of liquefaction at different stages (Figure 3b and c). The figure also reports the type of structural damage commonly detected in Mirabello and San Carlo in such three cases. In the case of no liquefaction (Figure 3a), failures due to the out-of-plane mechanisms of walls or in-plane diagonal cracks (inclined at about ±45°) are commonly detected in the structures. In the case of seismic events that suddenly activate liquefaction or in the case of liquefaction activated for accelerations much lower than the PGA (Figure 3b), the effects are mainly related to liquefaction. The common failures in such a case are rigid building rotations, with a relevant loss of functionality of the structure, as well as one-way diagonal cracks due to foundation settlements. Damage caused by inertial forces is mostly absent, because liquefaction works as a natural isolation system for the superstructure. Finally, Figure 3c shows the combined effects of soil liquefaction and inertial forces on the buildings, which are due to significant inertial forces on the superstructure and liquefaction-induced damage. With the current state of knowledge, it is very difficult to predict when liquefaction is activated, because it is very dependent on the characteristics of the soil.
Empirical damage observed in the case of: (a) no soil liquefaction, (b) early liquefaction activation, and (c) combined inertial and liquefaction effects.
Comparative analysis of empirical damage: NDL versus DL buildings
A comparative analysis of the previously described damage to the NDL and DL buildings is carried out herein using data from AeDES forms. In particular, the data refer to the severity and extent of the damage detected in: vertical structural components (VS) (e.g. masonry vertical bearing walls); floors (F); stairs (S); roofs (R); and infill partitions (IP). The AeDES forms identify four damage levels for each structural or non-structural component: no damage, D0; slight damage, D1; medium-severe damage, D2–D3; and very heavy damage or collapse, D4–D5. The observed damage level definition is based on the European Macroseismic Scale EMS-98, integrated with the definitions used in the GNDT survey form (Baggio et al., 2007; GNDT, 1993; Grünthal, 1998).
The damage extent is reported as follows: damage extent less than 1/3, between 1/3 and 2/3, and greater than 2/3 of the story components. Figure 4 shows a comparison between the DL and NDL buildings in terms of cumulative damage probability matrices (C-DPMs) that represent the percentage of buildings that reaches or exceeds the jth level of damage in VSs.
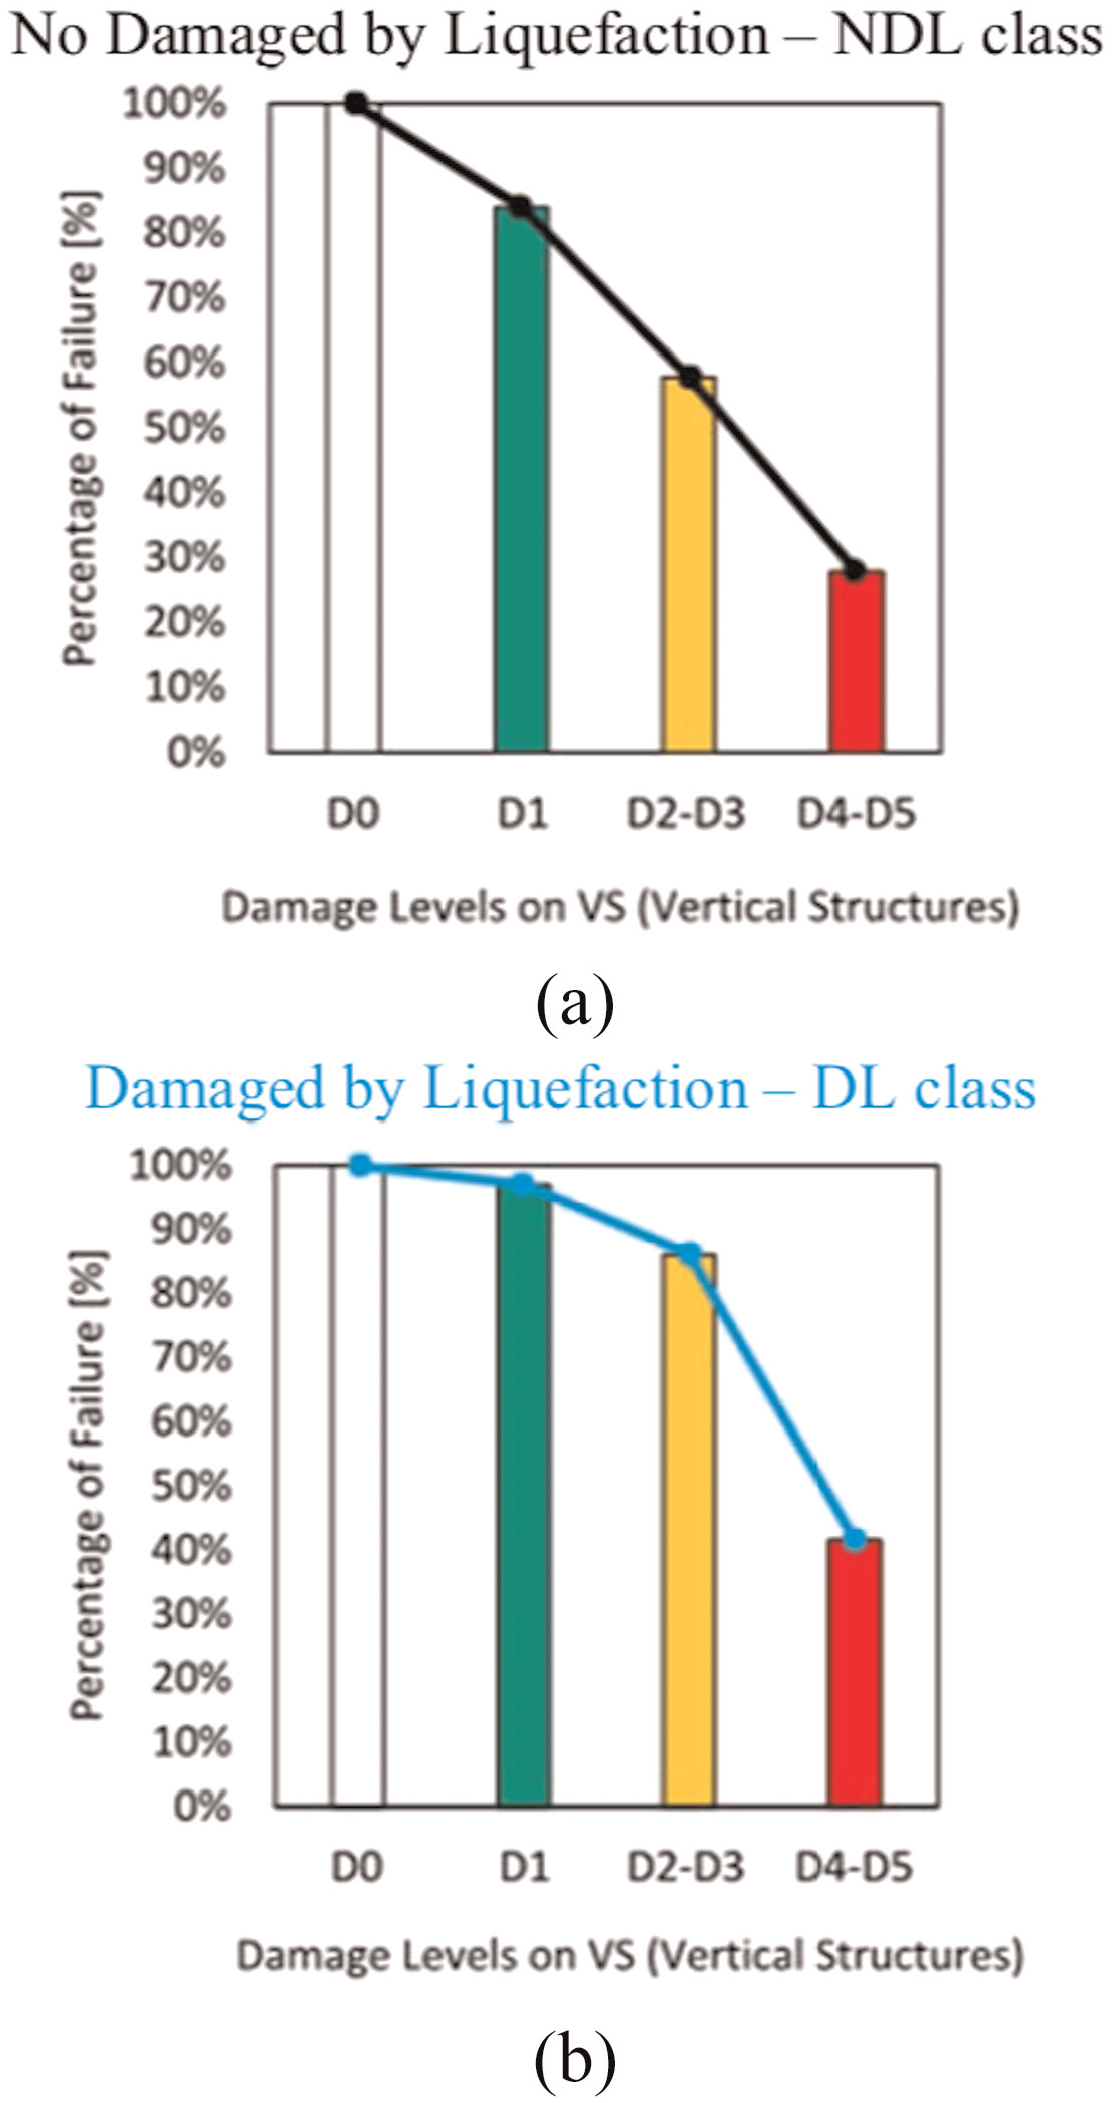
Vertical structure (VS)–C-DPMs: (a) NDL class and (b) DL class.
The figure clearly shows that the DL-class buildings suffered damage to the VSs that was more severe than that observed in the NDL sample. The data related to other structural or non-structural components are summarized in Table 2 and confirm that the severity and extent of the damage detected in the DL buildings was greater than that in the NDL buildings, especially with reference to stairs.
Cumulative percentage of failure expressed as a function of the damage levels in the other structural components for both the NDL and DL samples
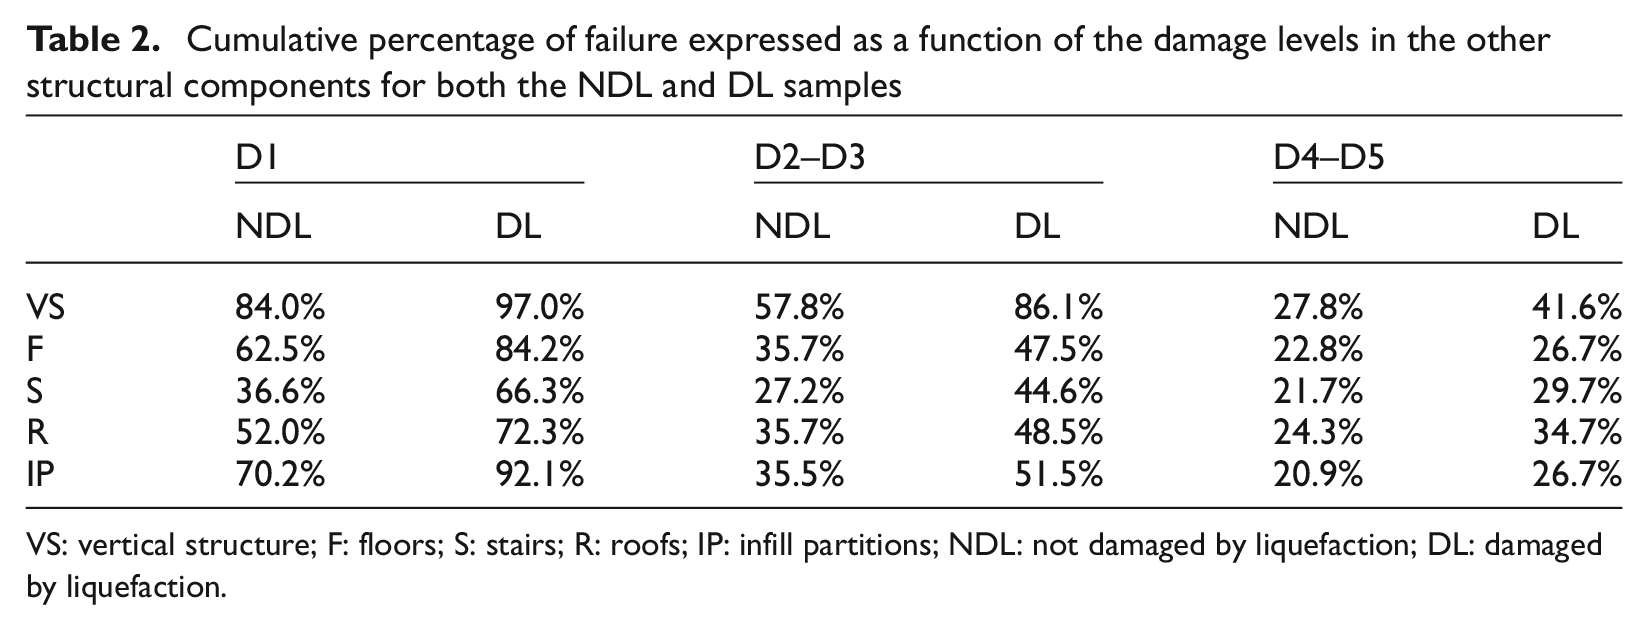
VS: vertical structure; F: floors; S: stairs; R: roofs; IP: infill partitions; NDL: not damaged by liquefaction; DL: damaged by liquefaction.
Effects of structural vulnerability on empirical damage
In order to analyze the effects of structural vulnerability on the empirical damage detected in the NDL and DL buildings, different subsets of buildings for each class are defined in this section according to data related to vertical and horizontal structure types. In particular, section 3 of the AeDES forms (Baggio et al., 2007) identifies five vertical structure types: (a) unknown, (b) masonry with an irregular layout or bad quality without ties, (c) masonry with an irregular layout or bad quality with ties, (d) masonry with a regular layout or good quality without ties, and (e) masonry with a regular layout or good quality with ties. Furthermore, six horizontal structure types are reported: (a) unknown, (b) vaults with no ties, (c) vaults with ties, (d) beams with flexible slabs, (e) beams with semi-rigid slabs, and (f) beams with rigid slabs. Neglecting unknown structural types, the combination of vertical and horizontal structures leads to 20 masonry subsets of buildings, representing different vulnerability categories. Table 3 summarizes the number of buildings in each subset related to the NDL and DL classes, respectively. Note that the total number of buildings is slightly lower than that reported in Table 1 because, in a few cases, the “unknown” structural type was selected in the AeDES form. A mean empirical global damage factor,

where

where
Number of buildings in 20 subsets of NDL and DL buildings according to the horizontal and vertical structure types
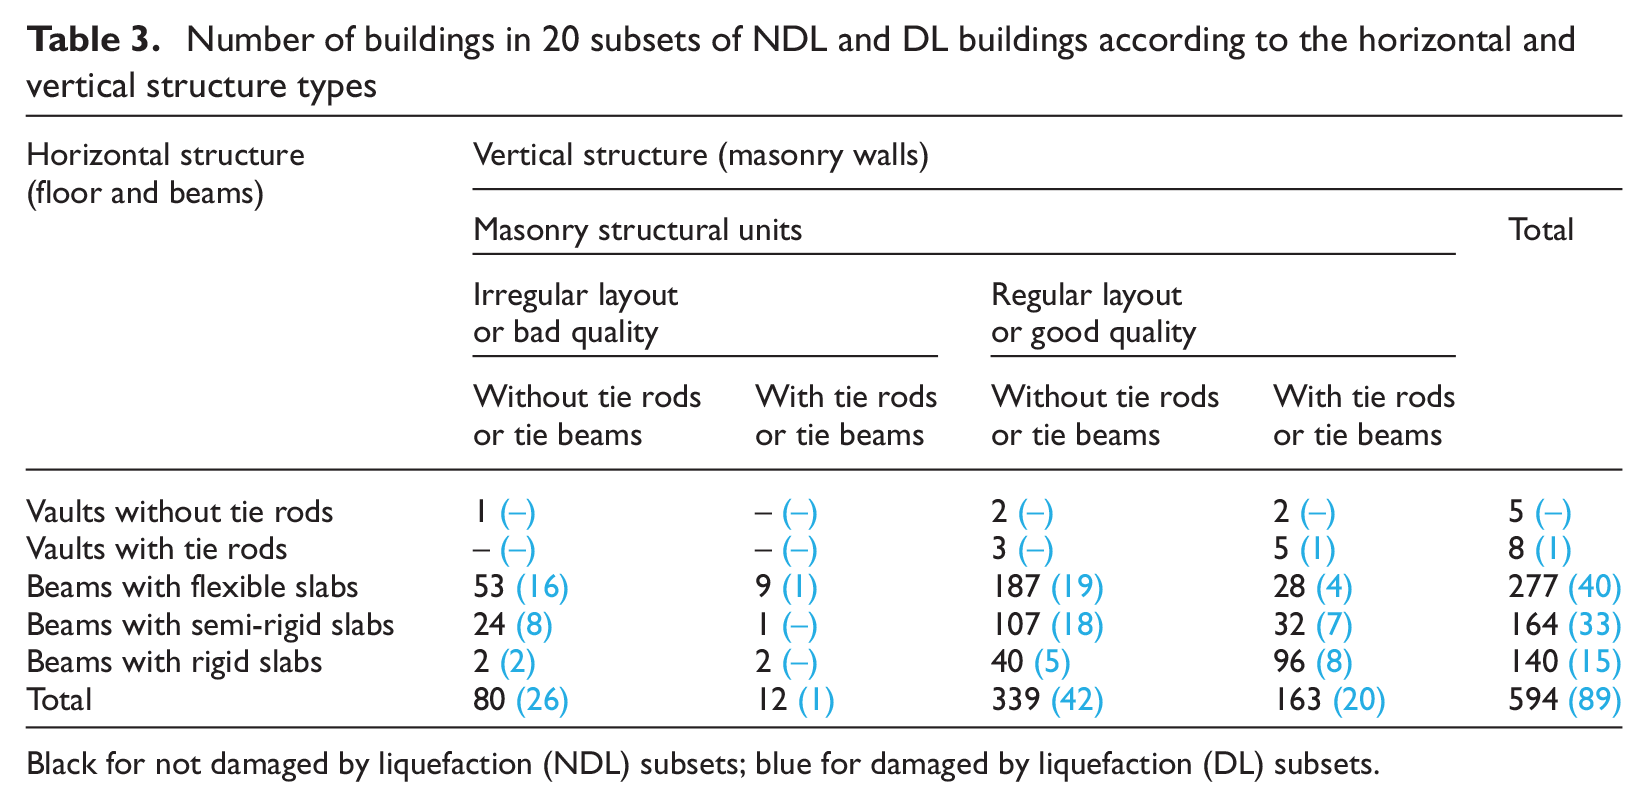
Black for not damaged by liquefaction (NDL) subsets; blue for damaged by liquefaction (DL) subsets.
Figure 5 reports an overall comparison between the mean damage,
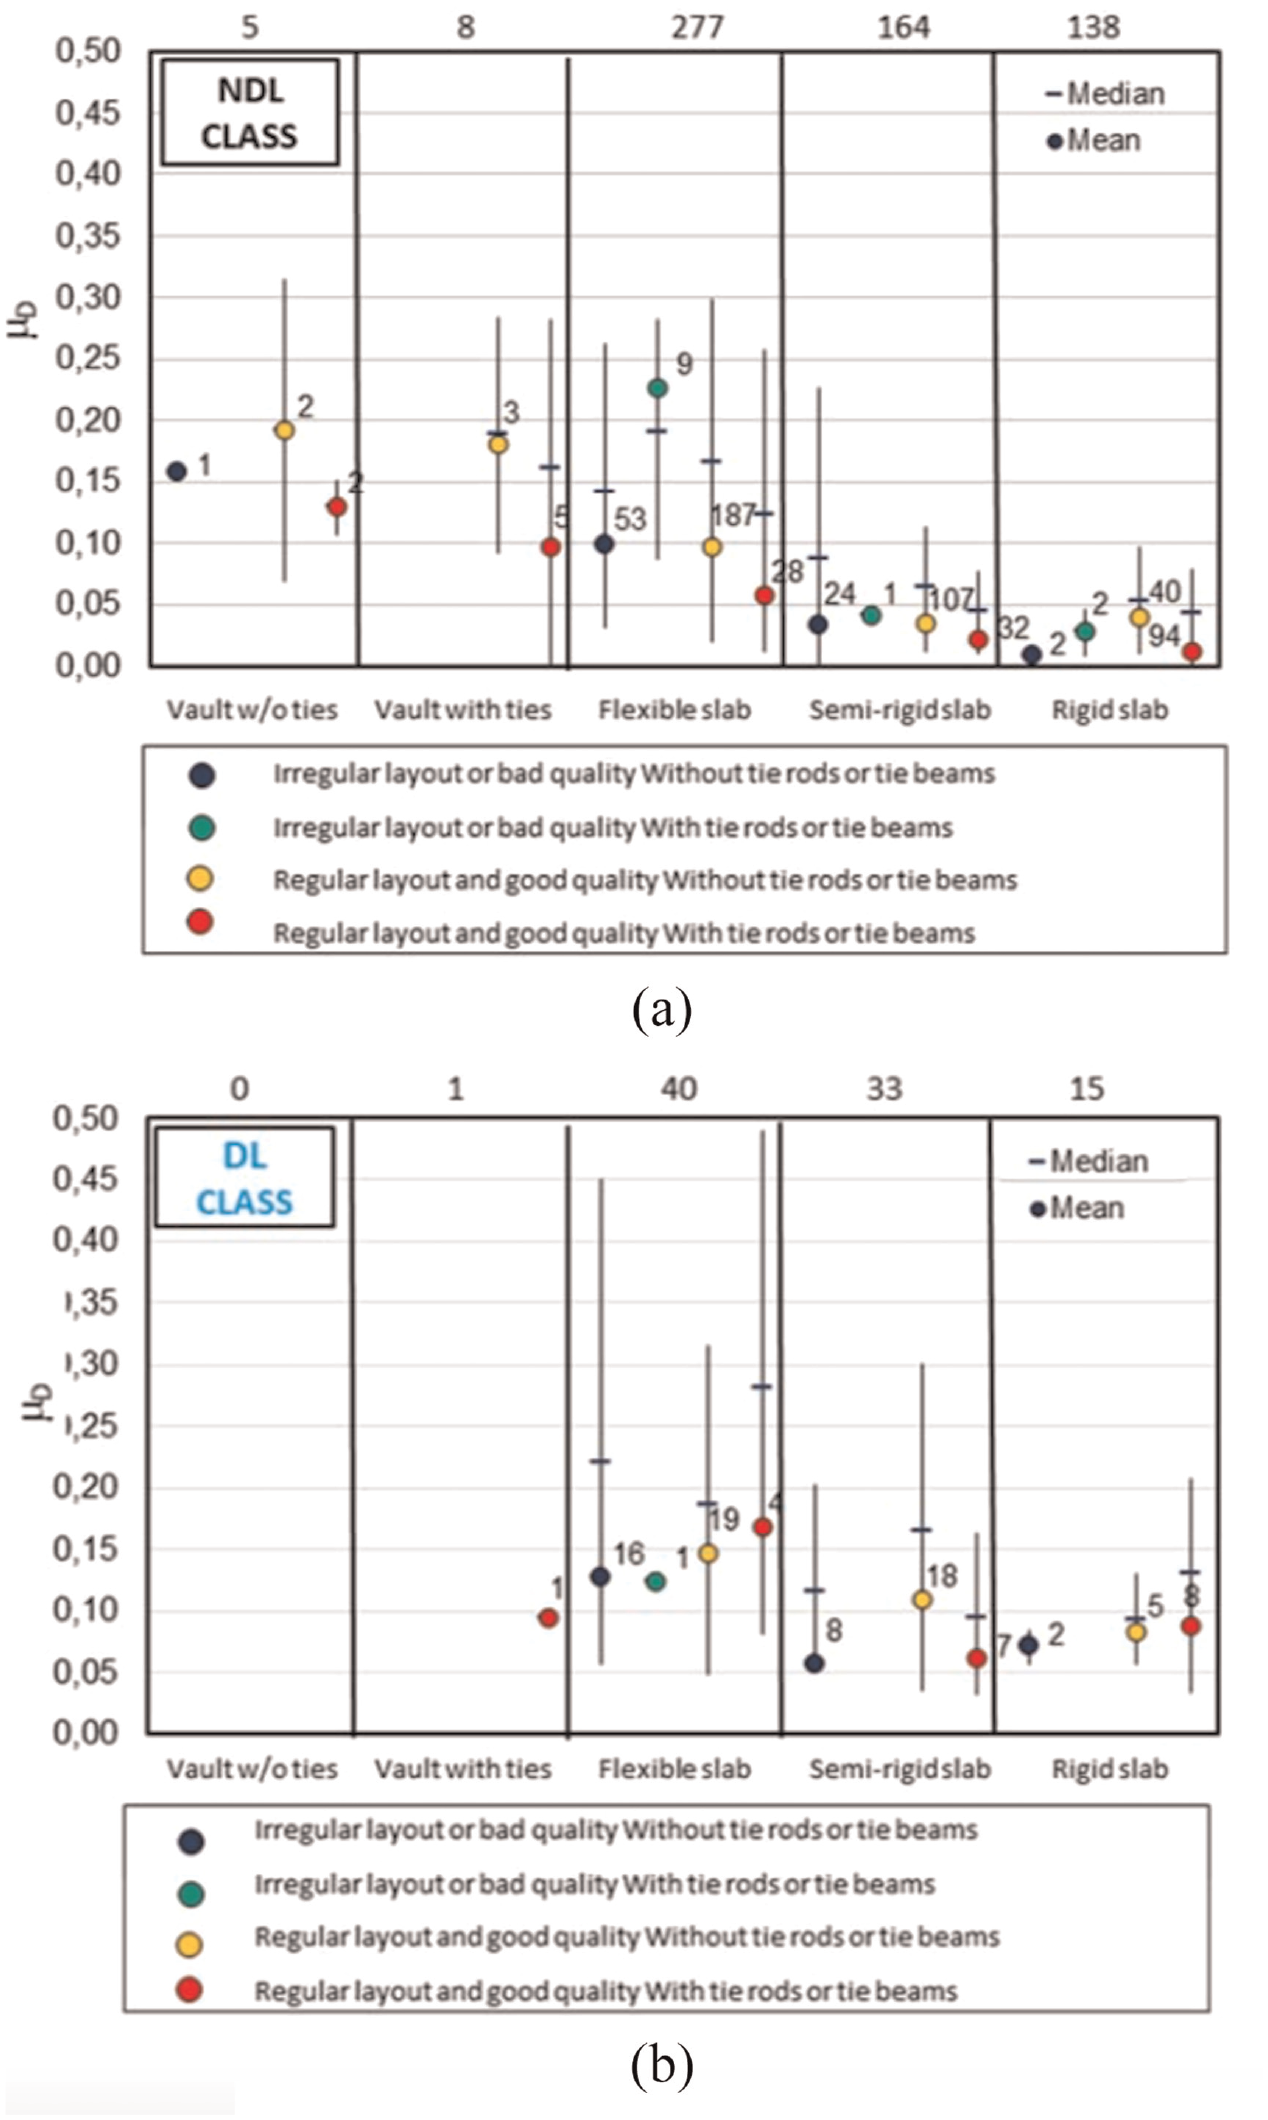
Mean empirical damage as a function of the vulnerability categories of buildings: (a) not damaged by liquefaction (NDL class) and (b) damaged by liquefaction (DL class).
Figure 5a shows a very similar value of
In order to better investigate the influence of masonry texture and quality on the global mean empirical damage, Figure 6 reports a direct comparison of their trend for the NDL and DL building subsets. In general, the figure shows that the stiffer the horizontal structure, the better the global structural behavior for both the NDL and DL data subsets. Furthermore, the damage detected in the DL buildings was always greater than that in the NDL buildings.
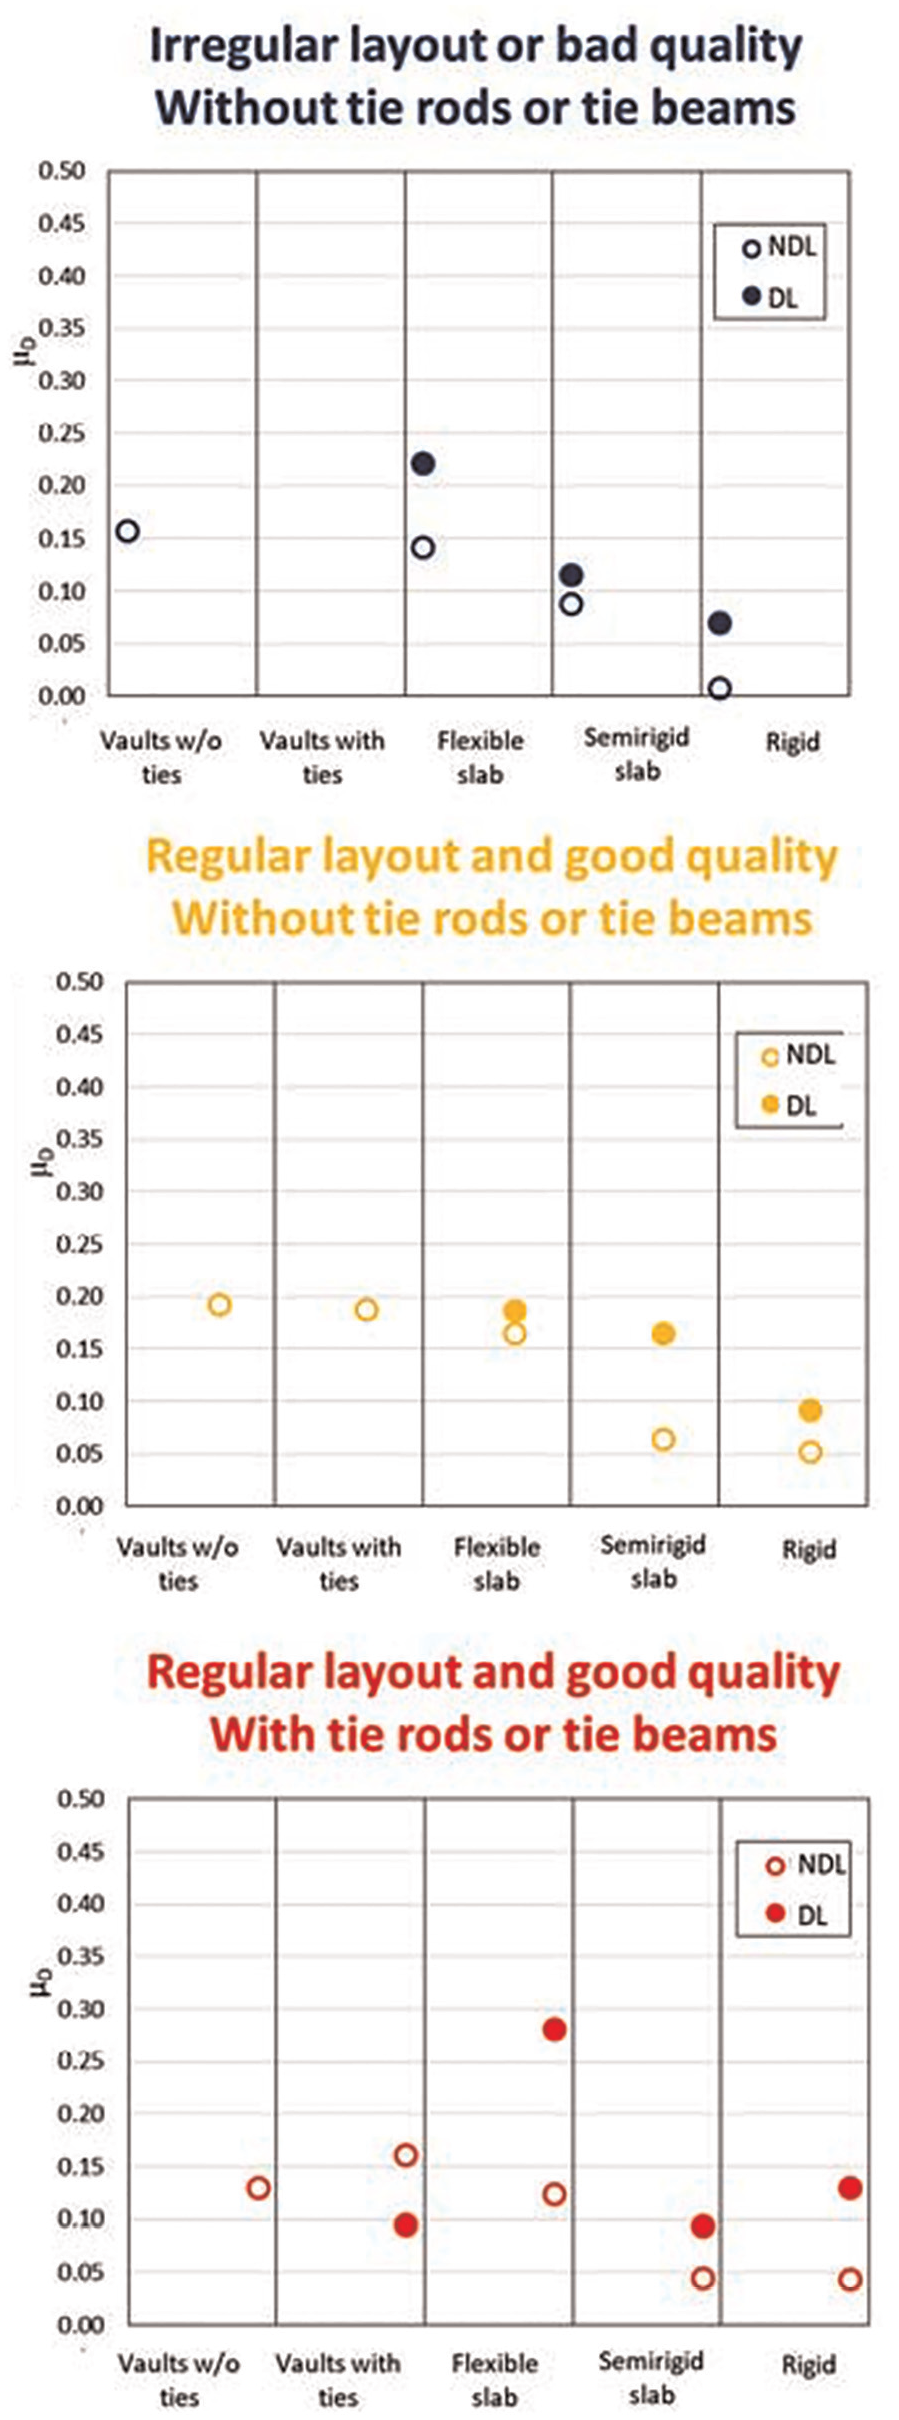
Mean empirical damage; comparison between the not damaged by liquefaction (NDL) and damaged by liquefaction (DL) data subsets.
Prediction of repair costs
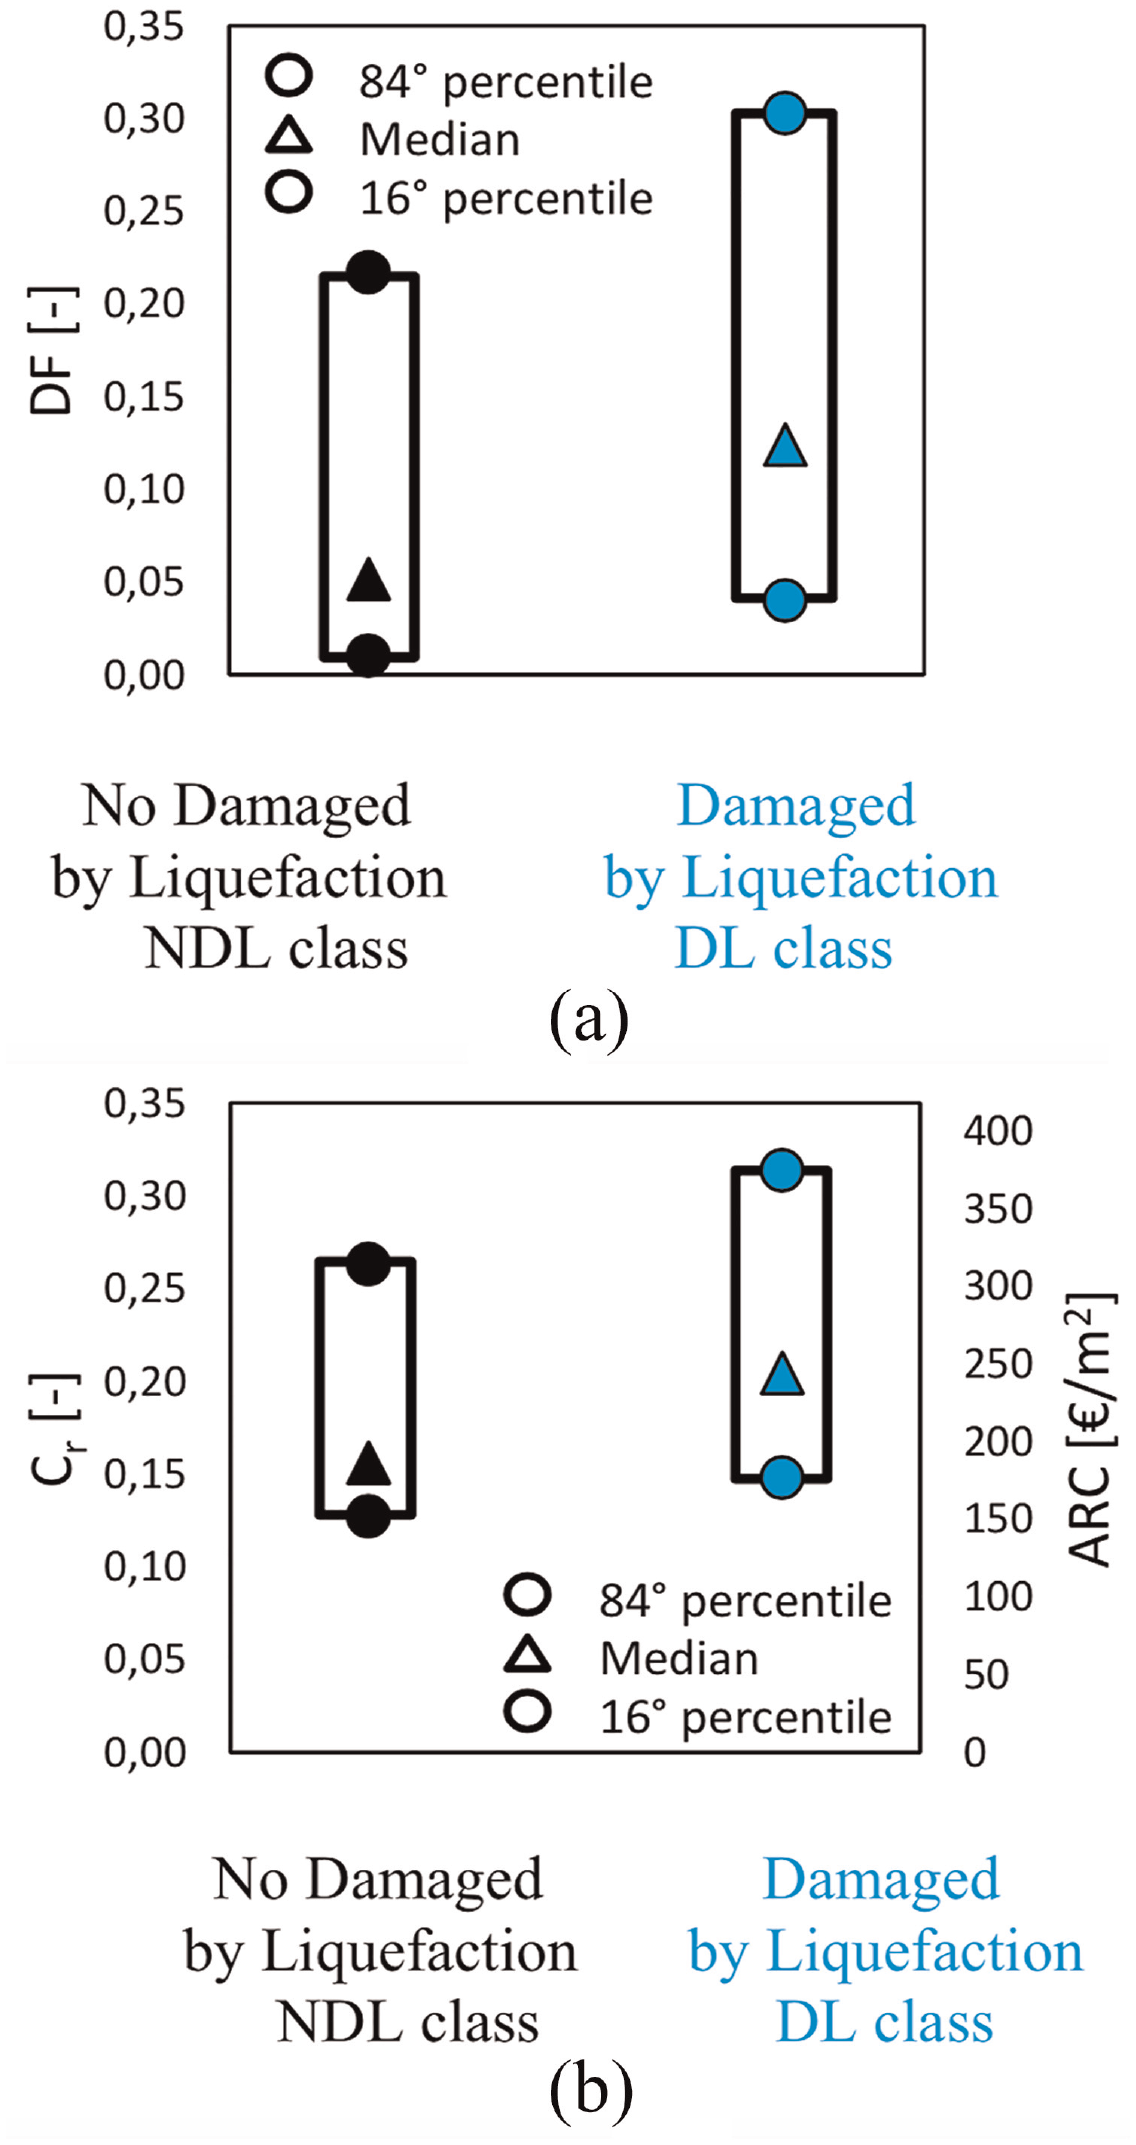
The mean empirical damage is a measure of the global damage detected in a building, but may not be an adequate measure when it comes to making a prediction of losses, because it does not correlate the damage caused to each building component with its economic value. Indeed, recent studies demonstrated that the repair costs are strongly affected by nonstructural components rather than structural ones (De Martino et al., 2017; Del Vecchio et al., 2018). Consequently, in this section, in order to focus on the impact of liquefaction in terms of economic losses, a different parameter is used to compute these losses, in particular a measure that is related to the aftermath of the L’Aquila event (De Martino et al., 2017). This parameter, named as the damage factor (DF), has been calibrated on data costs related to the reconstruction process and directly accounts for the real losses computed by practitioners involved in the estimation of repair costs (Di Ludovico et al., 2017a, 2017b). The DF is directly computed using the data reported in Section 3 of the AeDES forms, but depends on the Dj and γj values specifically calibrated for loss analyses. Furthermore, a relationship between the DF and actual repair costs (ARC) induced by damage (or between the DF and an a-dimensional cost ratio obtained as a ratio between the ARC related to the building and the average building demolition and reconstruction cost—building repair cost ratio, Cr) is reported in De Martino et al. (2017) and recalled as follows:
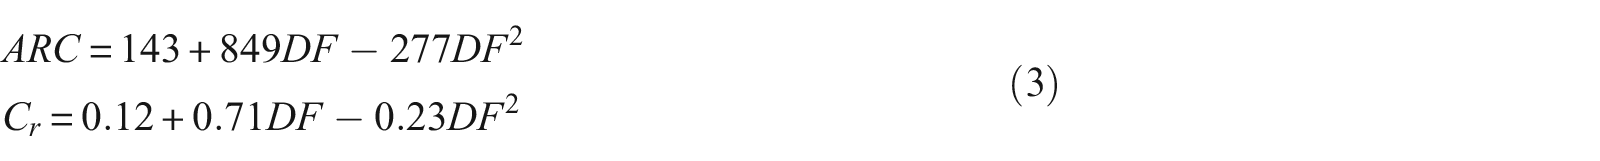
Figure 7a and b reports the DF with a median and 16th and 84th percentiles, as well as the relevant ARC and Cr values for the NDL and DL buildings. The analysis refers to NDL and DL buildings classes rather than the subsets of data analyzed in the previous section because it aims capturing the effects of liquefaction on costs rather than structural vulnerability parameters on costs.
Median and 16th and 84th percentile for the NDL and DL classes of: (a) DFs; (b) Building repair cost ratio Cr or actual repair cost ARC.
The median DFs are 0.052 and 0.124, corresponding to a median Cr of 0.156 and 0.204 for the NDL and DL classes, respectively. Accordingly, the effects of liquefaction may lead, based on the predictions of such a model, to an increase in the repair costs of about 30% with respect to cases where liquefaction was not observed.
Empirical fragility curves
Fragility curves related to seismic events define the exceeding probability of a given DG as a function of a ground motion intensity measure (IM). The IM may be a macroseismic parameter or, as commonly adopted in recent studies, is represented by a ground motion intensity record in terms of various peak ground parameters: acceleration (PGA), velocity (PGV), and displacement (PGD). A commonly used functional form and regression technique to produce fragility curves is the lognormal cumulative distribution function (CDF):

where
where
Another available functional form used in the literature is the exponential model (Amiri et al., 2007; Rossetto and Elnashai, 2003).

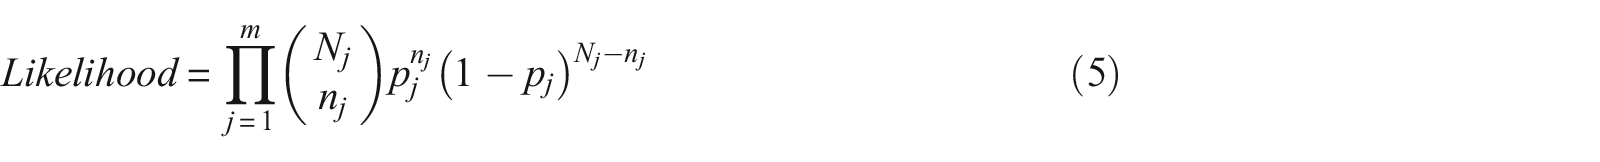
The parameters α and β can be determined according to the LSE or MLE methodology. In the following, both functional forms (i.e. lognormal and exponential) are used, along with the nonlinear LSE and MLE methodologies. In order to produce fragility curves that take into account the liquefaction phenomenon, it is necessary to define suitable DGs and IMs.
DGs
The empirical data collected in Section 4 of the AeDES forms (Baggio et al., 2007) were used to define the buildings’ DGs. In particular, the DG of each building was determined by accounting for the level and extent of the damage to the VS component, and five DGs were assumed based on the European Macroseismic Scale, EMS-98 (Grünthal, 1998). The criterion used to convert the damage levels to DGs was that reported in Dolce et al. (2017) and is summarized in Table 4.
DG (EMS-98) and corresponding damage levels to VSs according to the AeDES survey forms (Baggio et al., 2007).
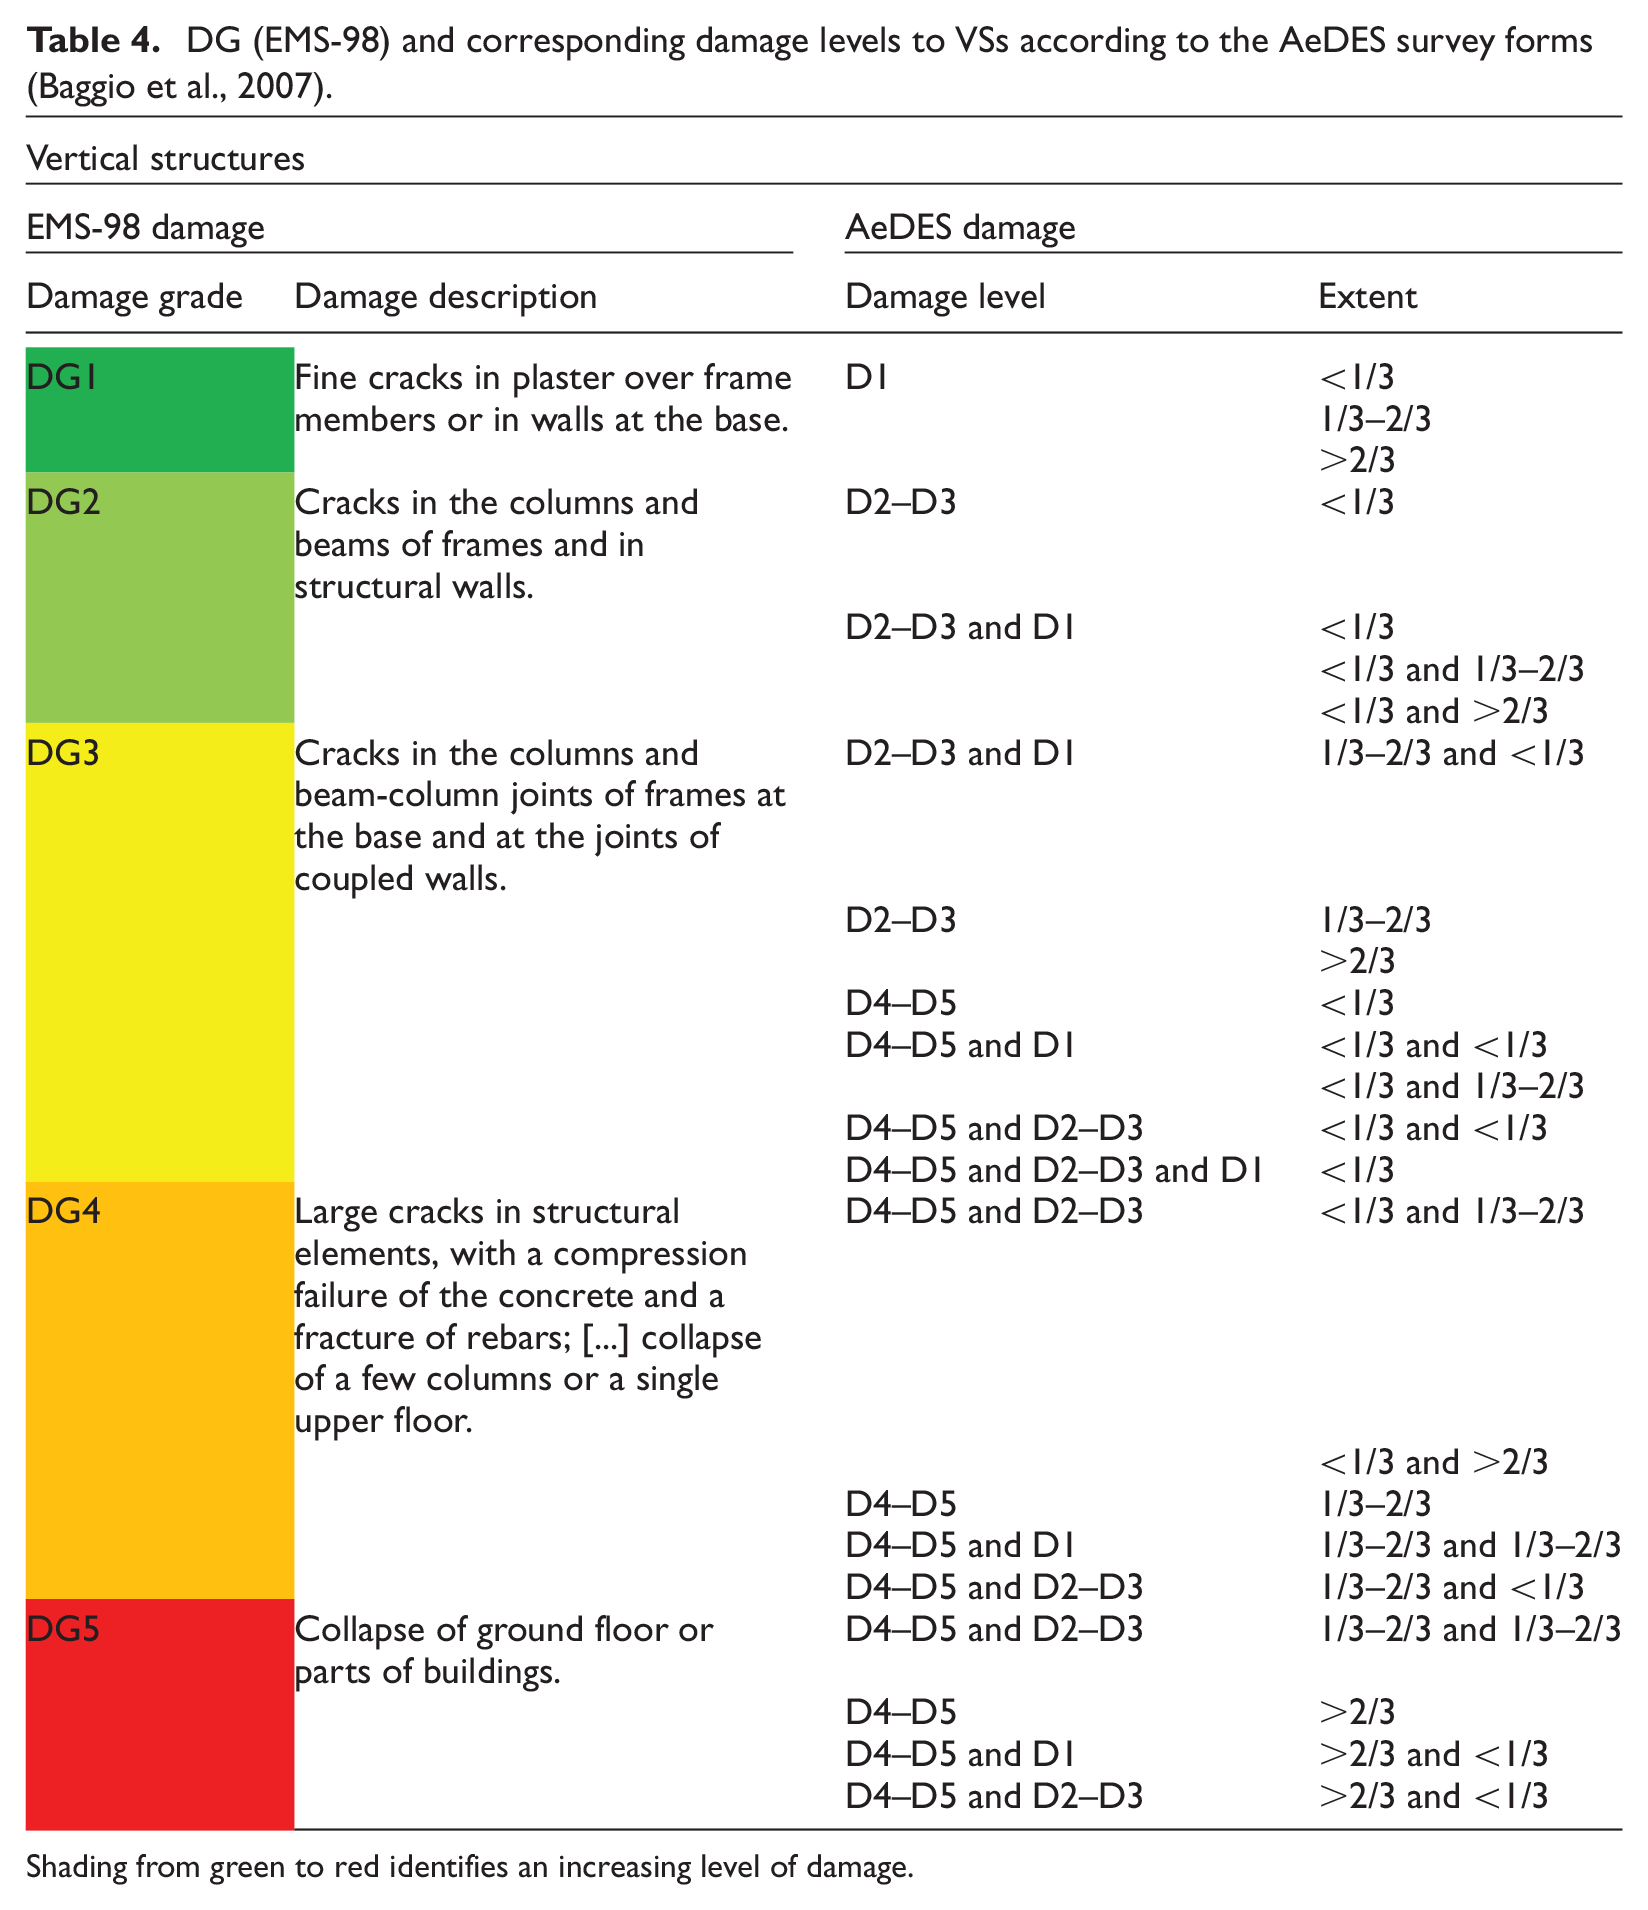
Shading from green to red identifies an increasing level of damage.
The table shows the corresponding DGs assumed for the building for each damage level and its relevant extent. Note that the AeDES forms allow multiple choices in the selection of the damage level and extent and so different combinations are possible.
Potential liquefaction indices
In this study, a liquefaction potential index was adopted as an IM, in order to correlate the observed building damage due to the occurrence of liquefaction.
The assessment of potential liquefaction is still one of the most debated topics in earthquake geotechnical engineering. In common engineering practice, it is usually based on simplified methods which propose empirical relationships between liquefaction evidence observed after strong seismic events and soil liquefaction resistance, as measured with traditional in situ tests, such as Cone Penetration Tests (CPTs) and Standard Penetration Tests (SPTs) (Boulanger and Idriss, 2016). Within this framework, it is possible to calculate a safety factor against liquefaction triggering,
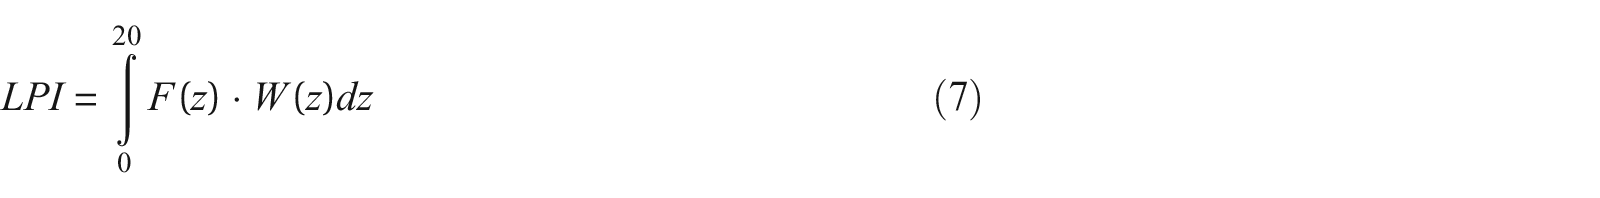
where


Although it has gained wide popularity worldwide, the LPI only accounts for conditions of full liquefaction
Recently, Van Ballegooy et al. (2014) introduced a new parameter, named liquefaction severity number (LSN). This parameter is calculated by considering soil volumetric deformation and has the advantage of allowing the contribution of unliquefied
A completely different approach to take into account the effect of liquefaction at ground level has been proposed by Ishihara (1985), who suggests to correlate in a qualitative way to the onset of damage the thickness of the superficial crust and of the liquefiable layer, as well as the maximum ground acceleration, using the chart reported in Figure 8.
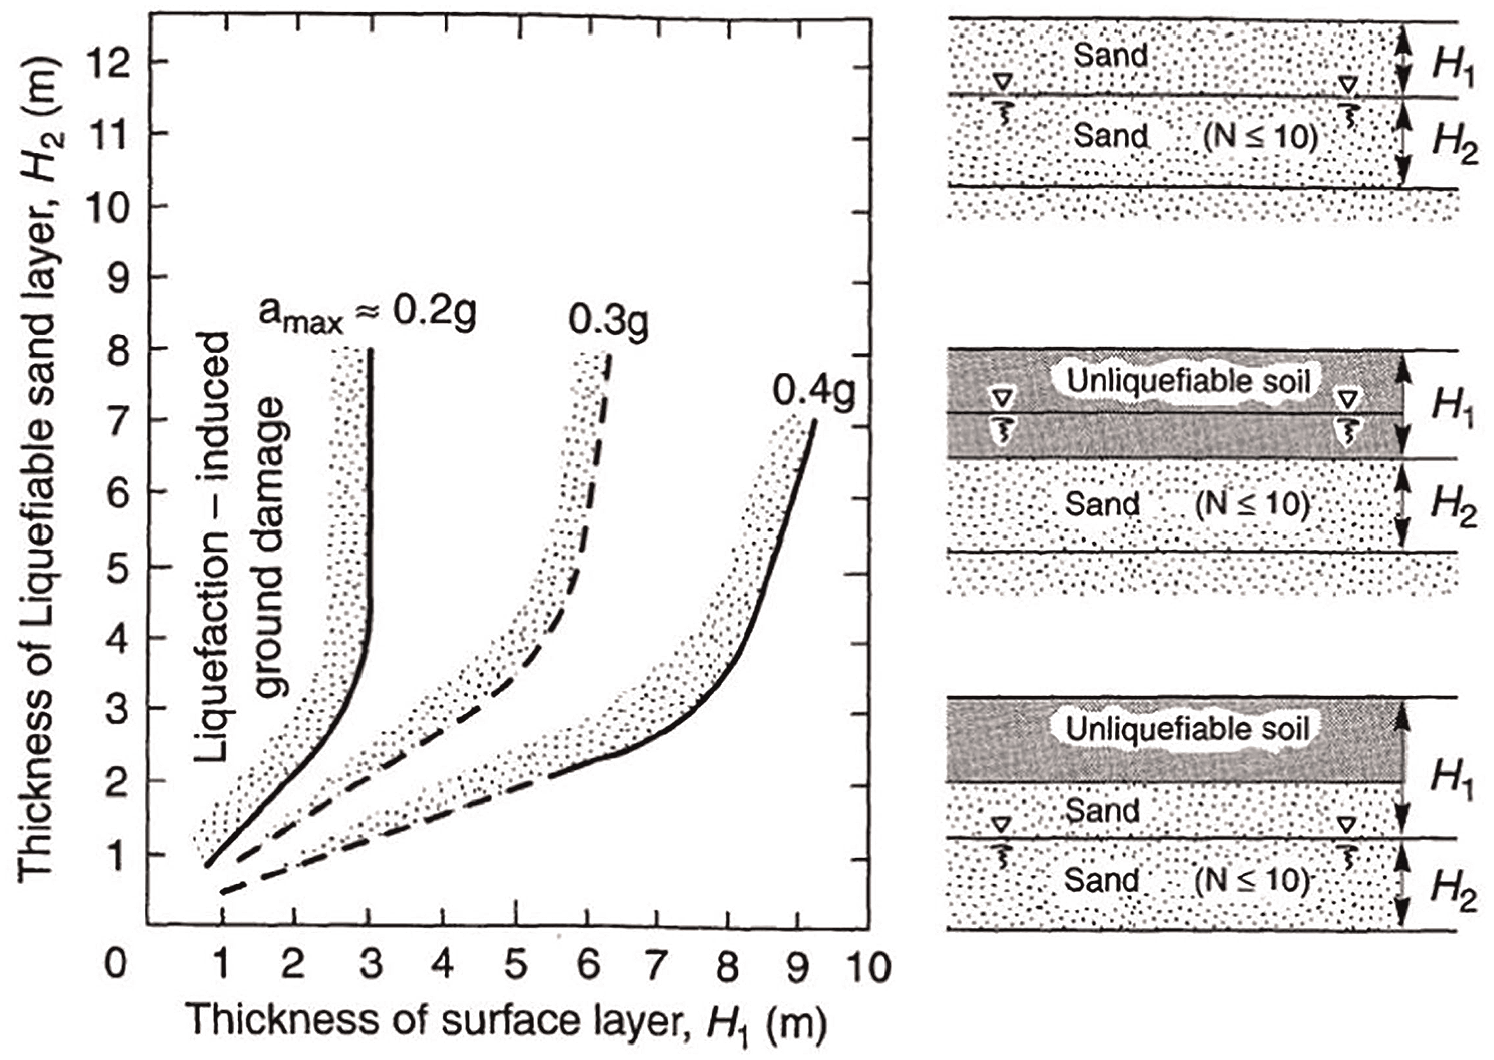
Relationship between thickness of a liquefying, H2 (m) and thickness of a non-liquefying overlying layer, H1 (m) at sites for which surface manifestation of level-ground liquefaction has been observed (modified after Ishihara, 1985).
This approach is intriguing because it directly links the observed damage to the most relevant variables related to liquefaction-induced settlements, which should be preferred in the definition of an integral parameter to the safety factor adopted by the other approaches (LPI, LSN, etc.).
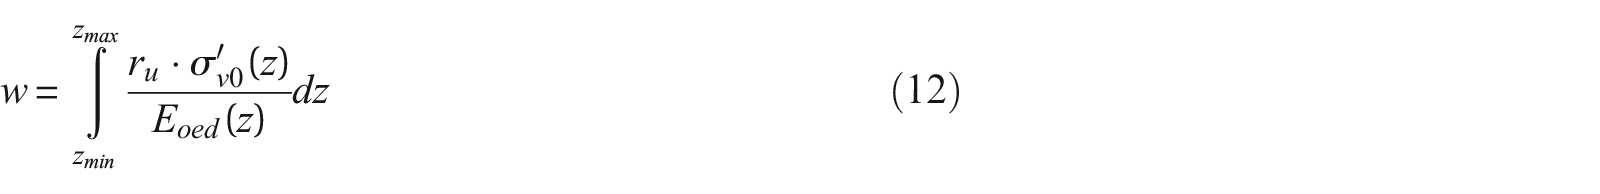
Therefore, in this work an estimate of the liquefaction-induced settlement has been used to derive an IM to be adopted for defining the fragility curves. As the effects of sand ejecta (if any) are difficult to quantify, the post-consolidation settlement was specifically considered. In free-field conditions, such a settlement can be expressed as:
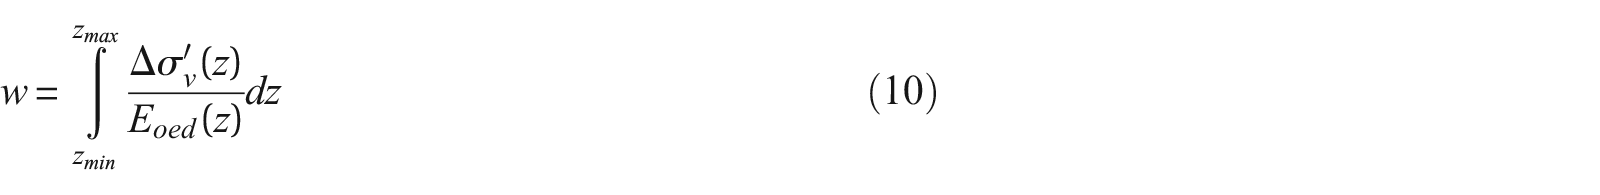
where
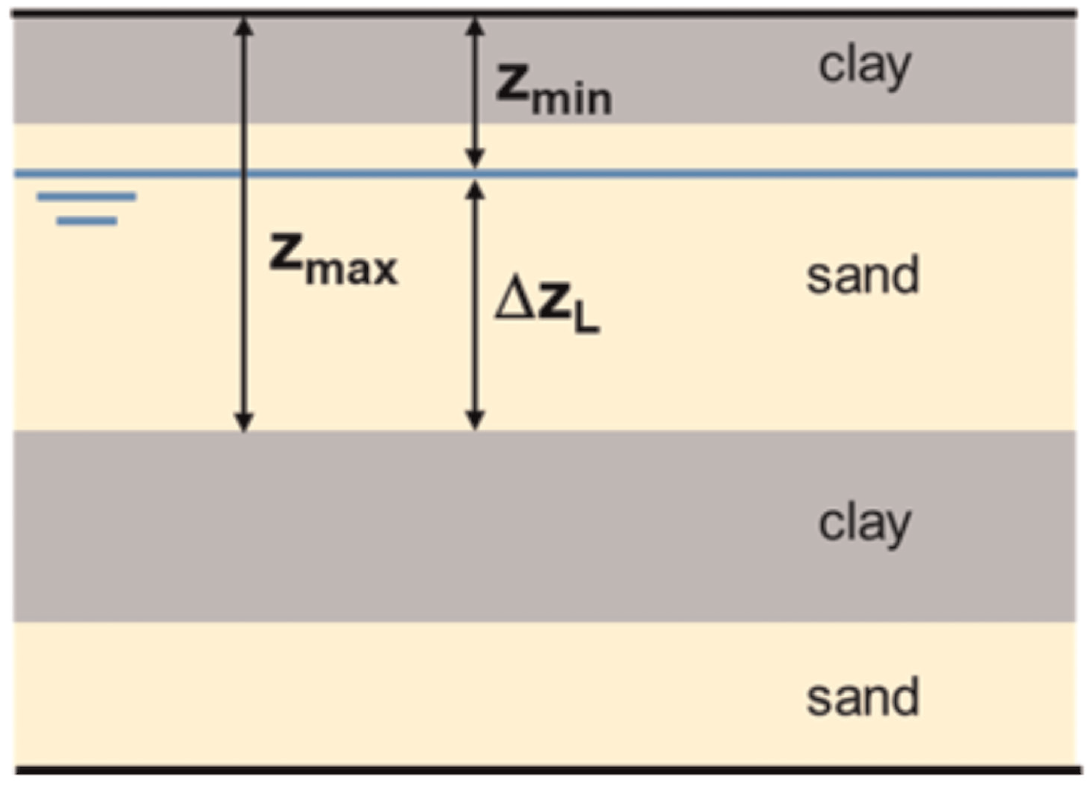
Minimum,
A new liquefaction potential index, Induced dAmage Measurement, is then proposed as IAM in this work:
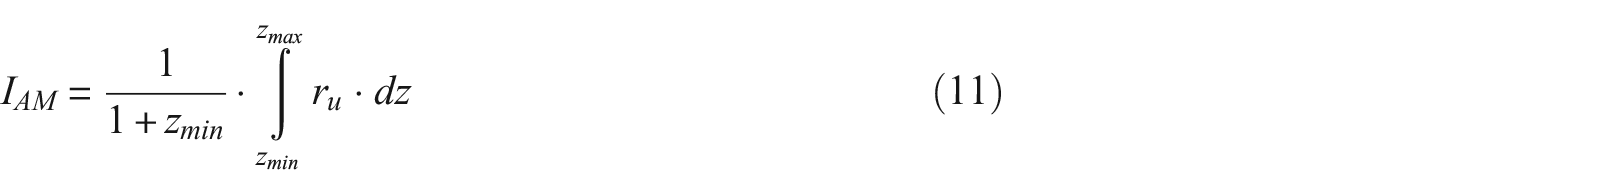
in which
Assuming for
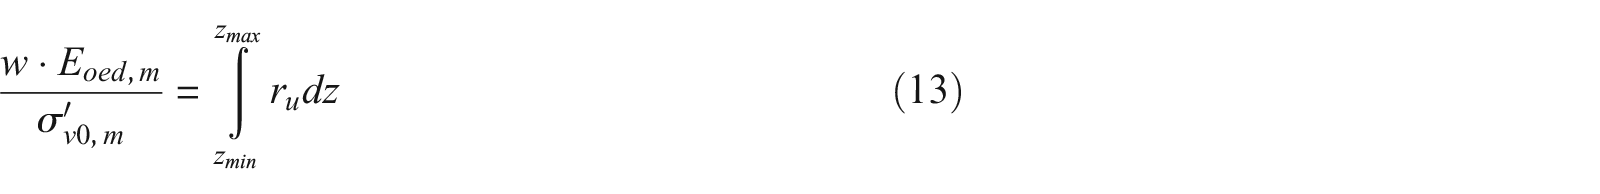
In order to make this normalized settlement non-dimensional, and considering that the potential post-liquefaction settlement is more likely to take place as this layer gets closer to ground level, the desired (and physically based) parameter
In a fully liquefied layer (ru =1), the expression of IAM simplifies and becomes:

The simplified expression of IAM (Equation 14) can be simply calculated on the basis of stratigraphic evidence and is then best fitted for the investigation of wide areas.
The proposed potential index has been computed for both study areas based on the field investigation database produced by the Emilia-Romagna region, which is composed of 166 CPTs and 170 CPTUs.
In this case the simplification ru = 1 was based on the results of one-dimensional (1D) numerical analyses in effective stress (using the code SCOSSA, Tropeano et al., 2019) carried out on representative soil profiles for San Carlo and Mirabello using the seismic input obtained by deconvolution of the Mirandola record (MRN) of the 20 May 2012 Emilia Earthquake (Chiaradonna et al., 2019). These results indicate that full liquefaction of the uppermost liquefiable layer was extensively reached in the paleo-riverbed and in the paleo-bank (Figure 1) (Caputo et al., 2019), as shown, for example, in Figure 10.
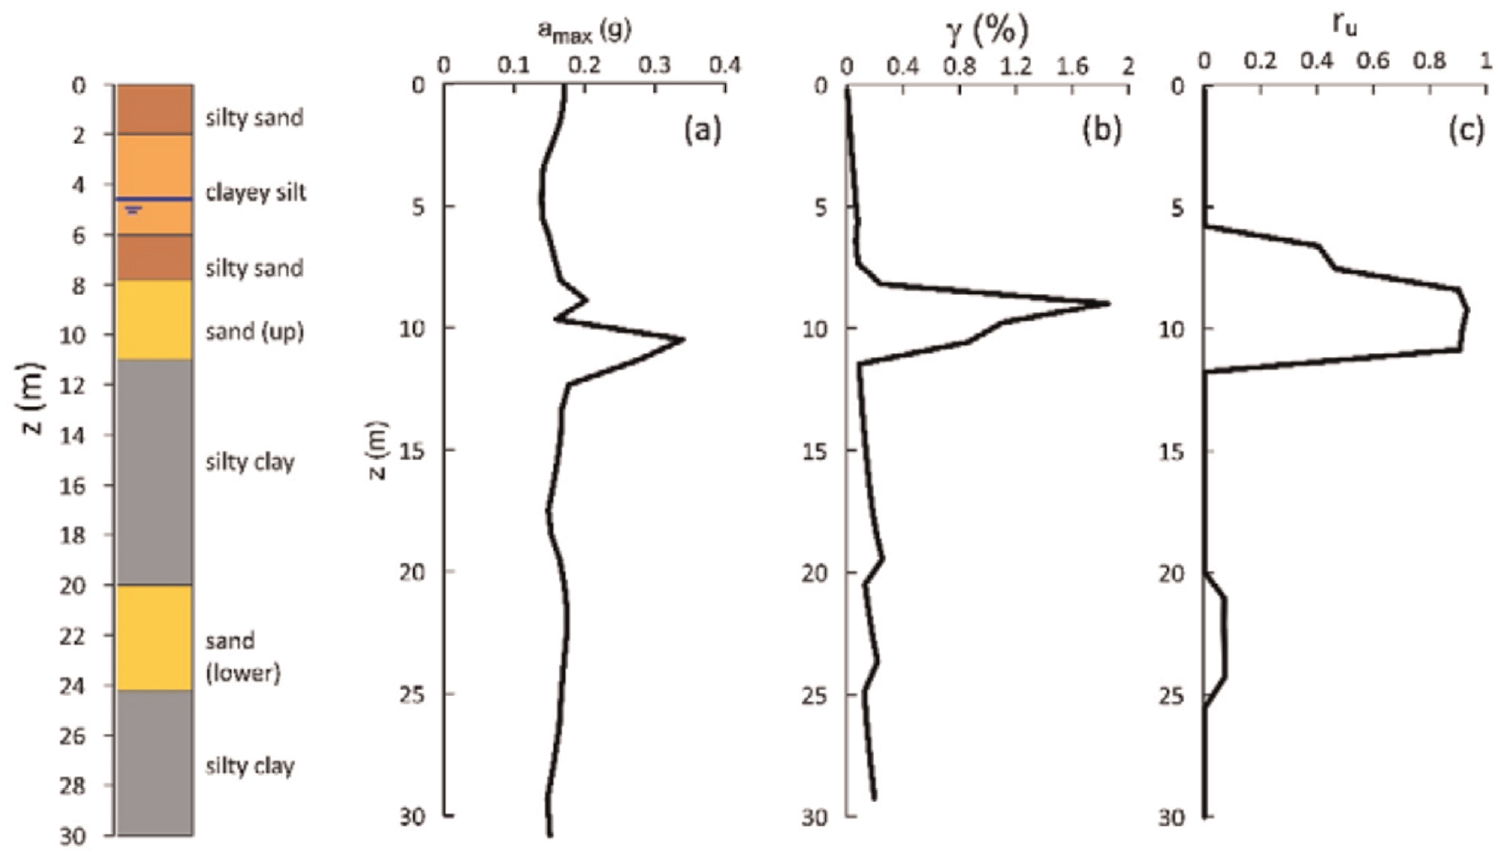
Example of 1D numerical analysis carried out in San Carlo, showing full liquefaction of the uppermost sand layer (sand(up)) (modified after Caputo et al., 2019).
This simplified assumption is realistic, since there was widespread evidence of liquefaction in the study area (Fioravante et al., 2013; Lai et al., 2015; Papathanassiou et al., 2015).
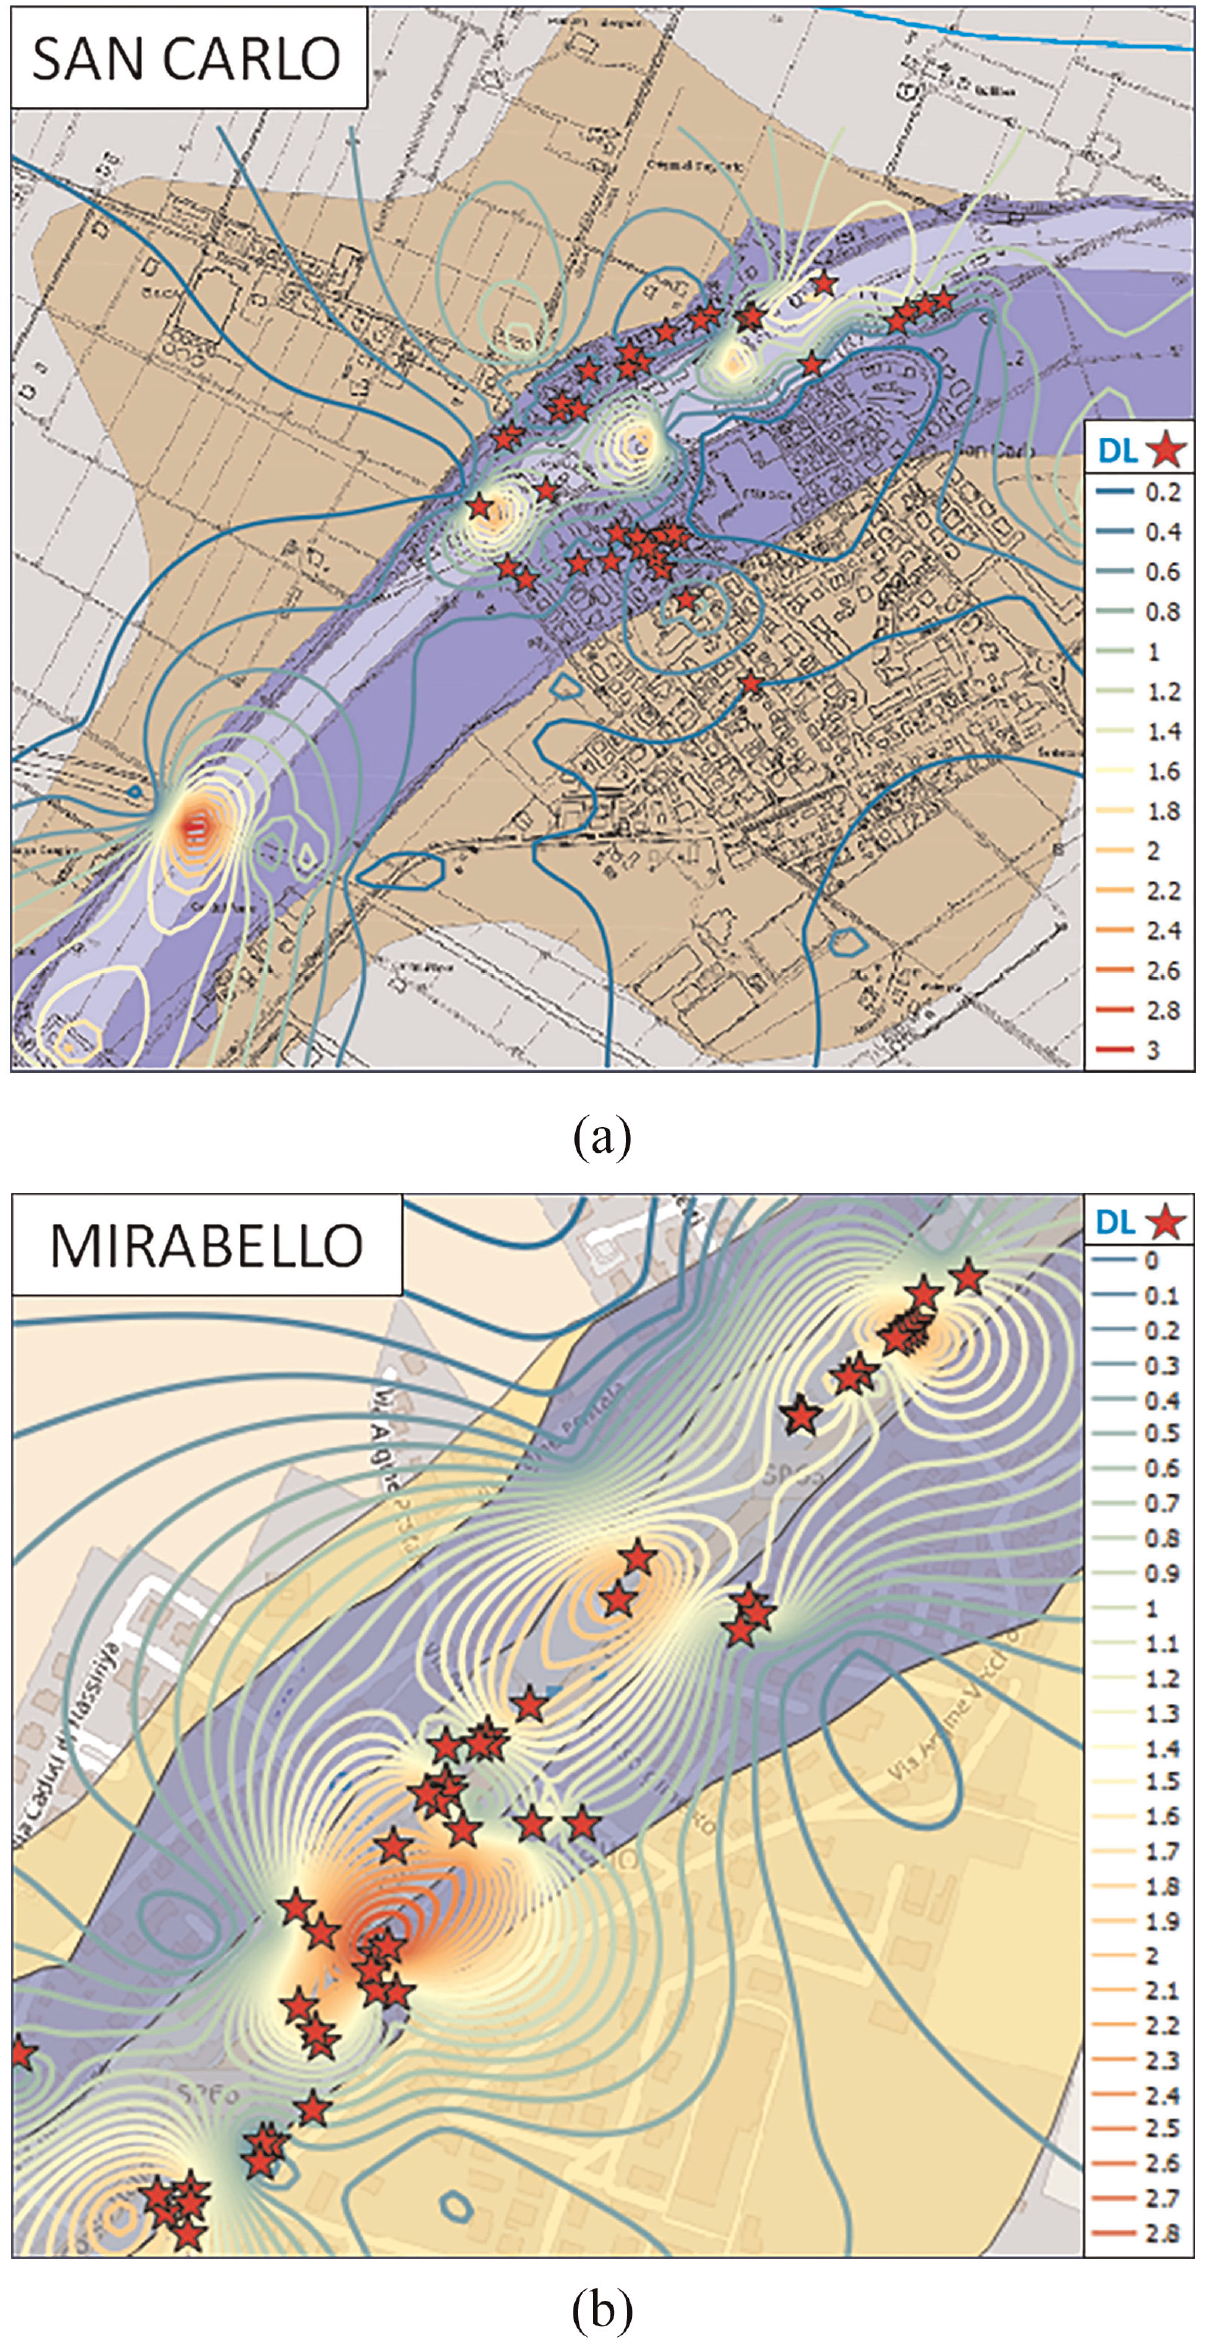
Figure 11 shows the minimum depth isolines of the first potentially liquefiable soil layer under the surface,
Minimum depth isolines of the first potentially liquefiable soil layer under the surface,
The spatial distribution of the thickness of the potential liquefiable soil,
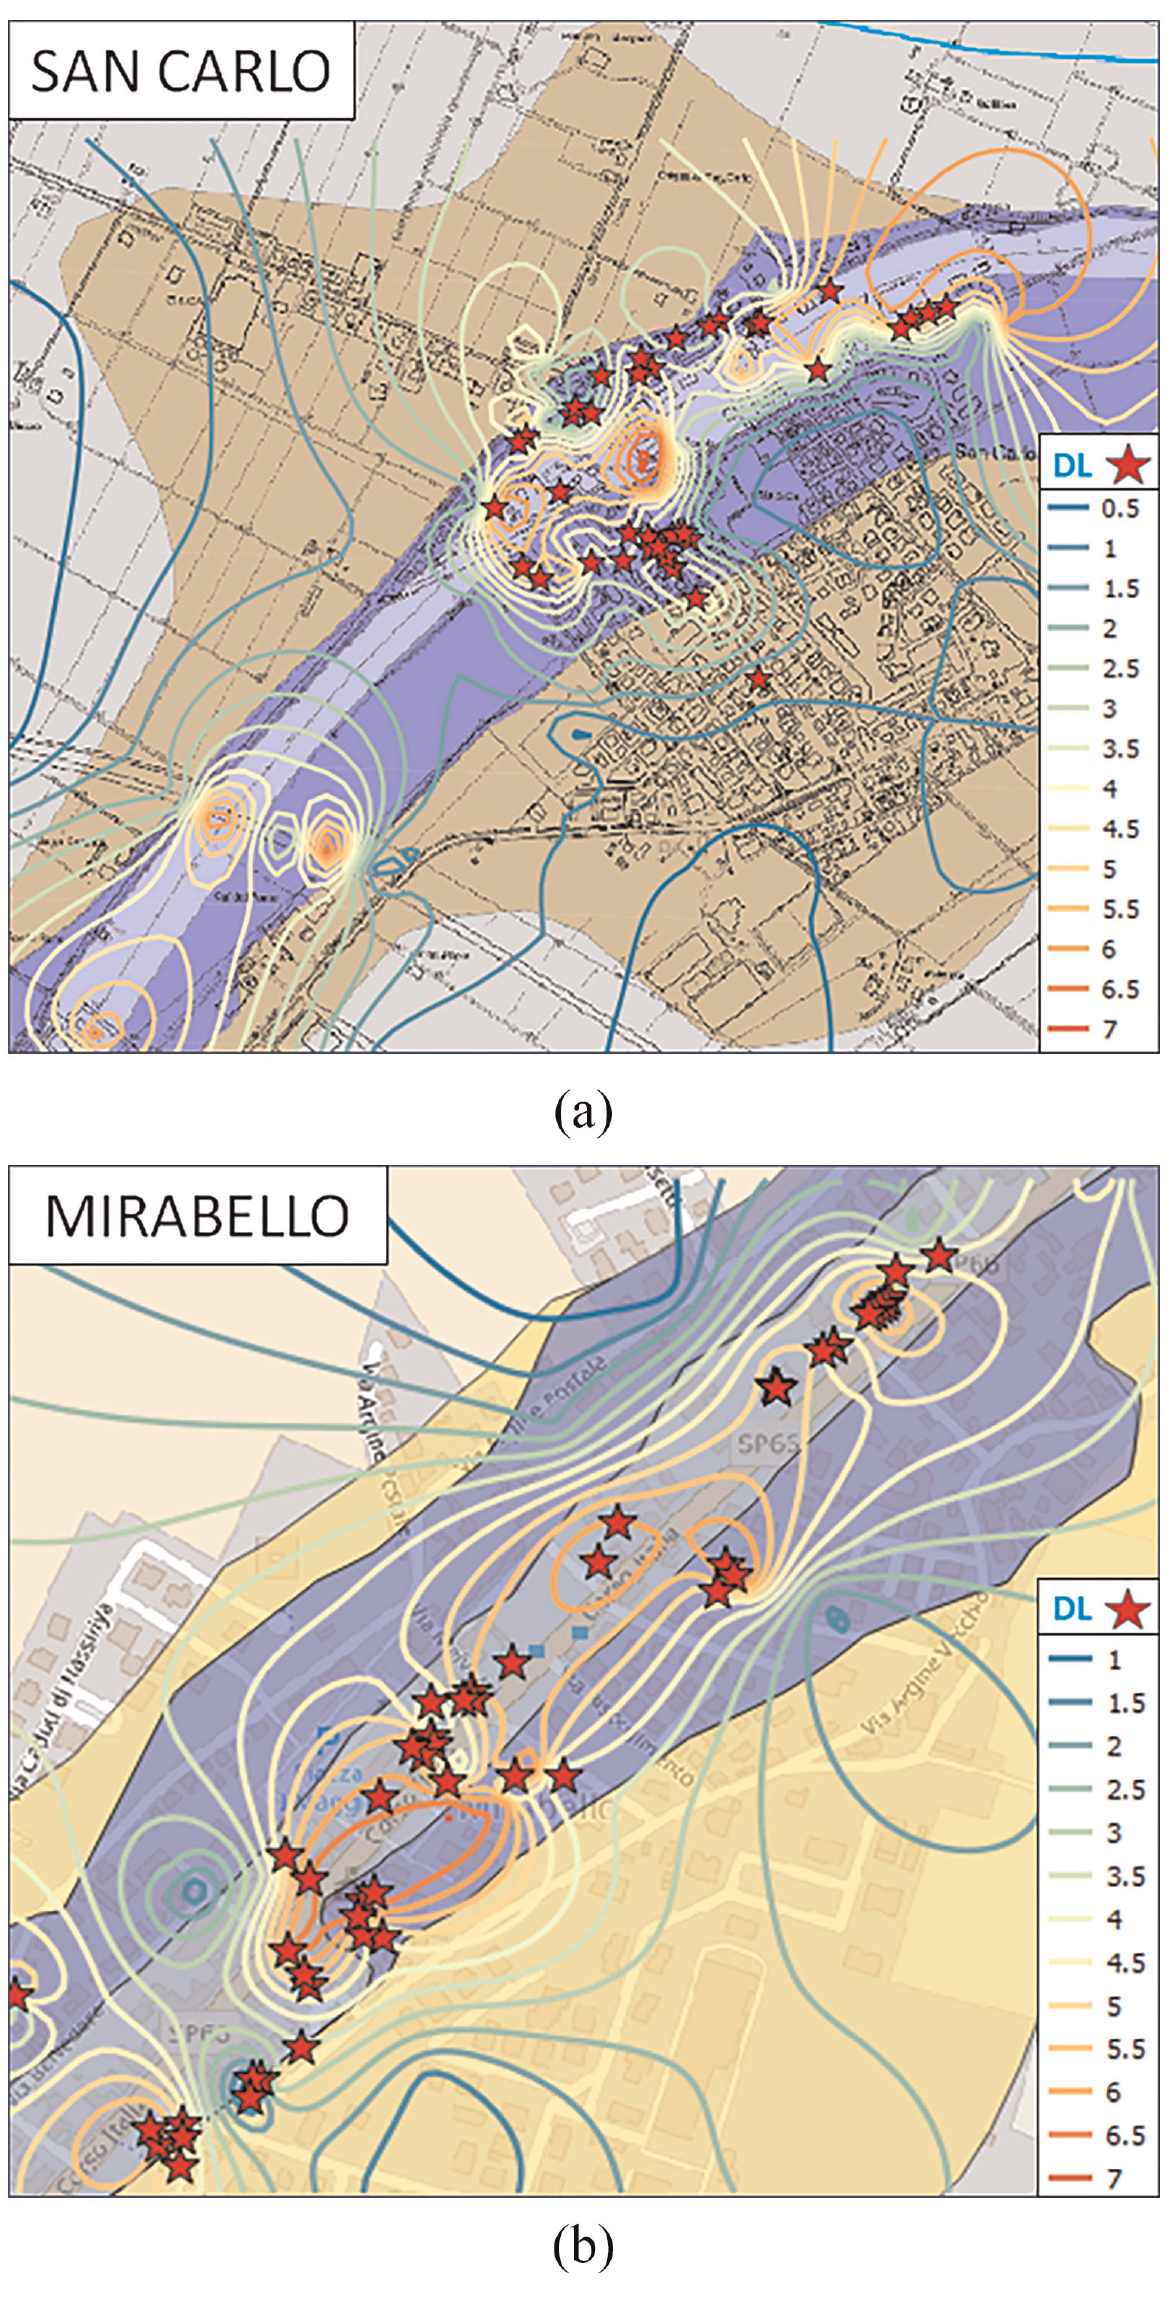
Thickness isolines of the potentially liquefiable soil,
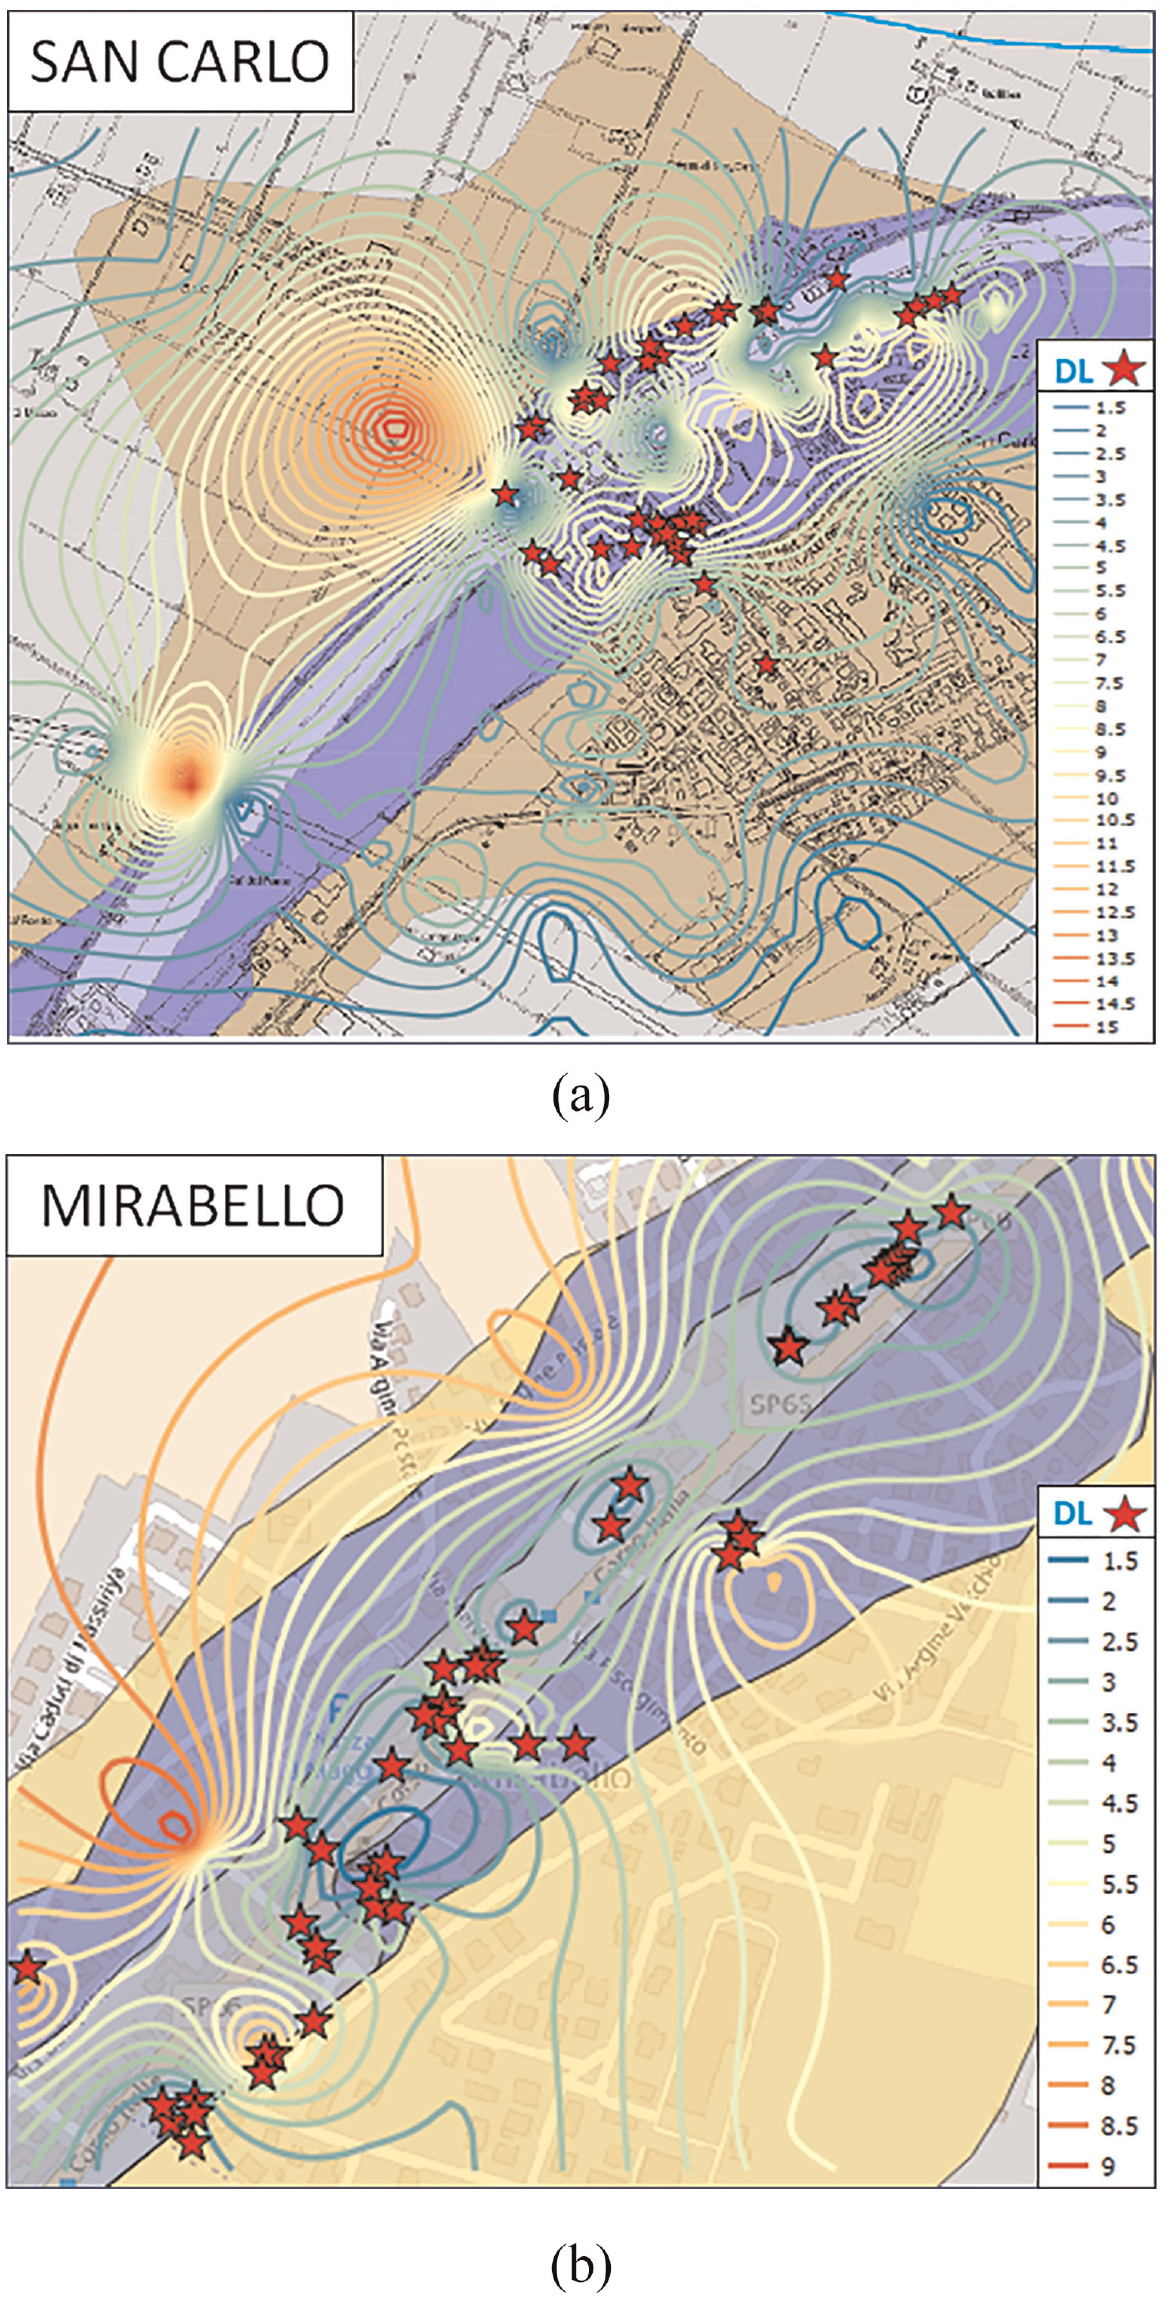
Finally, Figure 13 reports the spatial distribution of the proposed index, according to Equation 15, which is consistent with the geological setting and the observed damage. As a matter of fact, higher
IAM index isolines superimposed on the geological map versus the observed building damage induced by liquefaction (red symbols) in the municipalities of (a) San Carlo and (b) Mirabello.
Since the
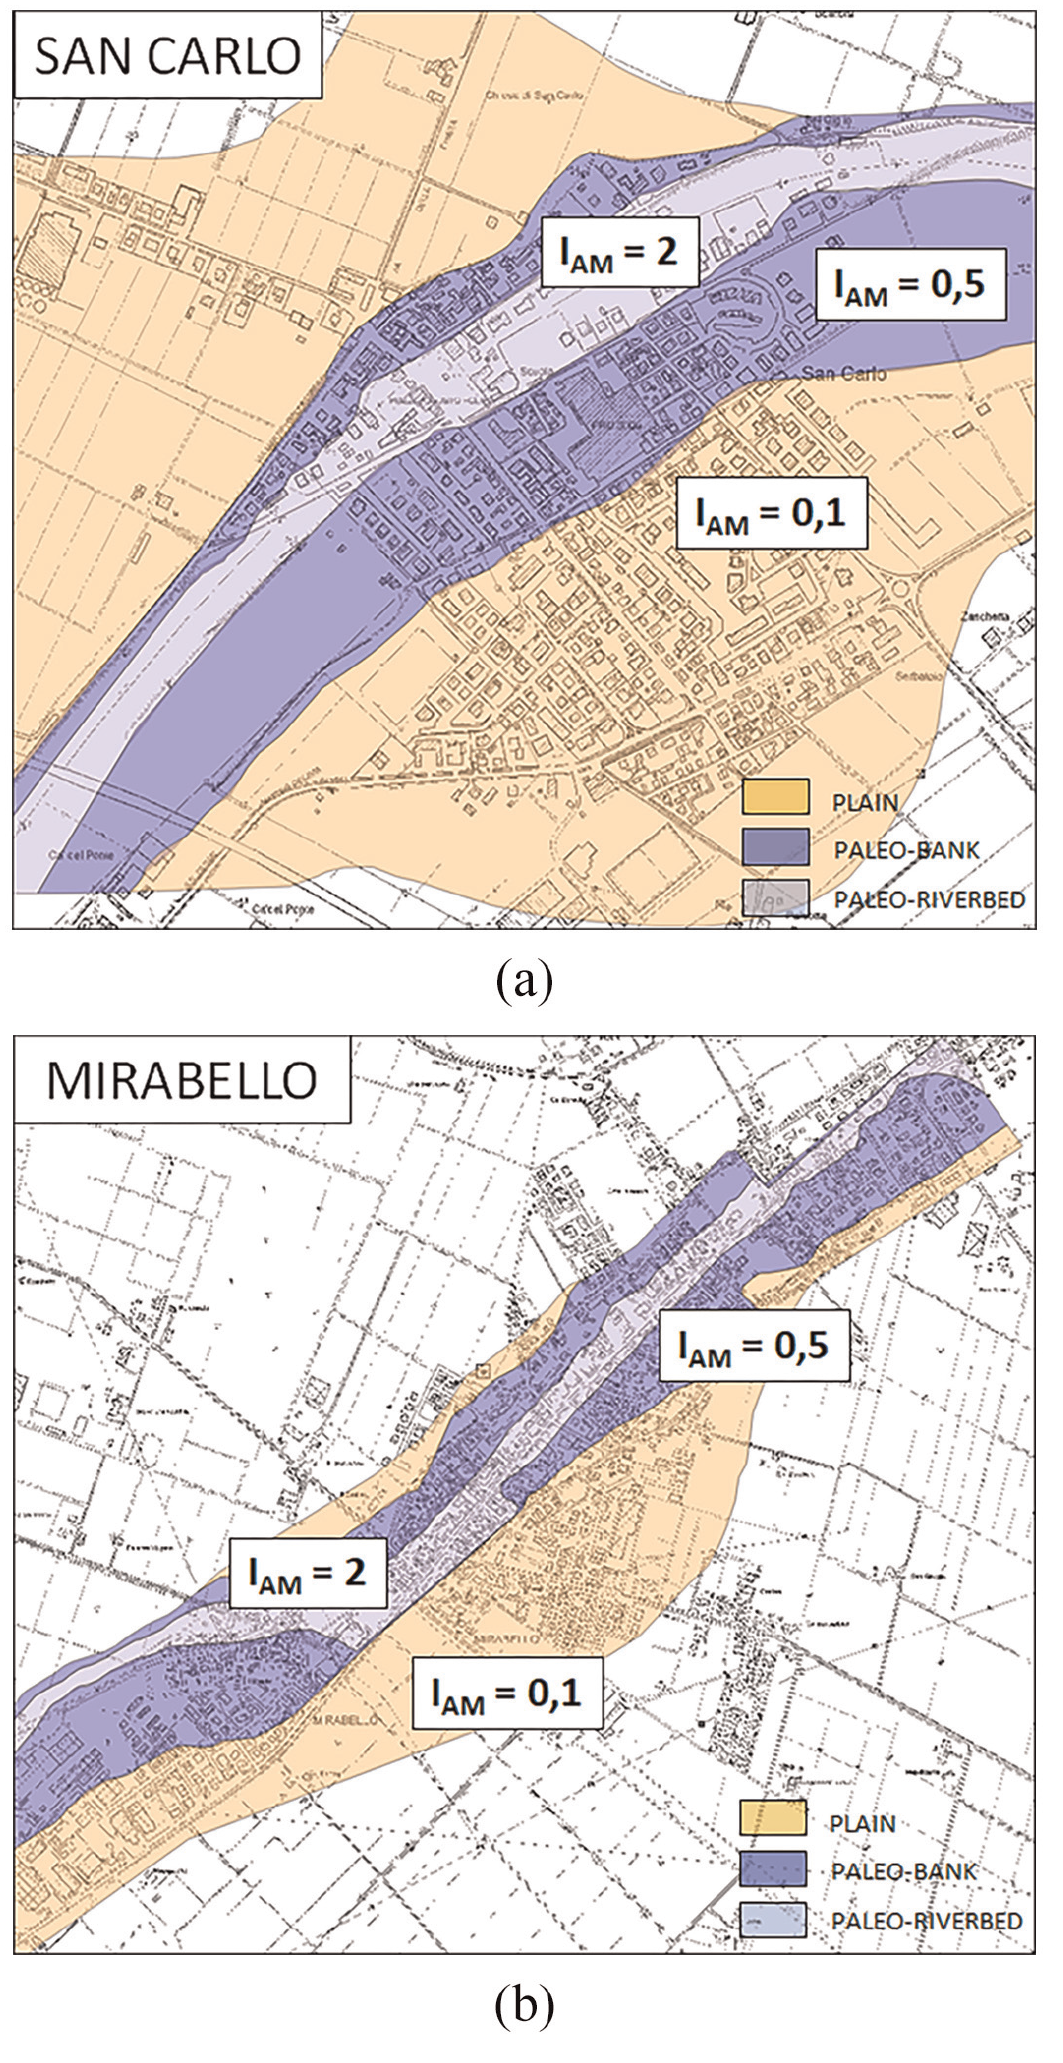
Geological map with IAM values adopted for the municipalities of (a) San Carlo and (b) Mirabello.
Liquefaction fragility curves
In this section, preliminary liquefaction fragility curves are derived according to the methodologies described above for the entire dataset of buildings (i.e. about 750 in the NDL and DL classes and about 350 with no damage). Figure 15 reports the fragility curves for the assumed functional forms and fitting methodologies. Table 5 sets out the values of the estimated parameters for each fragility curve. Due to the reduced amount of data, no reliable estimation of the fragility curves at DG4 and DG5 can be provided.
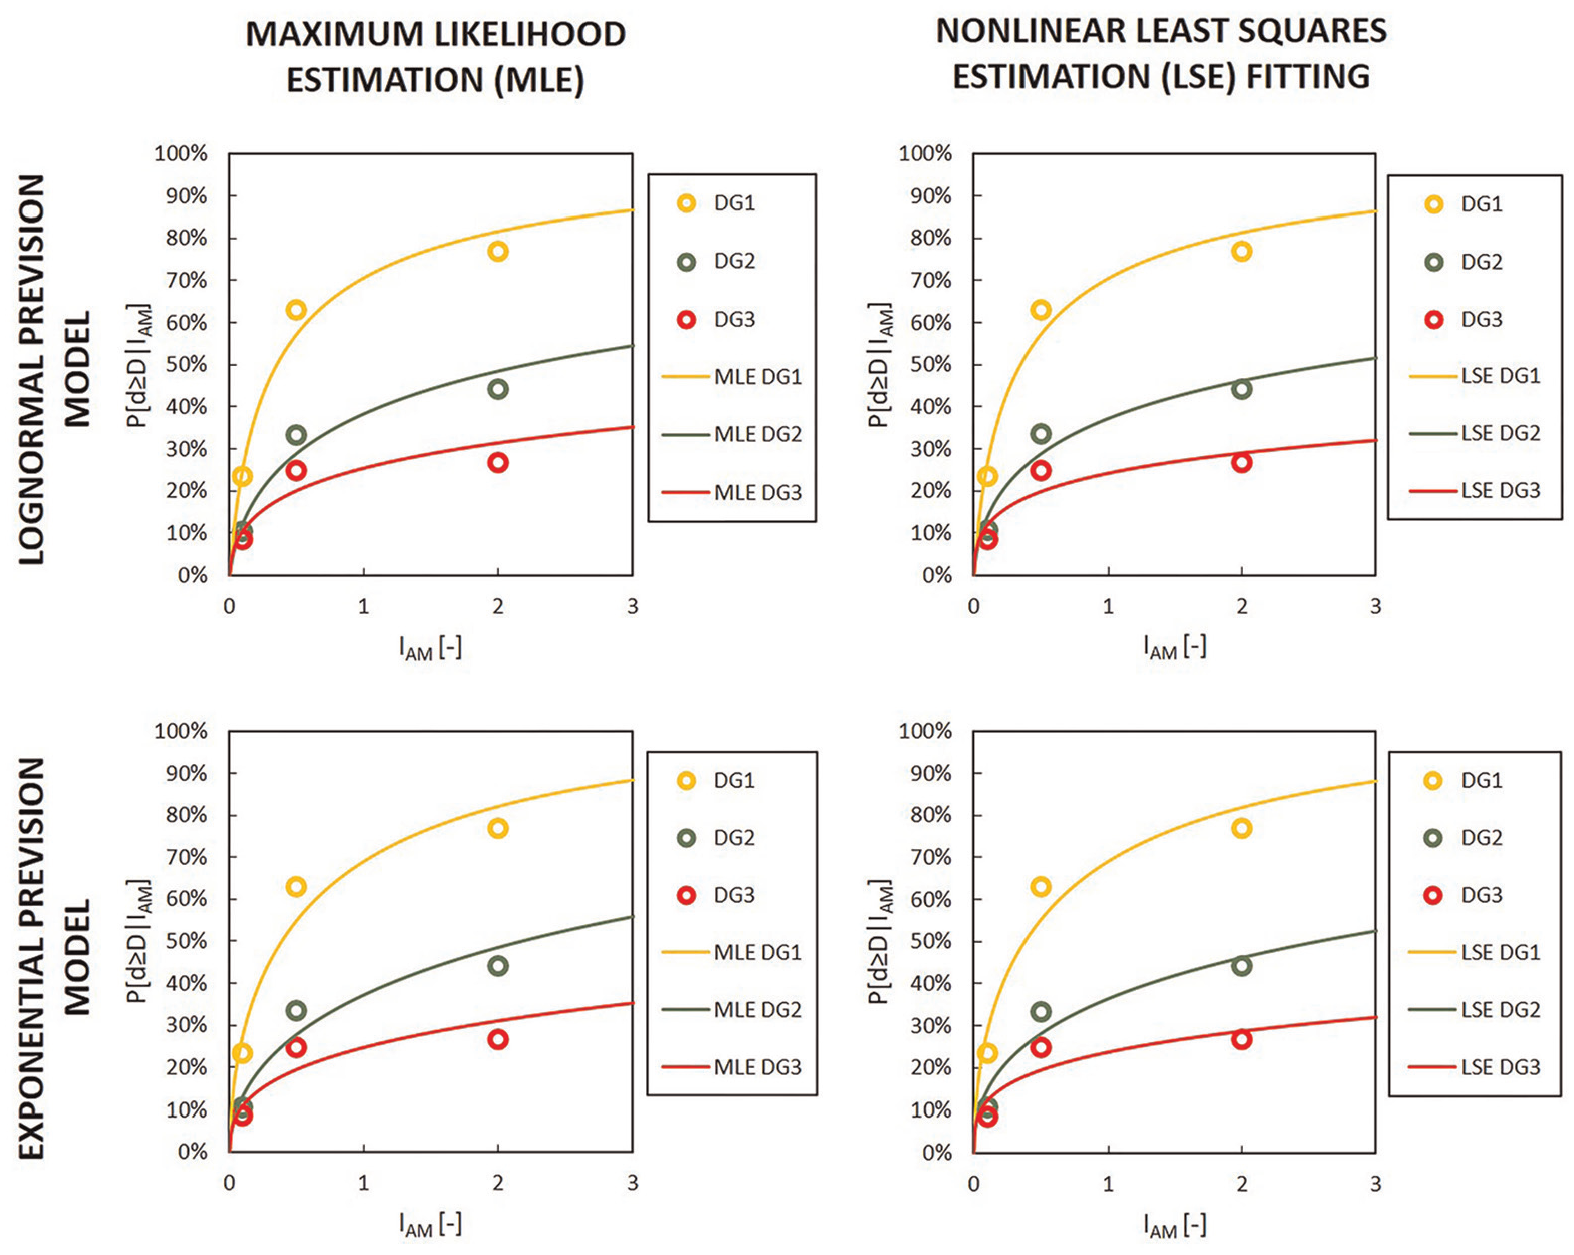
Lognormal and exponential fragility curves (solid lines) at different damage grades (DG) fitting observed fragility data (circles) for all the buildings and the adopted regression techniques (MLE and LSE).
Lognormal and exponential fragility curve parameters for the damage states considered
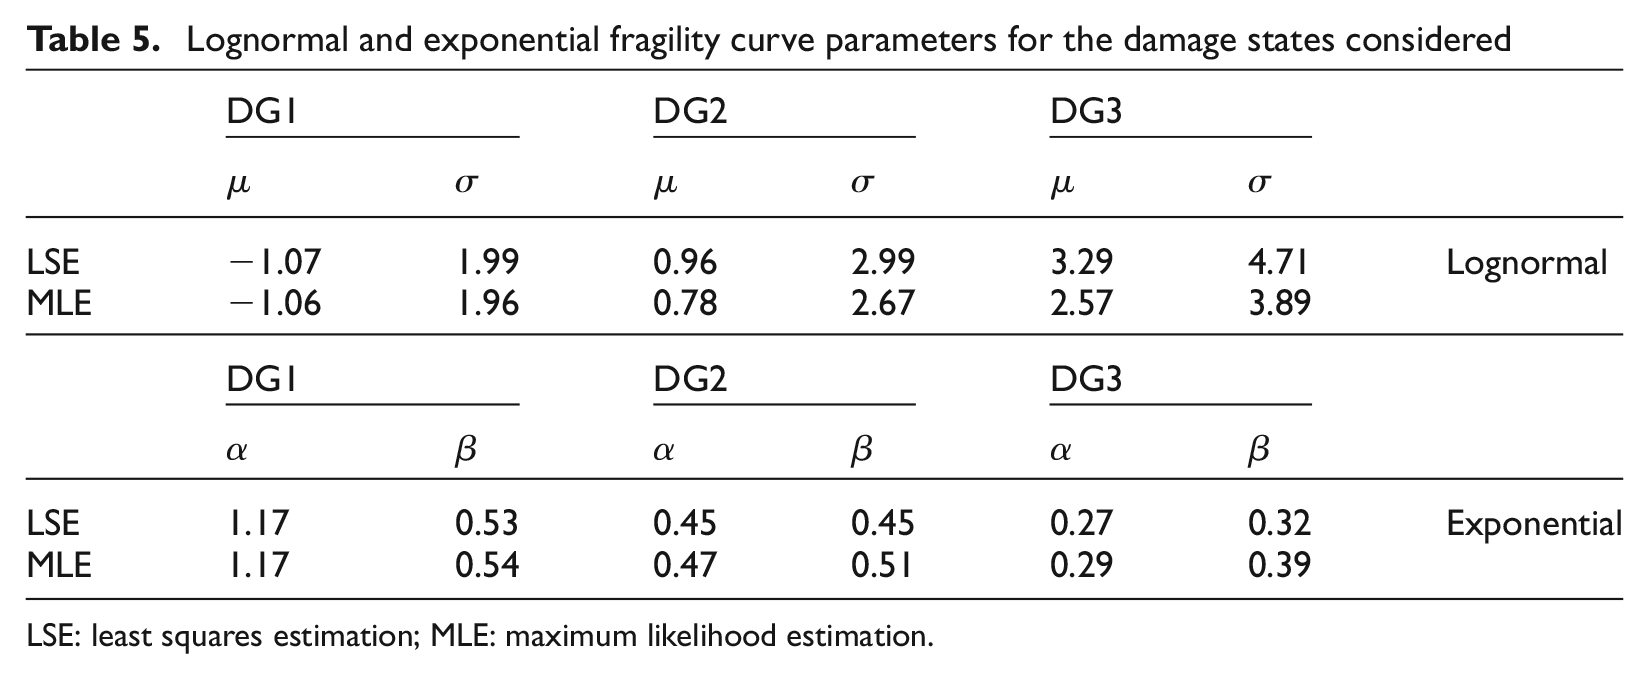
LSE: least squares estimation; MLE: maximum likelihood estimation.
Figure 15 shows that no significant difference is observed in the lognormal or exponential models. Strictly speaking, the advantages of using a functional form can be evaluated by comparing the values of: (a) the weighted sum of the square of the errors in the LSE methodology and (b) the likelihood in the MLE methodology, obtained by adopting the lognormal and exponential models. In both cases, the use of the lognormal model yields slightly better results, that is, a lower weighted sum of the square of the errors (with the LSE methodology) and a higher likelihood (with the MLE methodology).
Conclusion
The 2012 Emilia earthquake highlighted the large extent of the damage caused to structures and infrastructures due to soil liquefaction. The study presented herein investigated the effects of liquefaction on private residential masonry buildings using data on about 1000 structures located in several municipalities hit by the earthquake. According to empirical data collected immediately after the seismic event, it was possible to compare the behavior of structures whose soil foundation was not subjected to the liquefaction phenomena (the NDL class of buildings) with that of buildings that were (the DL class of buildings). The analysis of the damage in the DL class of buildings confirmed that, if immediately activated, liquefaction works as a natural isolation system against the transmission of inertial seismic actions on a superstructure; in these cases, the damage is mainly governed by the rigid rotation of buildings or settlements. However, liquefaction is often not immediately activated and this leads to a damage pattern that is characterized by both typical inertial damage (i.e. masonry walls overturning or in-plane cracks) and localized settlements (i.e. rigid rotation or one-way diagonal cracks).
The comparative analysis of the damage observed in the NDL and DL building classes has revealed evidence of the impact of soil liquefaction on structures. In particular, the empirical damage detected in the DL class of buildings was generally more severe than that sustained by the NDL class. The macro-parameters influencing the structural vulnerability of masonry buildings to inertial actions were less decisive in the evaluation of the global building damage caused by liquefaction. However, rigid horizontal structures confirmed their crucial role in limiting damage for both building classes. Using a model calibrated empirically to compute losses, the predicted repair costs were about 30% higher in the DL than in the NDL buildings.
The correlation between structural damage and soil liquefaction allowed to derive empirical fragility curves as functions of a new parameter (IAM), expressing the liquefaction demand because it is related to ground settlement and therefore to structural damage. Under the simplified hypothesis that the uppermost liquefiable layer is fully liquefied (i.e. ru =1), such a new liquefaction index can be calculated in a very straightforward way. In order to produce fragility curves to determine the probability of exceeding the DGs defined according to EMS-98, average values of IAM were attributed to different parts of the two analyzed villages, based on both in situ tests results and geological characteristics. Because of this simplification, in the next future a more detailed characterization of the villages will be done by carrying out more widespread in situ tests, obtaining therefore a more refined IAM mapping. Although the curves presented herein depend on the local context where the seismic event occurred, and further data from other events are required, they certainly represent a preliminary tool to predict losses in liquefaction-prone areas and to establish priorities and reconstruction policies for use in the aftermath of future earthquakes.
Footnotes
Acknowledgements
The activities reported in the article were carried out for the LIQUEFACT project and within the framework of the scientific agreements of the Department of Civil, Architectural and Environmental Engineering of the University of Naples Federico II and of the Consortium ReLUIS with the Emilia-Romagna Region. We would like to recognize the crucial role of the “Seismic and Soil Geological Service” and in particular of Dr Luca Martelli. We would also like to thank Mr Pietro Caputo for his undergraduate thesis on the research topic presented in the article and for his collaboration on the development of the analyses.
Author’s Note
Anna Chiaradonna is now affiliated with Department of Civil, Construction-Architectural and Environmental Engineering, University of L’Aquila, L’Aquila, Italy.
Declaration of conflicting interests
The author(s) declared no potential conflicts of interest with respect to the research, authorship, and/or publication of this article.
Funding
The author(s) disclosed receipt of the following financial support for the research, authorship, and/or publication of this article: This work has been carried out within the LIQUEFACT project. This project has received funding from the European Union’s Horizon 2020 research and innovation program under grant agreement No. 700748.