
Abstract
A novel seismic base isolation system has been developed for high-voltage (HV) porcelain post insulators. The seismic isolation device consists of two steel plates, four polyurethane springs, and a steel rod, which are low-cost components compared to the post insulators. Two alternative designs of the device are experimentally and numerically assessed in this article. A simple and robust numerical model consisting of linear line elements and nonlinear springs was generated, and subsequently validated using the experimental results. Incremental dynamic analyses (IDAs) were then performed to obtain fragility curves. Ten historical earthquake profiles, scaled to intensities between 0.1 and 2.0 g, were then applied to the numerical models. The fragility curves, generated according to the latest version of IEEE-693, demonstrate that the seismic isolation devices are highly effective in diminishing the base moment of the porcelain insulator. It should be noted that relatively large displacements at the top of the pole must be accounted for by ensuring adequate slackness in the flexible conductors.
Introduction
Strong earthquakes present serious risks for high-voltage (HV) post insulators in electrical substations. During the Wenchuan Earthquake (2008) in China, 90 substations with voltages of 110 kV and above were damaged and went out of service (Xie and Zhu, 2011). During the Chilean Earthquake (2010), the central interconnected system, which supplies electricity to more than 93% of the population, was damaged (Araneda et al., 2010). Porcelain post insulators are one of the most vulnerable units of substations. Several research activities have been undertaken in recent years concerning the vulnerability of the porcelain insulators and their seismic isolation.
Shake table tests and numerical validation of two identical 1100 kV Ultra HV porcelain bushings with different flanges were performed by He et al. (2019). They stated that damage on the flange plate is possible in addition to failure of the porcelain. Suggestions for further work included an investigation of the influence of grout between porcelain and metal flanges on the stiffness and seismic performance of the bushing. A similar observation was made by Gökçe et al. (2018), who stated that grout may affect the connection flexibility.
Kitayama et al. (2017) performed a probabilistic response analyses of seismically isolated and nonisolated electrical transformers. The performance was assessed by calculating the probability of failure as a function of multiple seismic intensities. The study demonstrated that seismic isolation reduces the probability of failure in comparison to nonisolated systems.
A simplified method was developed by Oliveto and Reinhorn (2018) to calculate fundamental frequency of transformer bushings. The bushings were modeled as cantilever beams with distributed mass and elasticity and an additional rotational spring was proposed to account for the flexibility of the cover plate.
Mohammadpour and Hosseini (2017) generated fragility curves for 63 kV post insulator by using 69 EQ records in 13 peak ground acceleration (PGA) categories. Two thresholds defined in IEEE-693 (1984, 2005) were utilized in the development of fragility curves. The lower threshold was suggested for assessment of existing substation equipment, which are lacking proper engineering design.
Zareei et al. (2016) generated seismic fragility curves for a 400 kV power transformer. They considered three states of damage, namely minor, moderate, and severe, which were determined from 5%, 25%, and 50% of the ultimate stress, respectively. Since the severe damage state was not acceptable for the power transformer bushing, the fragility curves were developed for minor and moderate damage states. It was concluded that specific seismic consideration is necessary for power transformers in seismic regions (PGAs ≥ 0.5 g). The authors suggest application of base isolation, dampers, and/or retrofitting the porcelain bushings.
Moustafa and Mosalam (2016) demonstrated the sub-structuring concept in seismic qualification testing of 550 kV disconnect switches. The full and sub-structured switches were tested on the shake table. The behavior of the post insulators of the switches were compared to demonstrate validity and identify limitations of the sub-structuring concept. For post insulators in switches supported on flexible structures, the critical degrees of freedom were identified.
Wen et al. (2019) developed fragility curves for two types of disconnect switches with porcelain post insulators (230 and 550 kV). The fragility curves as presented could then be readily applied for regional risk assessments and reliability analysis of power grids. The finite element models, which were used in nonlinear incremental dynamic analyses (IDAs), were validated by the experimental results. System fragility curves were generated for PGA and peak response acceleration at two different intensity measures (IMs). It was found that PGA-based fragility curves highlighted the effects of ground motion characteristics and operational configurations. It was stated that simplified models could be used to represent the linear response of insulators until the sudden brittle failure occurs for fragility assessment. However, detailed nonlinear models are needed to establish accurate system and individual component fragilities, and identify the most critical insulators in different operational configurations.
This study investigates the potential of low-cost seismic isolation devices for HV porcelain insulators to mitigate critical damage to substations following seismic events. The challenge in designing such devices is to find a practical solution which both reduces the stress level in the porcelain and limits excessive displacement at the top of the pole, which may affect serviceability. The preliminary test results of PSID can be found elsewhere (Gokce et al. 2017 and Gokce, 2019). The methodology consists of shake table tests and the corresponding finite element modeling efforts. The efficacy of two alternative design of the device are discussed based on the fragility curves generated according to IEEE-693 (2018).
The seismic isolation device and the performance tests
Description of the seismic isolation device
The polyurethane seismic isolation device (PSID) consists of four polyurethane springs that are positioned between two circular stainless-steel plates, as shown in Figure 1. A steel tension rod (M14,12.9 quality) connects the two plates at their centers, applying a prestress to the springs. The polyurethane springs are located in the cavities created on the steel plates. The depth of the cavities, which transfer shear forces between the upper and lower steel plates, and the prestressing force were determined during the preliminary design phase. Pre-compression load of 17.5 kN was applied to the polyurethane springs, which generated an initial strain of 16.5%. Given a 3% strain relaxation was assumed for long-term creep (MCEER-06-SP07).
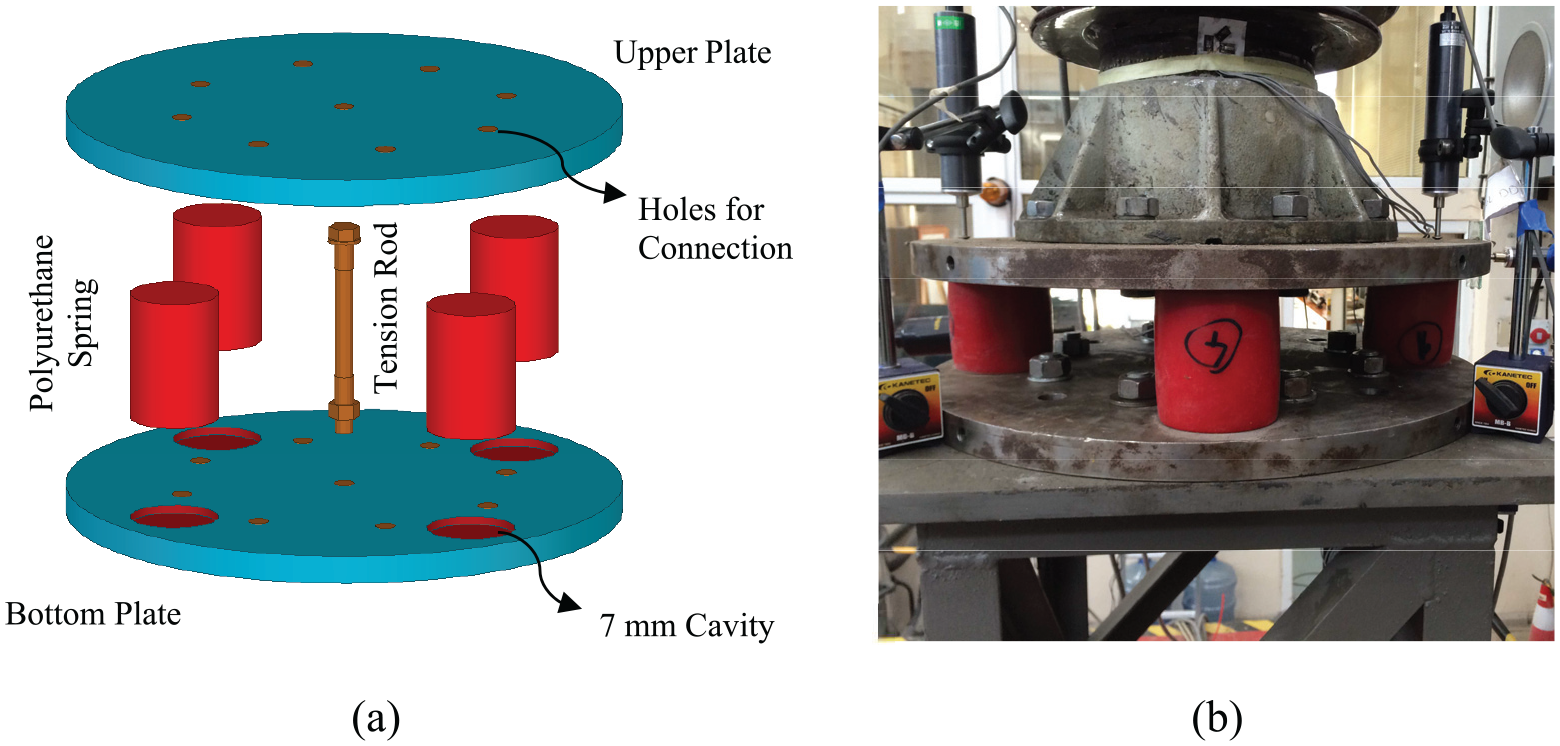
PSID device: (a) Extrude view. (b) Real application.
In the current practice, porcelain insulators are supported on steel truss with varying geometry and stiffness properties. Independent suppliers may provide the components. Dependently, the supporting truss is mostly not accounted in the design stage of porcelain insulator. PSID to be placed between steel truss and post insulator gives an occasion to tune stiffness and damping properties of the system and reduces the seismic responses. Yang et al. (2019) performed numerical analyses of seismic isolation systems; namely, rotational base isolation, horizontal base isolation, and middle isolation, based on ultra-high voltage (UHV) composite bypass switch. It is concluded that rotational middle isolation, which has similar concept with PSID, can significantly reduce seismic responses.
Description of the test specimens
The seismic performance of two different PSIDs, referred to as GEO-1 and GEO-2, is examined in this article. The geometry of each design is presented in Figure 2. Lc, which corresponds to distance between centers of polyurethane springs and the device, is a key parameter to control both stiffness and damping properties of the entire system.
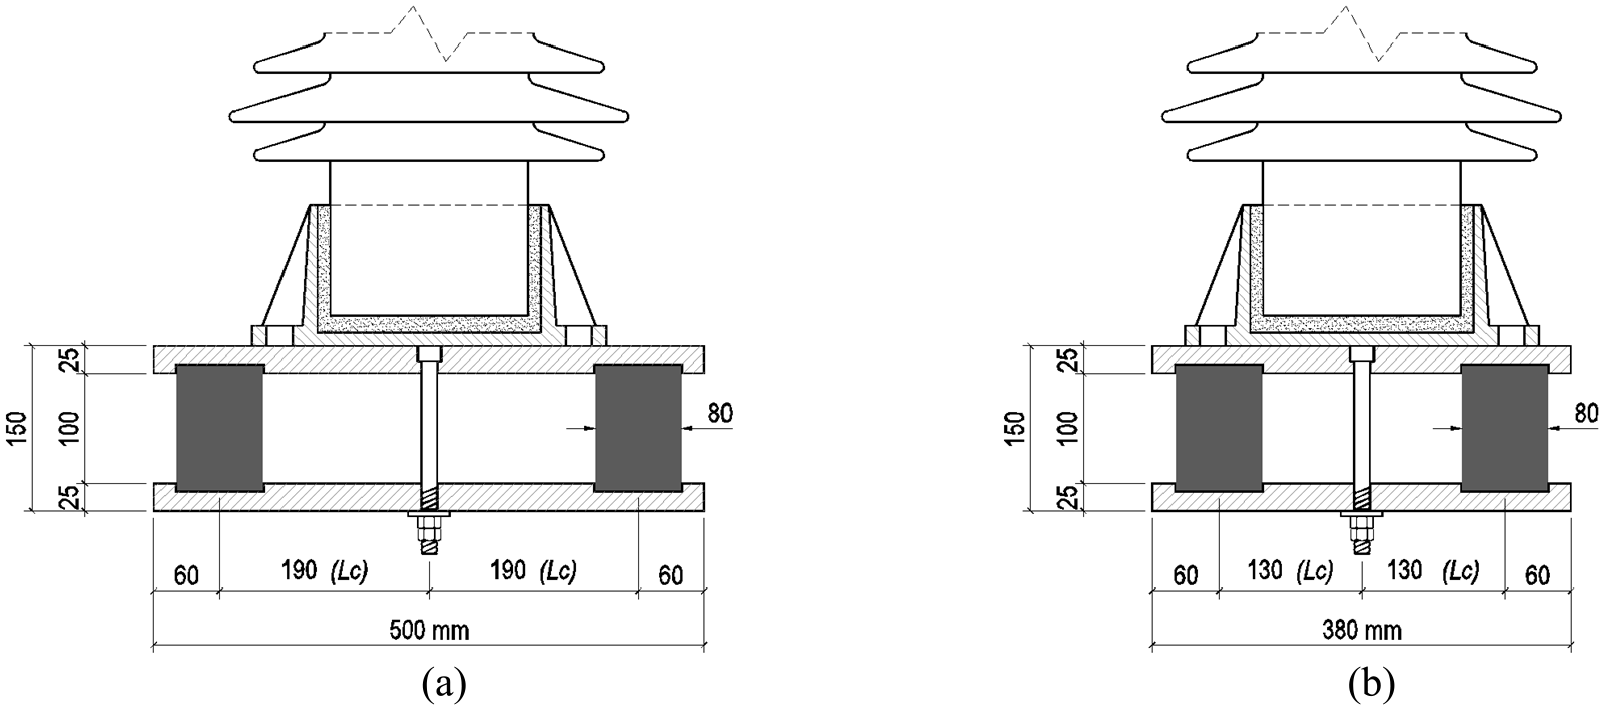
PSID sectional dimensions: (a) GEO-1. (b) GEO-2.
Polyurethane springs have elastic deformation capability up to 30% of its initial height (hi) which is 125 mm in GEO-1 and GEO-2 design. Because of 16.5% initial strain is applied in pre-compression phase, the maximum operational tension/compression strain
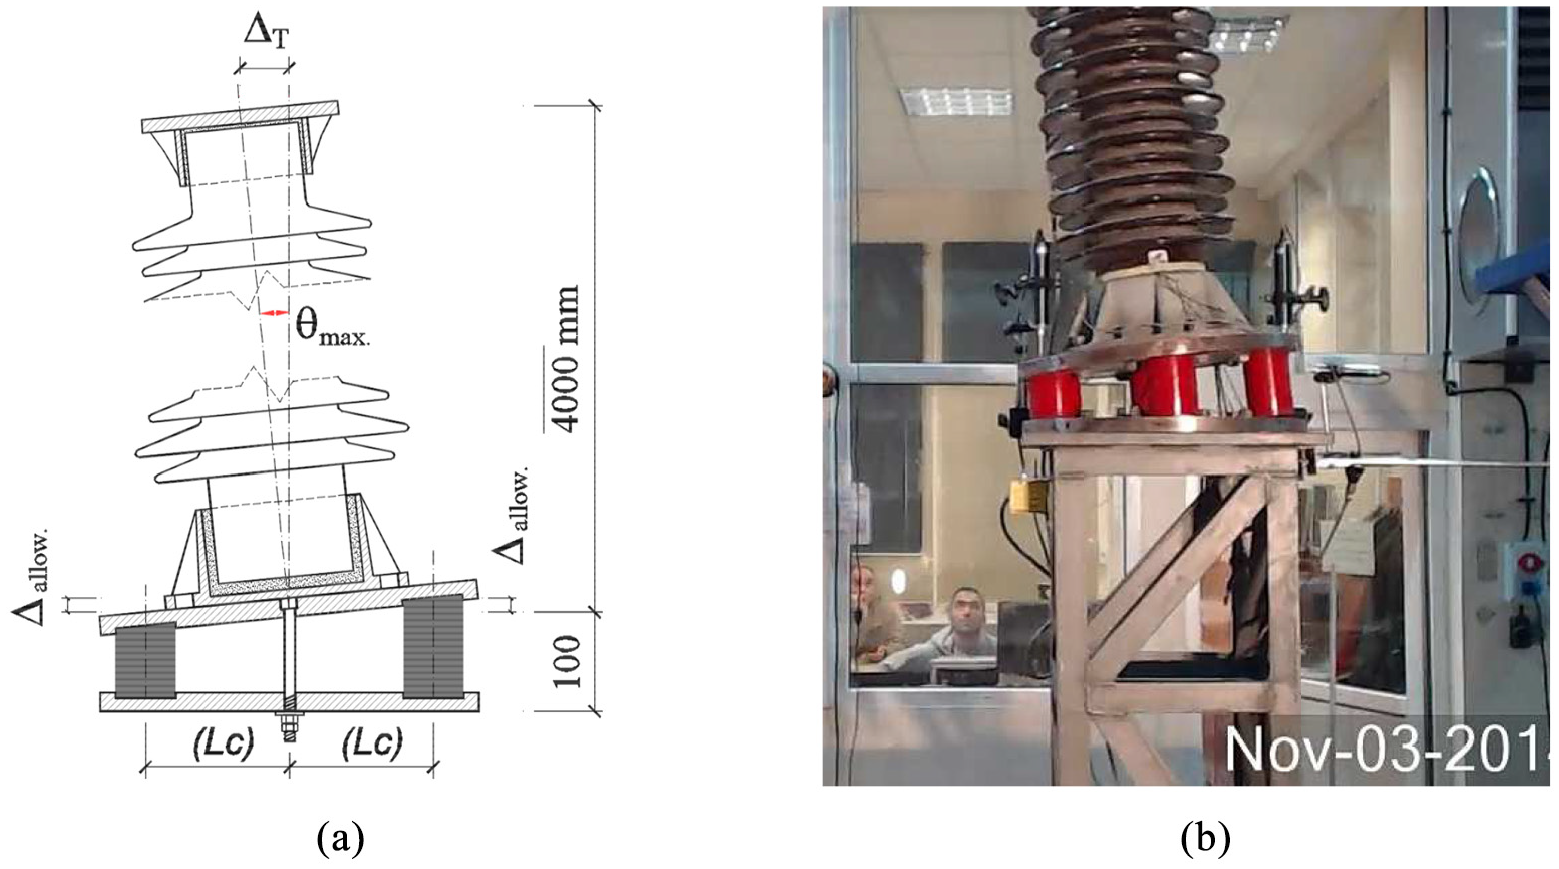
Deformation of PSID: (a) Schematic view. (b) Instant video image at peak displacement during the shake table excitation.
The top displacement
A 550 kV HV post insulator and its steel support were used to conduct the experimental studies. The HV post insulator comprised three posts. The bottom post (S1) was 1.10 m with a weight of 1.43 kN, the middle post (S2) was 1.40 m with a weight of 1.49 kN, and the top post (S3) was 1.50 m with a weight of 1.46 kN. The solid core diameter of the porcelain insulator is decreasing gradually from bottom (180 mm) to top (140 mm), Figure 4.
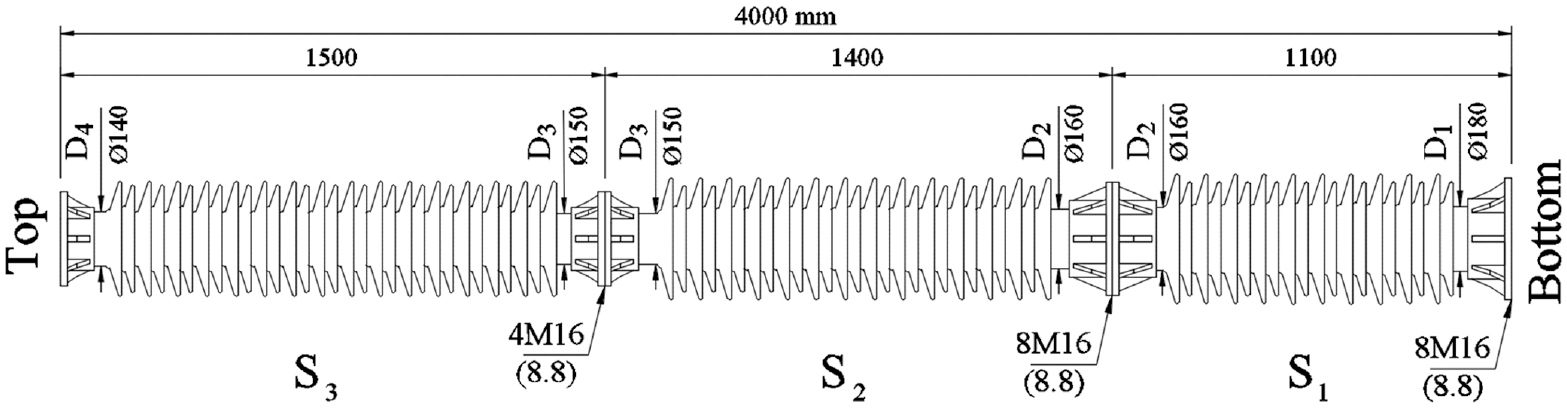
Dimensions of 550 kV post insulator.
The GEO-1 and GEO-2 devices were subsequently positioned between the steel support and 550 kV HV porcelain post insulator. Gökçe et al. (2019) gives full description of the fixed connection between the porcelain insulator and steel support.
The post insulator has a supporting truss made of 50.50.5 angle profiles, similar to the common practice. Overall height of the steel support is 0.92 m and upper plate thickness is 20 mm with a plan dimensions of 500 × 500 mm. The distance between the legs is 350 mm. Post insulator and PSID were connected to the support structure by eight M16 (grade 8.8) bolts, and the truss was connected to the shake table with four M20 (grade 8.8) bolts, Figure 5.
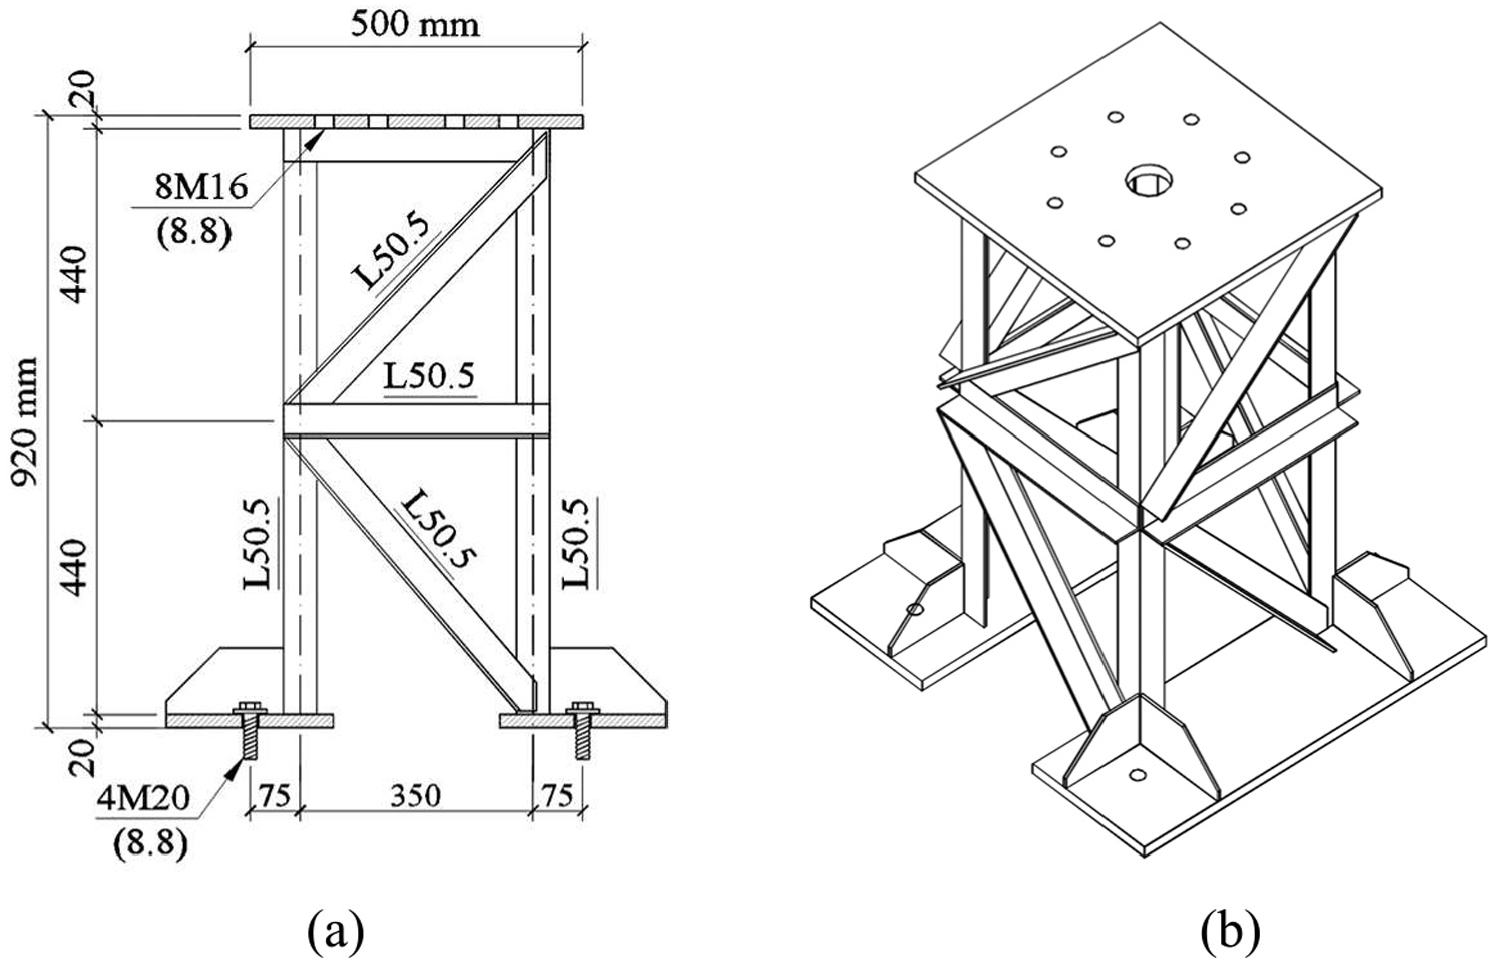
Sketch drawings of the steel support structure: (a) Side view. (b) Perspective view.
Quasi-static test of the 550 kV post insulator
A 550 kV post insulator which consists of three insulating columns connected by steel flanges was tested in two phases as specimen #1 and specimen #2 to determine failure mechanisms and collapse loads. Specimen #1 composed of the bottom (S1) and the middle (S2) insulating columns with 2.785 m total height. Specimen #2 is the top insulating column (S3) with 1.785 m total height. Base moment/share force ratio is the distinctive feature of the specimens. Comprehensive information about quasi-static test results with those of the refined finite element (FE) model can be found elsewhere (Gökçe et al. 2018). The testing protocol which is based on the expected ultimate drifts was selected in accordance with the recommendations of FEMA-461 (2007). The displacement histories were imposed at the top of the specimen as two cycles at each amplitude level to determine both the stiffness (e.g. elastic modulus) and the strength of porcelain elements. Quasi-static test setups are shown in Figure 6.
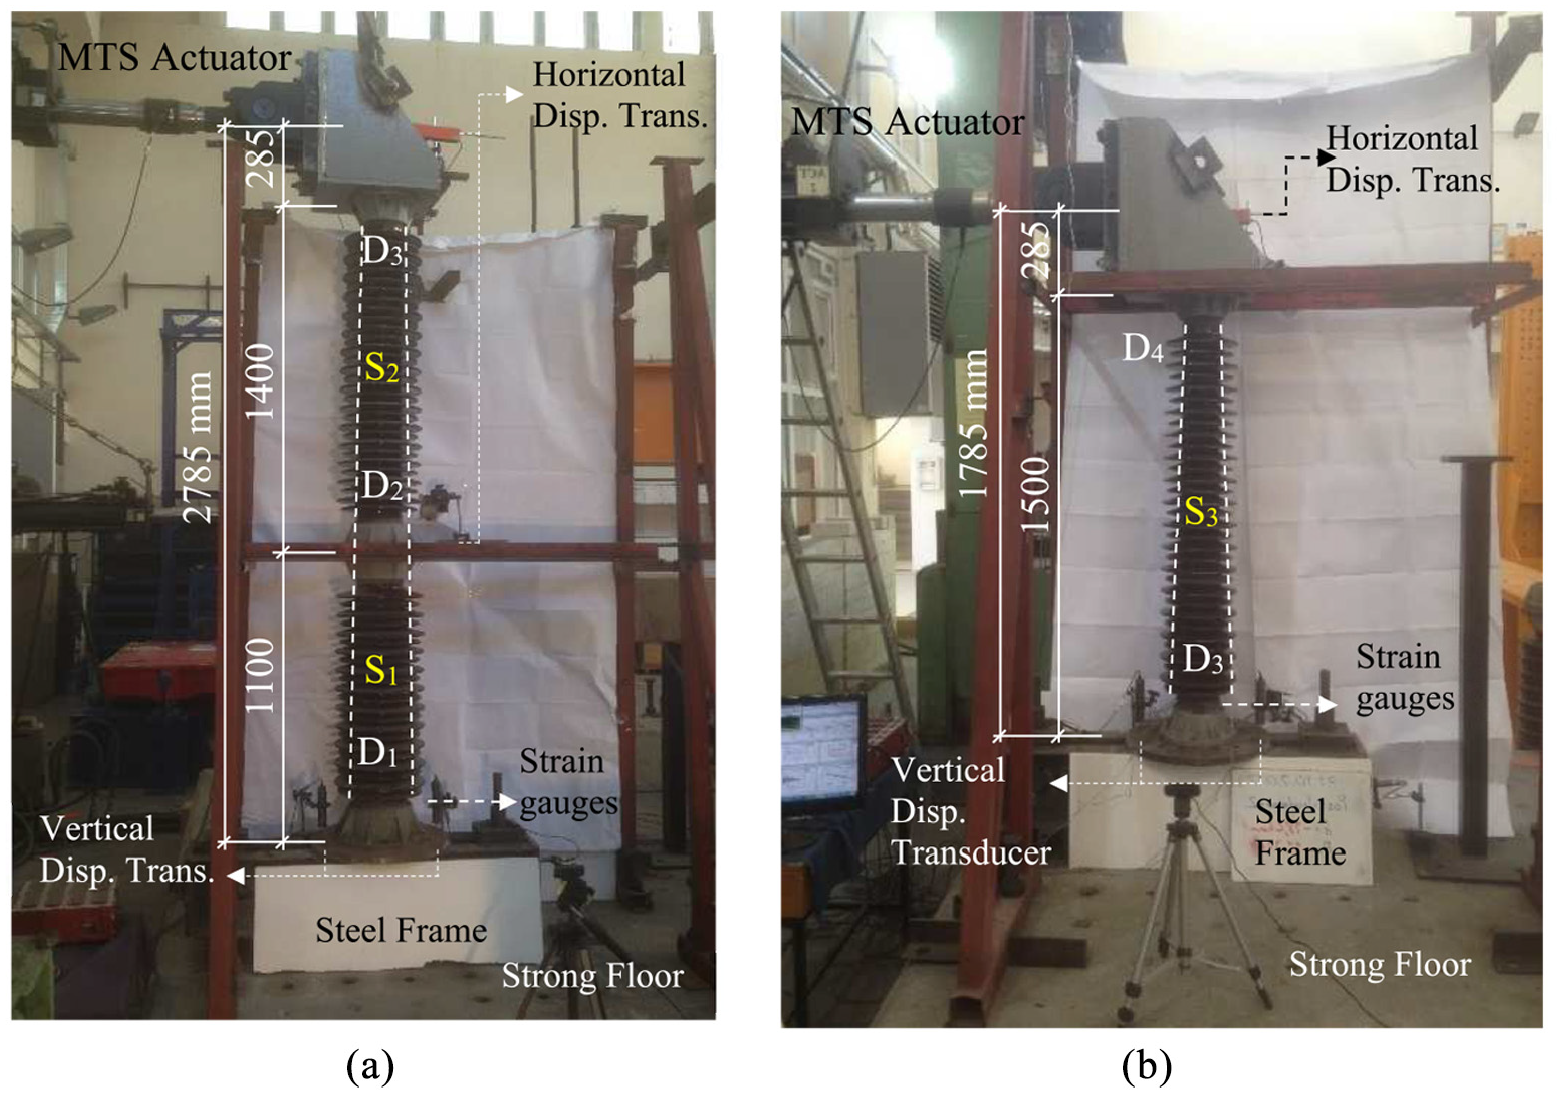
Quasi-static test setups: (a) Specimen #1. (b) Specimen #2.
The quasi-static test displayed a progressive failure of the porcelain-steel flange joint at bottom section of S2, Figure 7a. This occurs mainly in elements where the porcelain-flange joint is made with a low-strength mortar (Gökçe et al., 2018; Paolacci et al., 2014). On the contrary, Figure 7b shows the fragile failure occurring at the base section of S3 due to a premature failure of the porcelain than the other components.
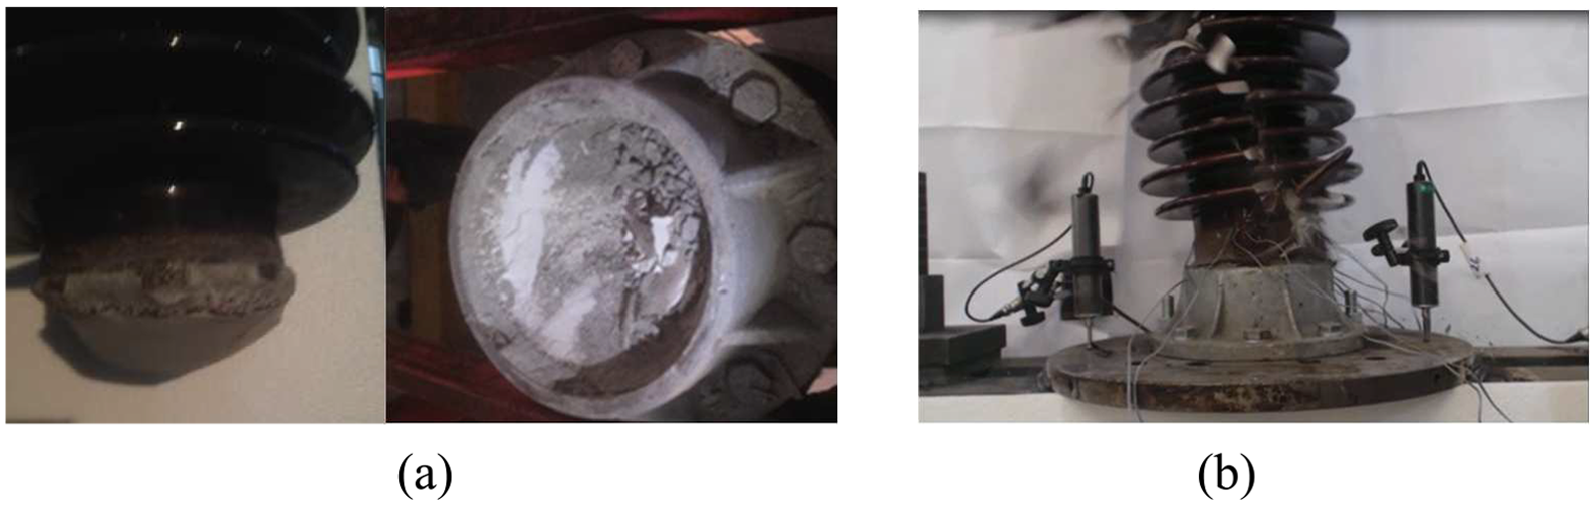
Failure mechanisms of the porcelain insulators: (a) Specimen #1. (b) Specimen #2.
The measurements from quasi-static experiments of porcelain insulators were used to determine elastic modulus and strength of the porcelain. Ultimate stress of the porcelain was computed from Equation 1 where M is bending moment at failure load and W is the section modules of each insulating column at bottom core location. Modulus of elasticity of porcelain was calculated from Equation 2 whereas stress


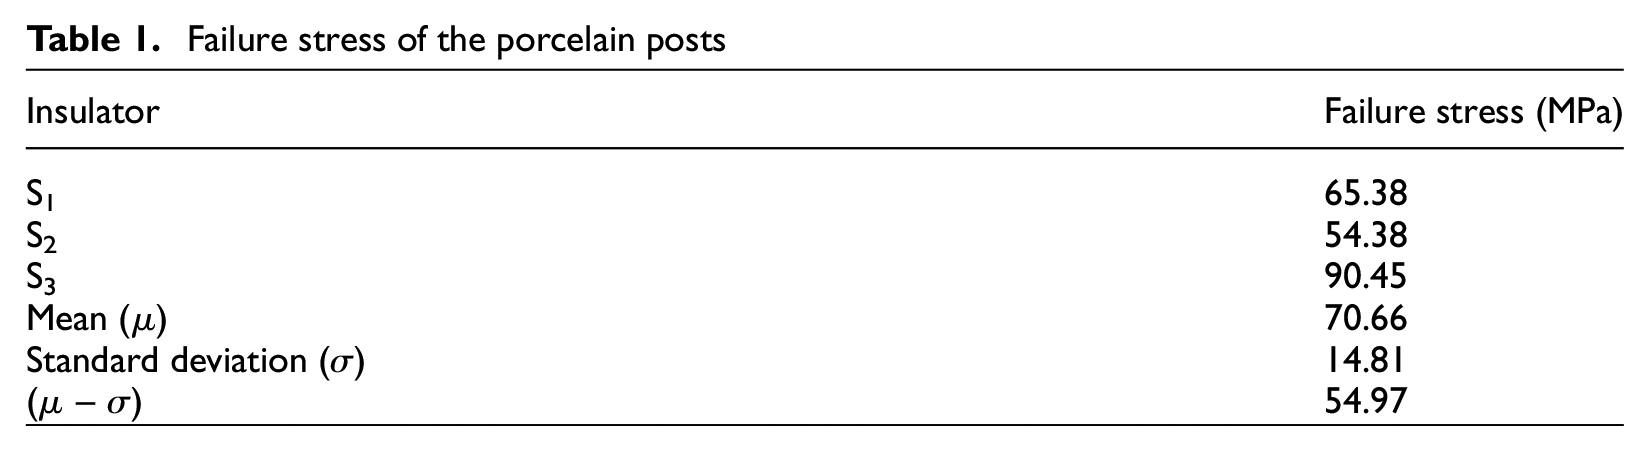
Elastic modulus of the porcelain is computed as 125.668 and 123.061 MPa for specimen #1 and specimen #2, respectively. Failure stresses of the porcelain were computed as 65.38, 54.38, and 90.45 MPa for S1, S2, and S3 insulating columns, respectively (Table 1). Two distinctive failure mechanism of specimen #1 and specimen #2 are the root causes of high standard deviation in failure stress. The ultimate stress computed as “mean – one standard deviation” is
Failure stress of the porcelain posts
Free vibration characteristics
Impact hammer and pullback test methods were applied to determine the dynamic characteristics of the test specimens. Pullback tests were performed for four different top displacement intensities. The logarithmic decrement method was applied to obtain damping properties of the specimens from the recorded top acceleration histories. The variation of frequencies is shown in Figure 8. The fixed-base test case is taken as the baseline result for the GEO-1 and GEO-2 comparisons.
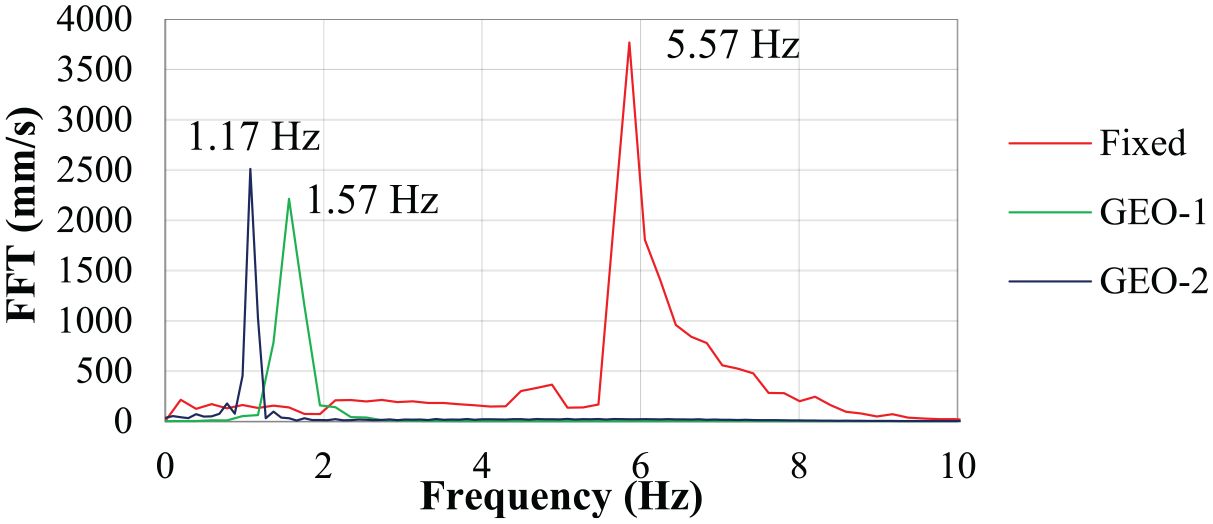
First natural frequencies of each specimens.
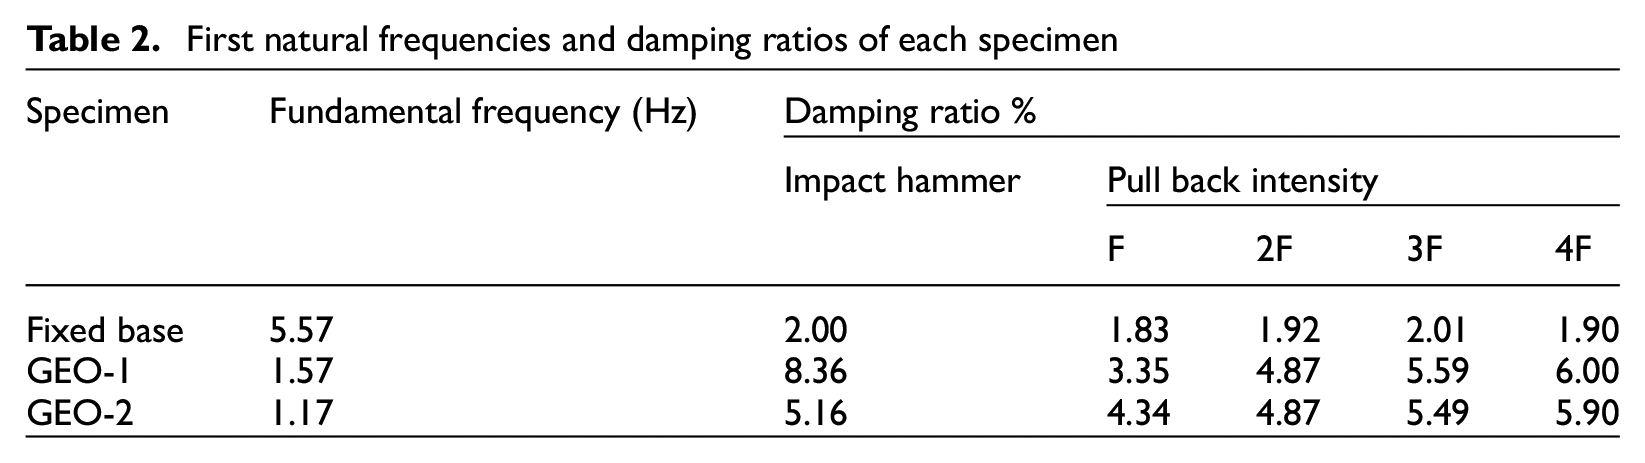
The fixed-base system had a damping ratio of 2%. In the isolated systems, the damping ratio was proportional to the applied displacement intensity. The damping ratio varied between 3% and 8% for GEO-1 and 4% and 6% for GEO-2. The fundamental frequency and damping ratio of each system are presented in Table 2.
First natural frequencies and damping ratios of each specimen
Strong ground motion data
IEEE-693 (2018) proposed acceleration spectra for seismic testing and qualification of substation equipment. A 2% damped high-design level response spectrum was utilized in this study as the target spectrum. Ten historical earthquake records were selected from the FEMA-P695 (2009) far field database. Key features of the records are listed in Table 3. The last column of the table presents the scale factors (SFs) that were used to scale the selected FEMA-P695 records with respect to the target spectrum.
EQ data set used in this study
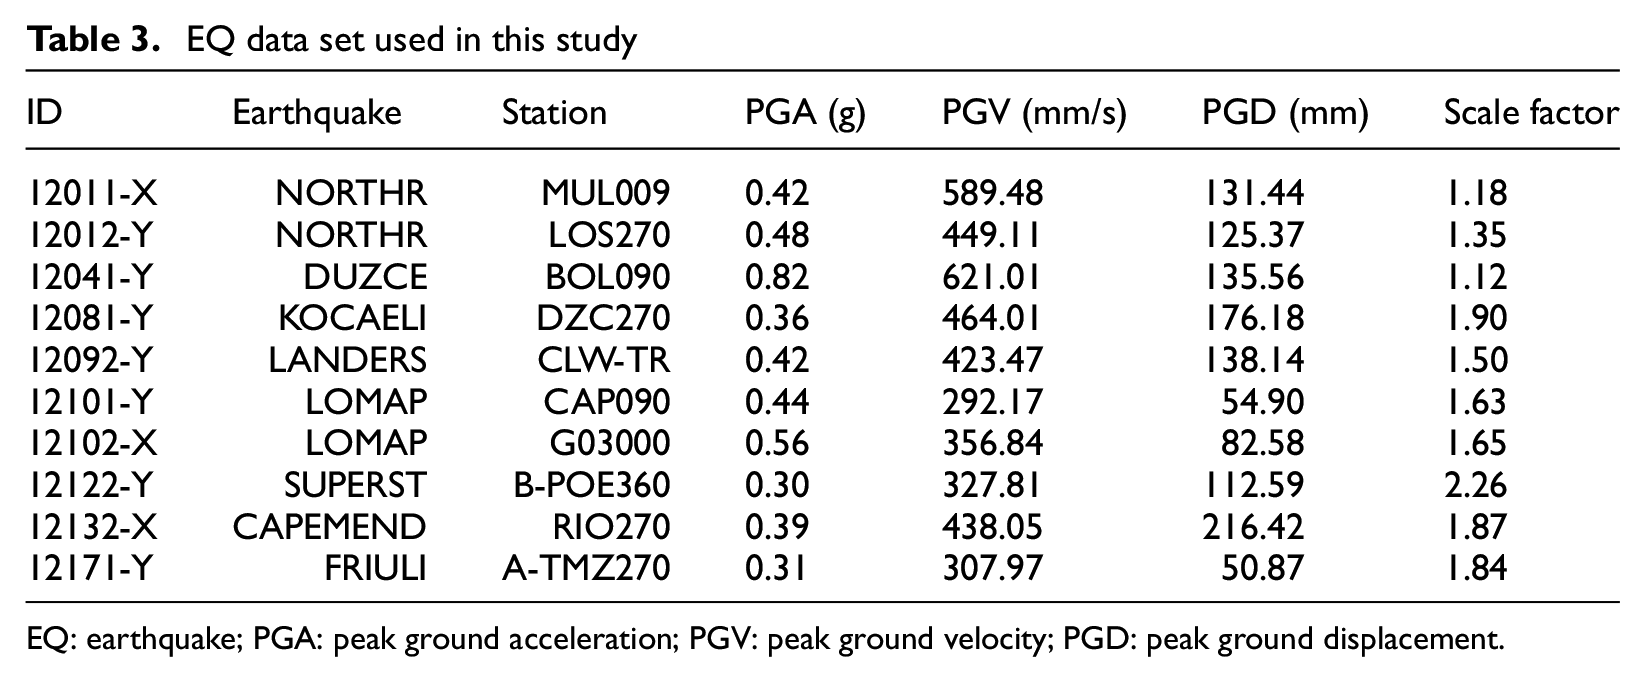
EQ: earthquake; PGA: peak ground acceleration; PGV: peak ground velocity; PGD: peak ground displacement.
The ground motion records were scaled to match IEEE-693 target spectrum. The weighted scaling procedure was applied to the records within frequency range of 0.5 to 10.0 Hz. The range comprises the critical frequencies of the specimens (5.57, 1.56, and 1.17 Hz) given in Table 2. Each record was scaled by a factor of SF in order to minimize the error between the scaled input motion spectrum and the target spectrum in the frequency range.
The inclusive error is obtained as a weighted average of the errors in the frequency range, by using Equation 3.

To find the minimum of the error function, its derivative with respect to SF was set equal to zero (MCEER-12-002). SFs for each ground motion records were computed independently by Equation 4.
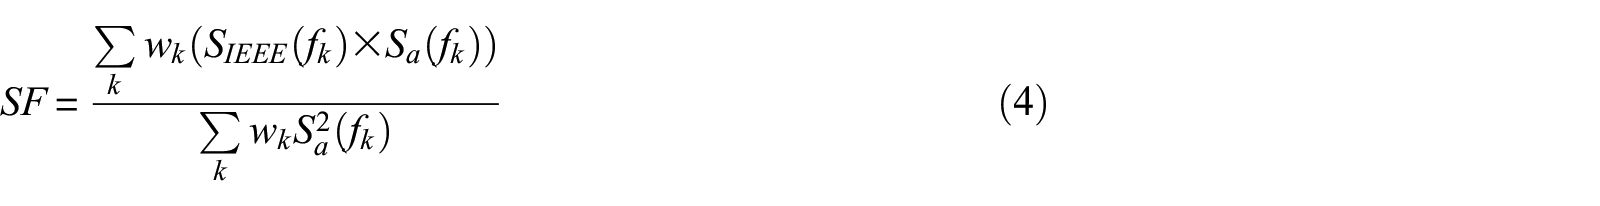
where SF is the scale factor,
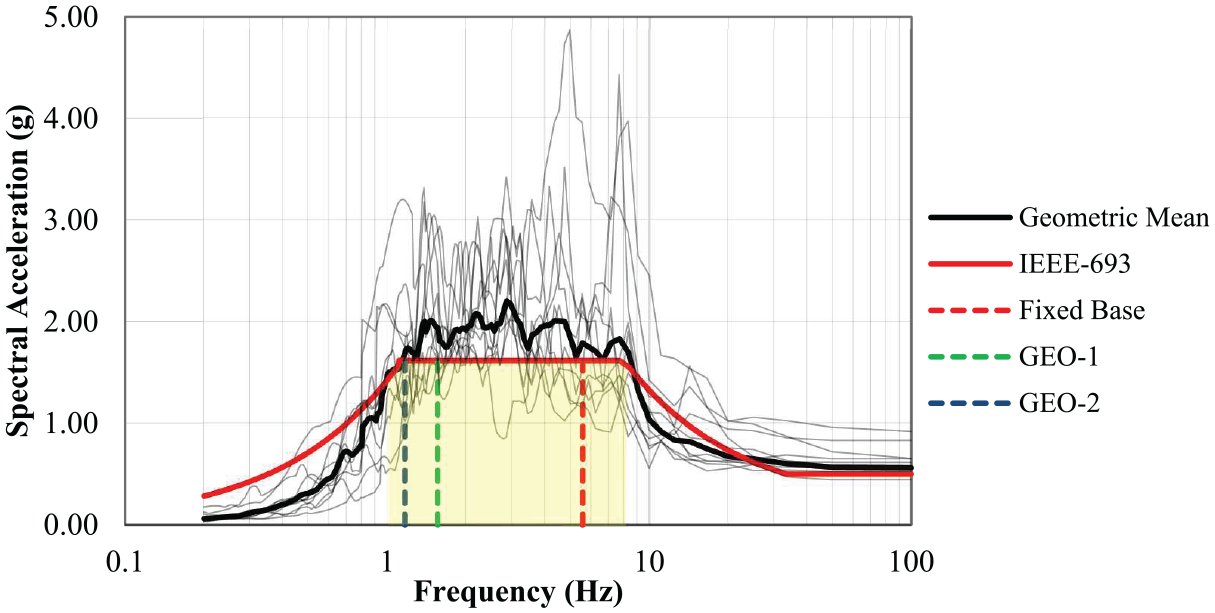
High-design level response spectrum (IEEE-693, 2018) versus mean spectrum of the selected records.
The dynamic tests were performed on the uni-axial shake table, with the steel support of the HV isolator fixed directly to the table. Six displacement transducers and four 3-dimensional (3D) accelerometers were positioned at varying locations on the specimens. The shake table tests were performed as incremental form using the input acceleration data scaled by 33.3%, 66.6%, 100% and SF shown in Table 3. White noise tests were performed before and after the dynamic tests to evaluate any potential changes in the dynamic characteristics of the test specimens.
Although preliminary comparisons between the fixed base and GEO-1 design was achieved for five tests in Gökçe et al. (2019), this article presents the results of ten tests.
The experimental shear
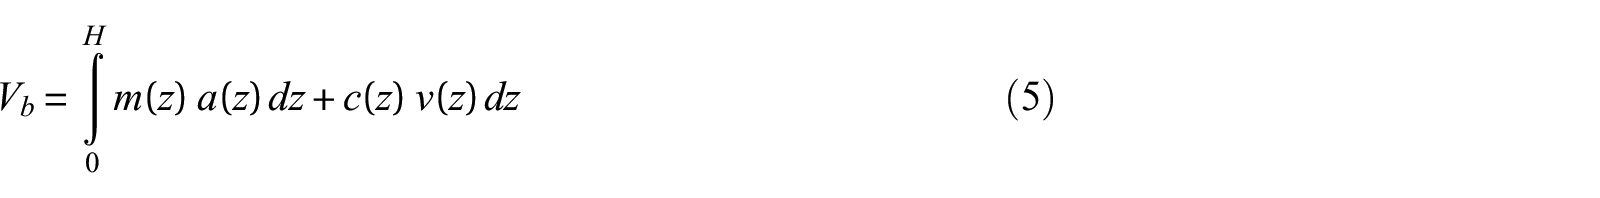
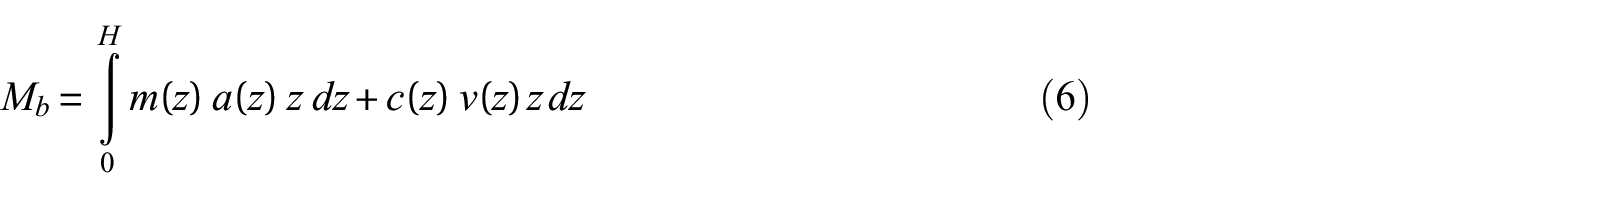
where


where (mb, mo) and (ab, ao) are mass and acceleration at the bottom and top sections of the post insulator. H is the total height of the insulator.
The acceleration time histories recorded at the top of the post for CAP090 are presented for GEO-1 and GEO-2 in Figure 10a. Results for GEO-2 show a decrease in the acceleration intensities when compared to GEO-1. The porcelain base moment histories calculated by Equation 8 are depicted in Figure 10c. The maximum base moment for GEO-1 is 3.98 kN m and it is reducing to 3.29 kN m for GEO-2. The top displacement and shear force histories are also presented in Figure 10b and d, respectively.
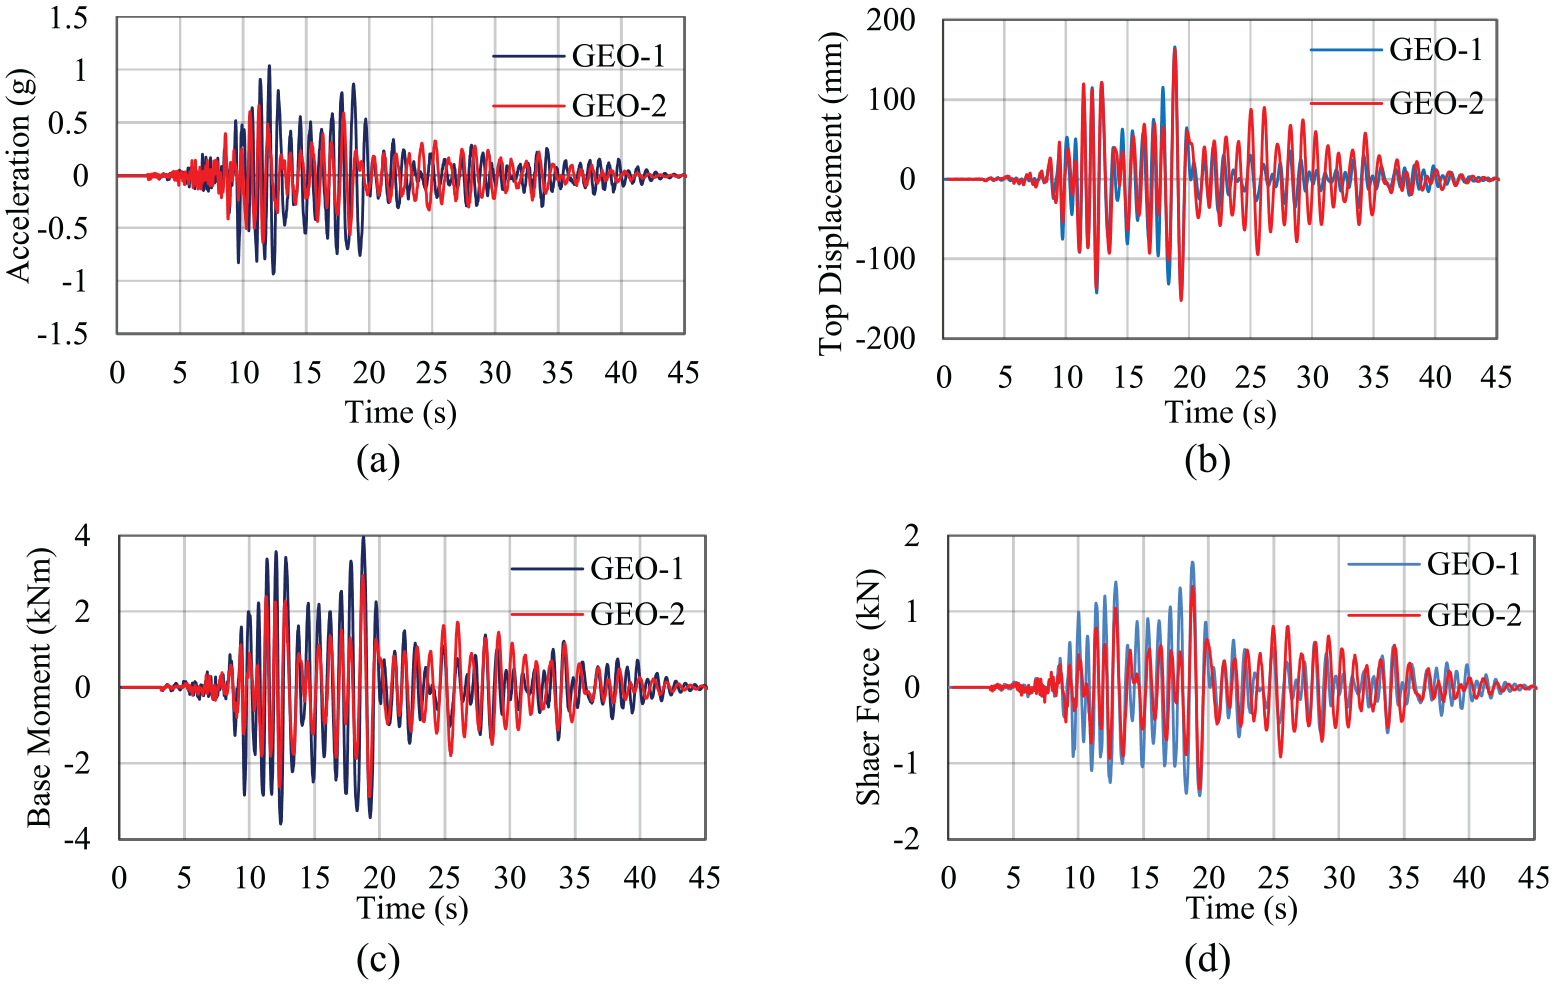
The histories for CAP090 record: (a) Measured top accelerations. (b) Measured top displacement. (c) Calculated base moments. (d) Calculated base shear of post insulator.
Table 4 presents the maximum acceleration recorded at the top of the post for each test case where SF was utilized. The calculated mean acceleration at the top of the pole (μ) and standard deviation (σ) were used to compute (μ + σ). It validates the effectiveness of GEO-2.
Maximum accelerations as recorded at the top of the post
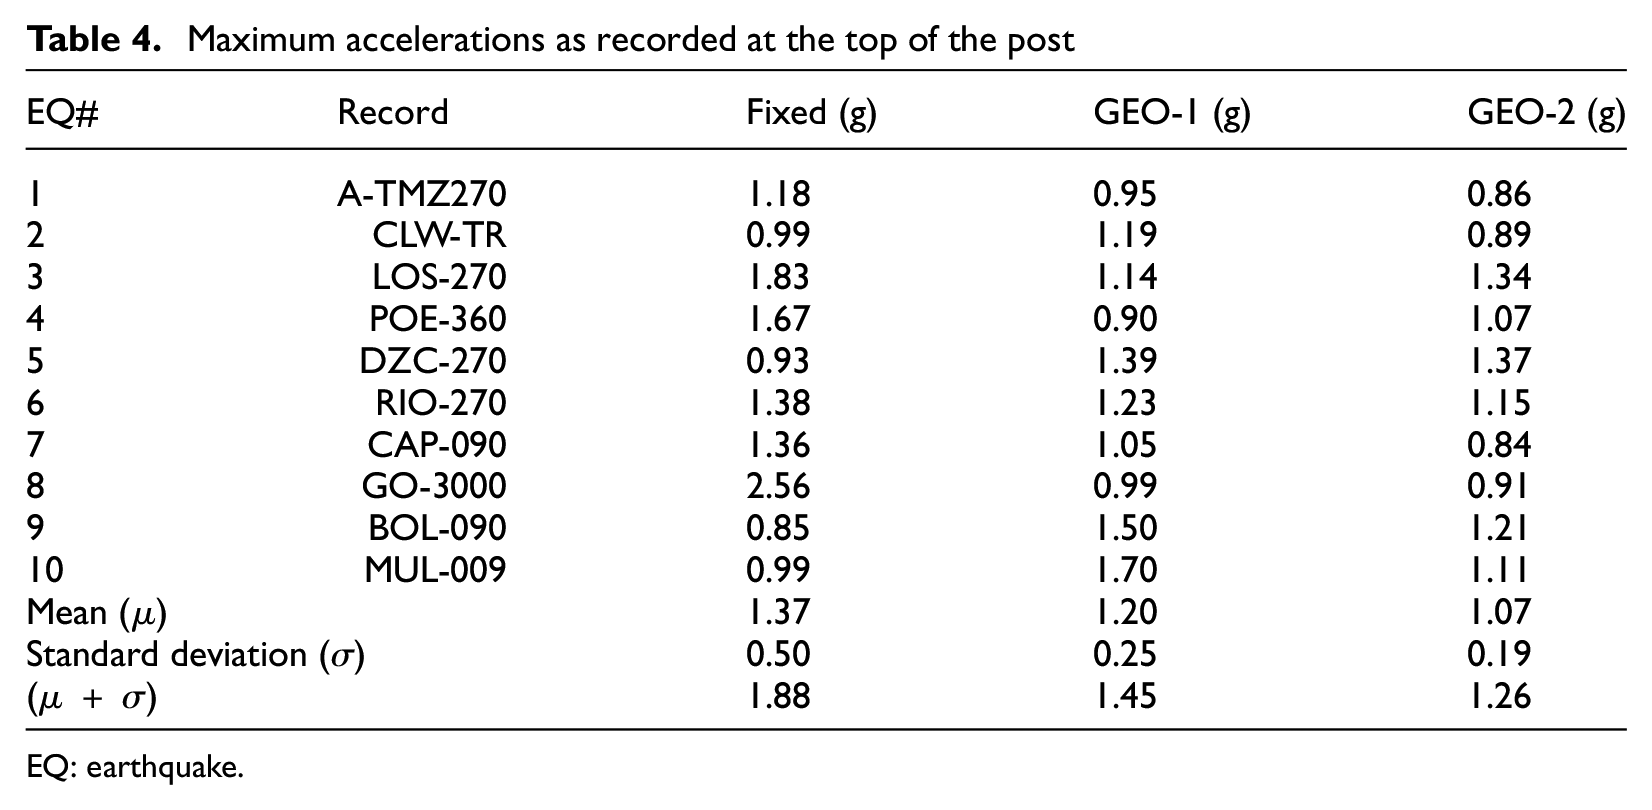
EQ: earthquake.
However, the acceleration intensities at the top of the pole were increased in the isolated cases for DZC-270, BOL-090, and MUL-009. The main cause of these results is related to the shape of the associated acceleration spectra, as shown in Figure 11.
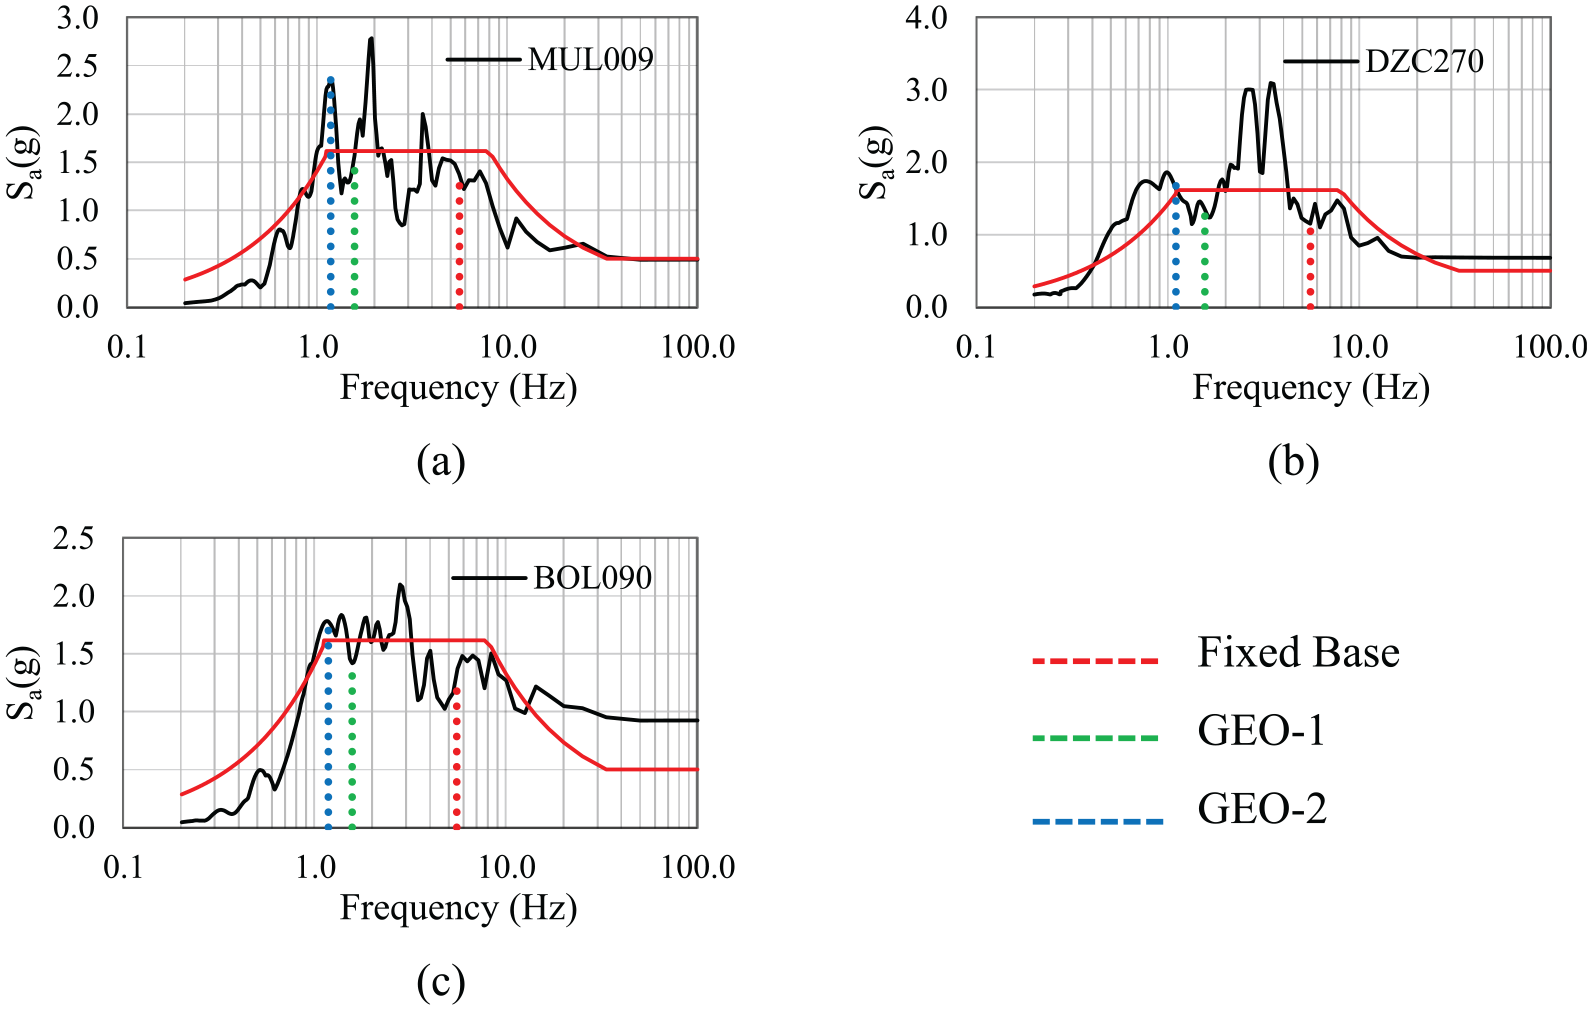
Elastic acceleration spectra for some earthquakes versus the target spectrum: (a) MUL009. (b) DZC270. (c) BOL090 records.
The recorded maximum displacements at the top of the pole are listed in Table 5. The (μ + σ) value for the fixed base is 22.53 mm, for GEO-1 is 265.44 mm, and for GEO-2 is 342.50 mm. The displacement increments in the seismically isolated cases should be accounted for by careful design of adequate slackness in the flexible conductors.
Maximum top displacements
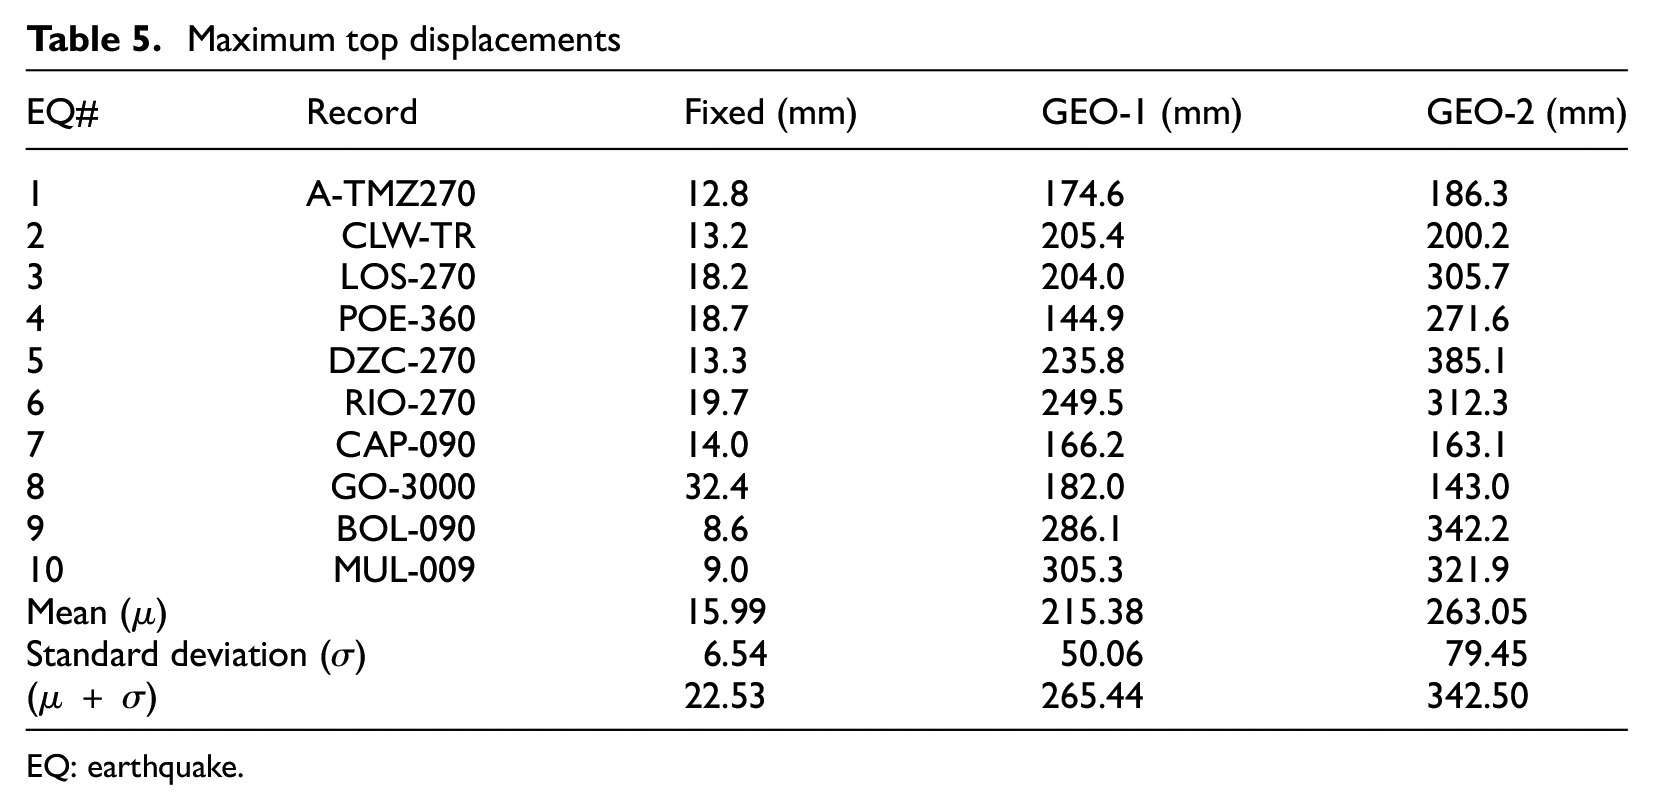
EQ: earthquake.
The calculated maximum base moments are presented in Table 6. The (μ + σ) value for the fixed base is 9.90 kN m, reducing to 6.20 kN m for GEO-1 and 5.55 kN m for GEO-2. The reduction in the base moment was 42% for GEO-2 when compared with fixed-base case.
Maximum base moments at porcelain insulator
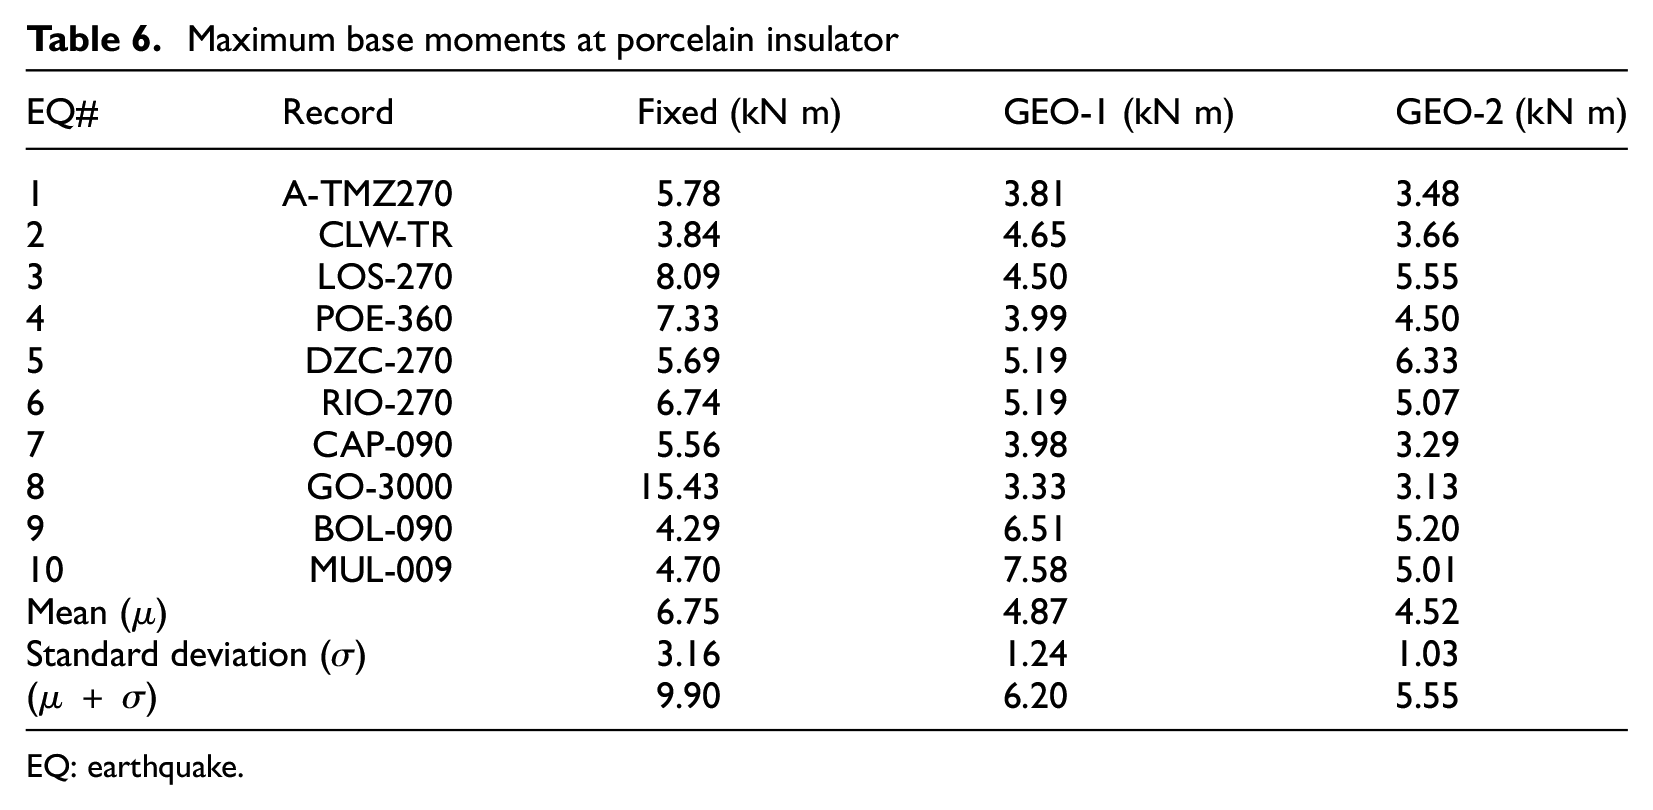
EQ: earthquake.
Base moment versus top displacement trend lines for the specimens are presented in Figure 12 together with the strength and deformation-based boundaries. The circular points highlight the maximum recorded moment at the porcelain insulator when the displacement of the top of the pole is also at its maximum.
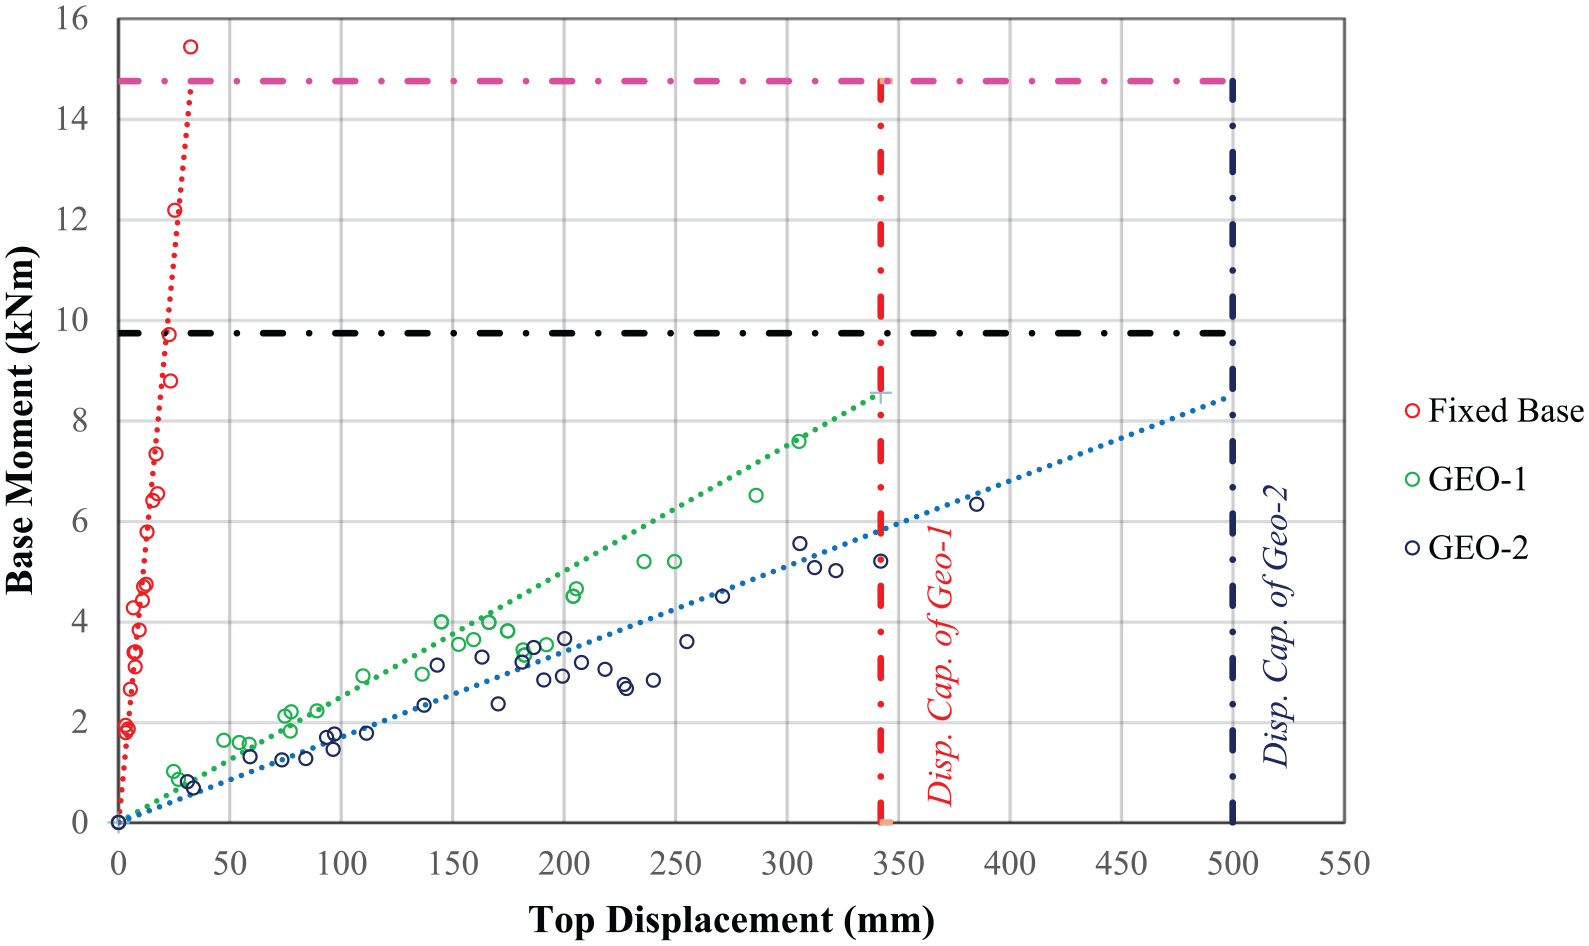
Maximum base moment versus maximum top displacement duals and the boundaries.
A linear response is detected for each specimen. The maximum displacements measured for GEO-1 and GEO-2 were 305.3 and 385.1 mm, respectively. Both values are smaller than the corresponding displacement limits of the PSIDs. The horizontal boundary lines (
Numerical modeling and the fragility curves
The numerical models that represents the steel support, PSID components and post insulator, were developed by using elastic frame and nonlinear link elements, as shown in Figure 13. Nonlinear dynamic time history analyses (NTHAs) were performed by using the features of SeismoStruct (2016). Validation of the numerical models was undertaken using experiments in which cyclic displacement patterns were applied (Gökçe et al., 2018).
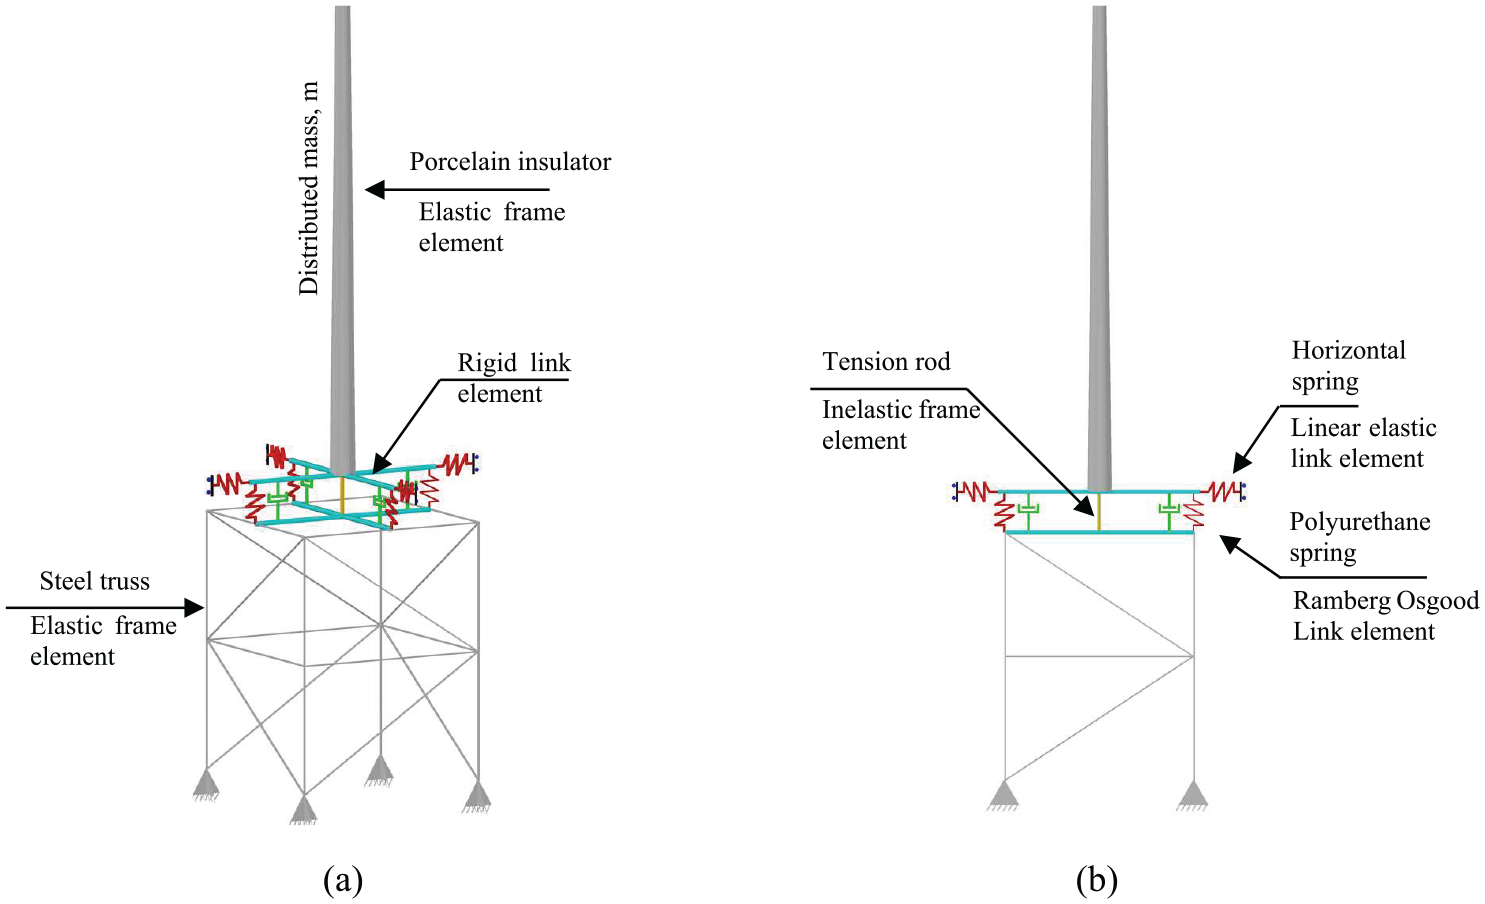
Numerical model components: (a) System members. (b) PSID members.
The nonlinear elastic behavior of polyurethane springs was represented by Ramberg–Osgood model. The parameters used to characterize the axial response of polyurethane springs are yield strength (Fy = 13.5 kN), yield displacement (Δ y = 7.813 mm), and the Ramberg–Osgood coefficient (α = 1.5 and α = 1.2 for GEO-1 and GEO-2, respectively). The values chosen for shear resistance of the polyurethane springs were based on experimental observations, which yielded relatively high values when compared to the axial stiffness (Gökçe et al., 2019).
Global damping ratios of 2% and 0.5% were implemented for the fixed-base and seismically isolated cases, respectively. The inherent damping of the PSIDs was represented through Ramberg–Osgood hysteresis and the NTHAs were performed by using Hilber–Huges–Taylor integration technique.
A representative comparison between the numerical and experimental response histories is presented for CAP090 record in GEO-2. In the comparison of absolute top acceleration history, general forms of the curves are well matched, but there are some discrepancies particularly for low amplitude peaks, Figure 14a. From the relative top displacement history comparison, it is observed that main peaks are compatible but then again, there are some disagreements for the succeeding peaks, Figure 14b. The bending moment and shear force histories, which are obtained for the bottom section of post insulator by using Equations 7 and 8, are in good agreement with the numerical ones, Figure 15.
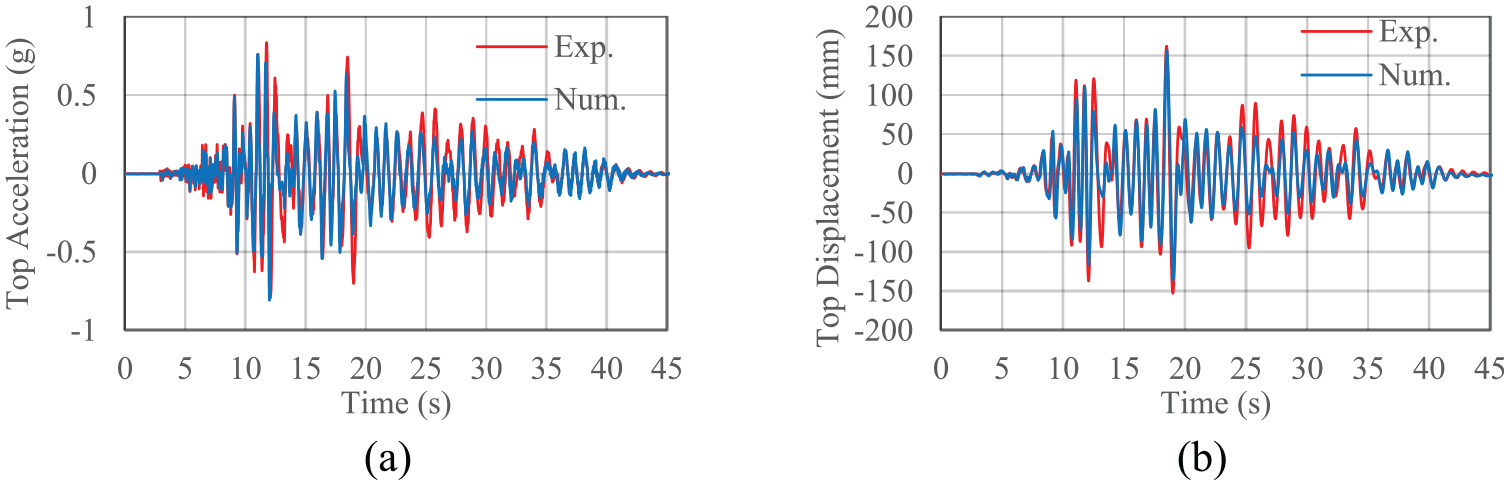
Comparison of experimental versus numerical results: (a) Top acceleration. (b) Top displacement histories of GEO-2 system.
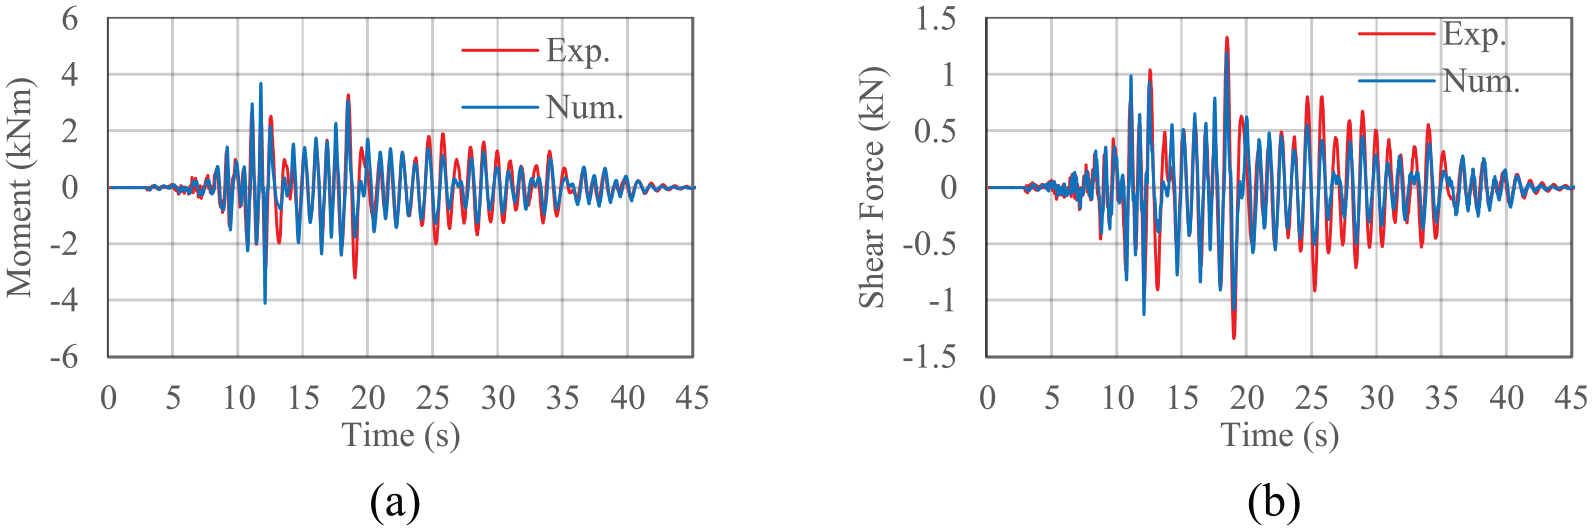
Comparison of experimental versus numerical results: (a) Base moment. (b) Base shear force histories of post insulator.
The wide range acceleration spectra are produced at top of GEO-2 from the experimental and numerical data. Good correlation is obtained for the record, Figure 16.
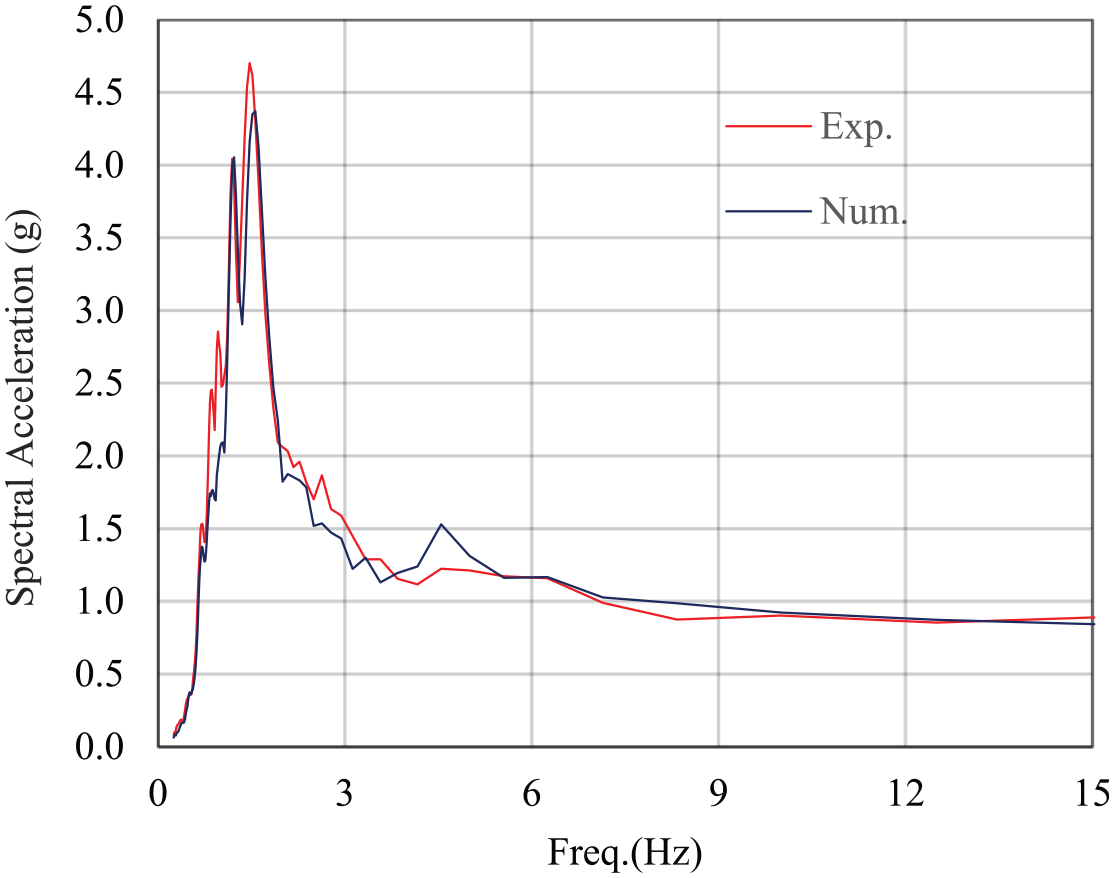
Acceleration spectra at top of GEO-2 specimen for CAP090 record.
The moment versus rotation relation of GEO-2 obtained from numerical analysis is compared with the dynamic test result. Figure 17 shows that the results are consistent with each other.
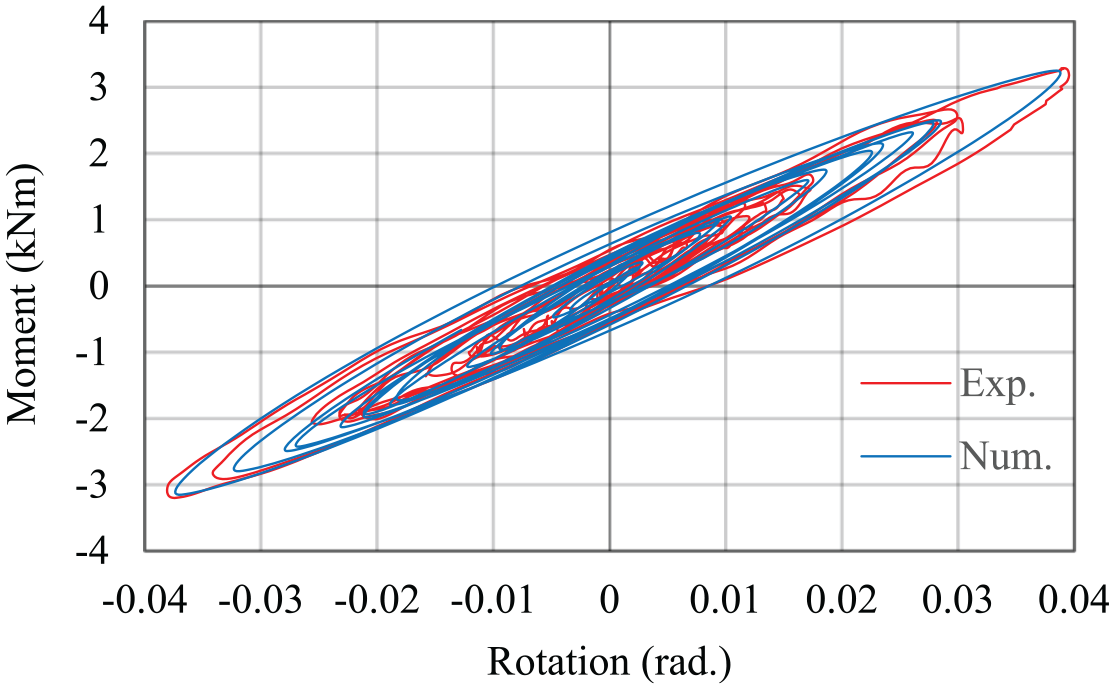
Moment versus rotation hysteresis of GEO-2 for CAP090 record.
Fragility curves
Fragility curves present the probability of failure, as tested against predefined thresholds, for any IM. The probability of exceeding a given threshold is then determined for each IM level, and is defined as:

The conventional IDA was used in this study to generate the fragility curves. It requires numerous structural analyses to be performed at increasing IM levels, until component failure occurs. PGA is considered as an IM because it is typically used in the fragility analysis of electrical equipment. Wen et al. (2019) stated that PGA-based fragilities can be readily used by power utilities and augmented into grid nodes and overall substation fragilities to conduct regional risk assessments and reliability analysis for decision-making frameworks.
The probability of exceeding a given threshold in terms of a specific IM value typically has a log-normal distribution (Baker, 2015), which can be mathematically expressed as:

where P(E|IM = X) is the probability that a ground motion with IM = X will yield a structural response which exceeds the threshold to failure. ∅() is the standard normal cumulative distribution function, θ is the median of fragility function, and β is the standard deviation (Baker, 2015).
The validated numerical models were used to generate the fragility curves. Kircil and Polat (2006) stated that, for mid-rise buildings, 10 to 20 ground motion records are usually enough to provide sufficient accuracy in the estimation of seismic demand. Thus, 10 earthquake records given in Table 3 were scaled PGA levels from 0.1 to 2.0 g, in increments of 0.1 g and utilized in IDA.
Although IEEE-693 (2018) defines two levels of qualification (design and performance), design-level qualification was considered in the study. Two distinct acceptance criteria are defined as follows: Critical load to stress ratio shall not exceed
50% of the second standard deviation strength in the case of a sample size greater than or equal to ten,
33% of the tested strength in the case of a sample size of one.
At collapse, the quasi-static cyclic tests yielded the base moment of
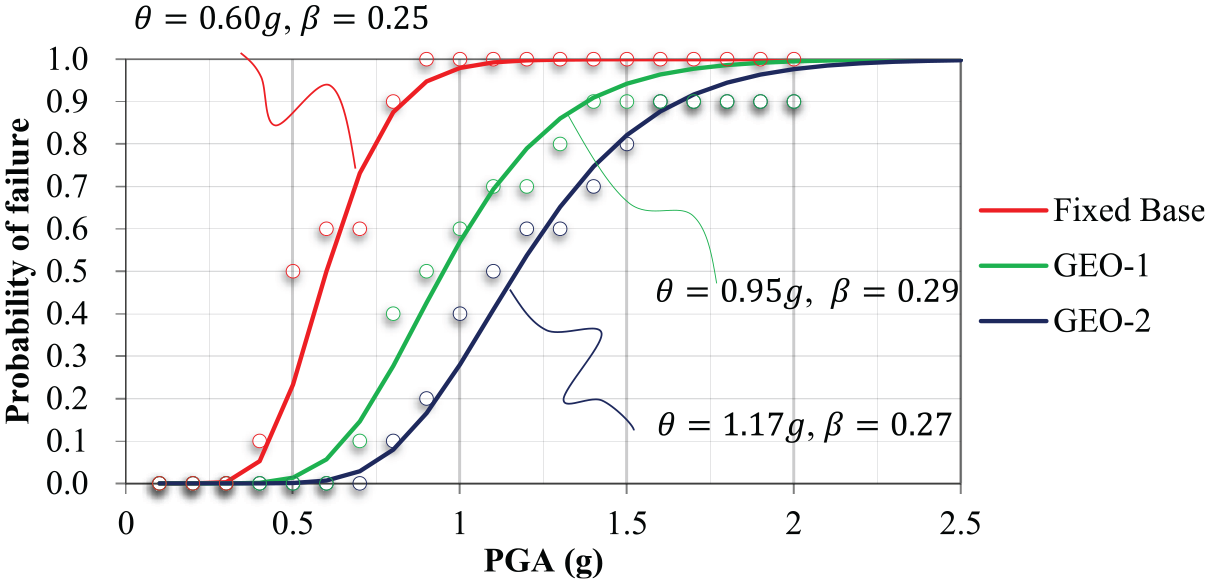
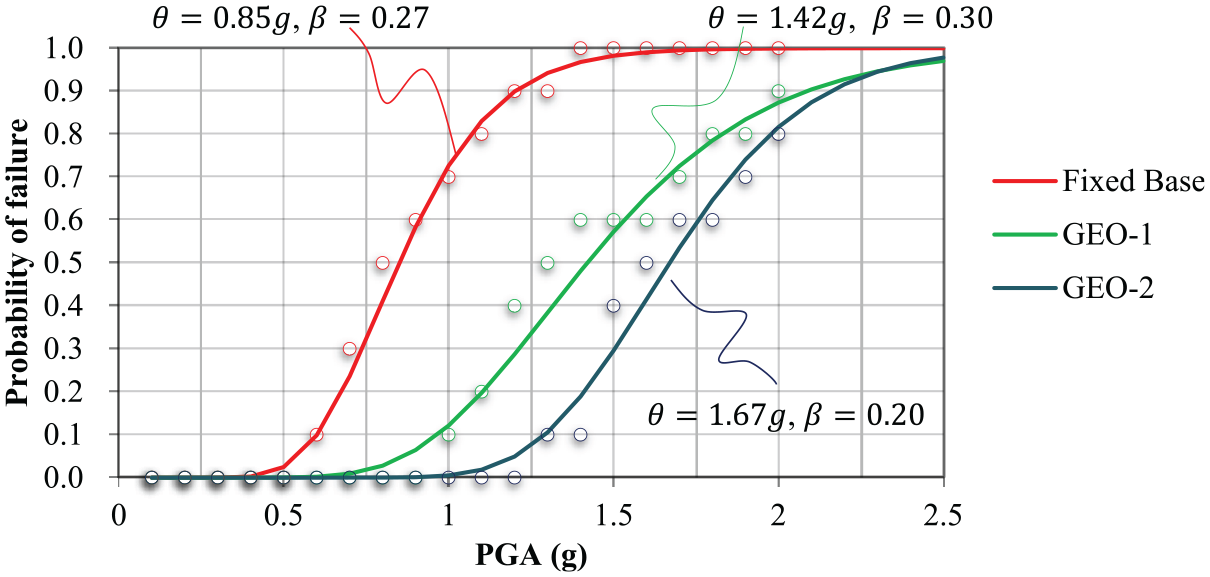
Figures 18 and 19 present fragility curves of the porcelain post insulator for the cases of
Probability of failure for
Probability of failure for
The fragility curves corresponding to
To quantify and evaluate the performance of the isolated systems, an Efficiency Factor, E, was defined for median values (PoE = 50%) of maximum base bending moments of the porcelain post insulator, as per Equation 10 (MCEER-12-002).

The calculated efficiency factors are presented in Figure 20 for
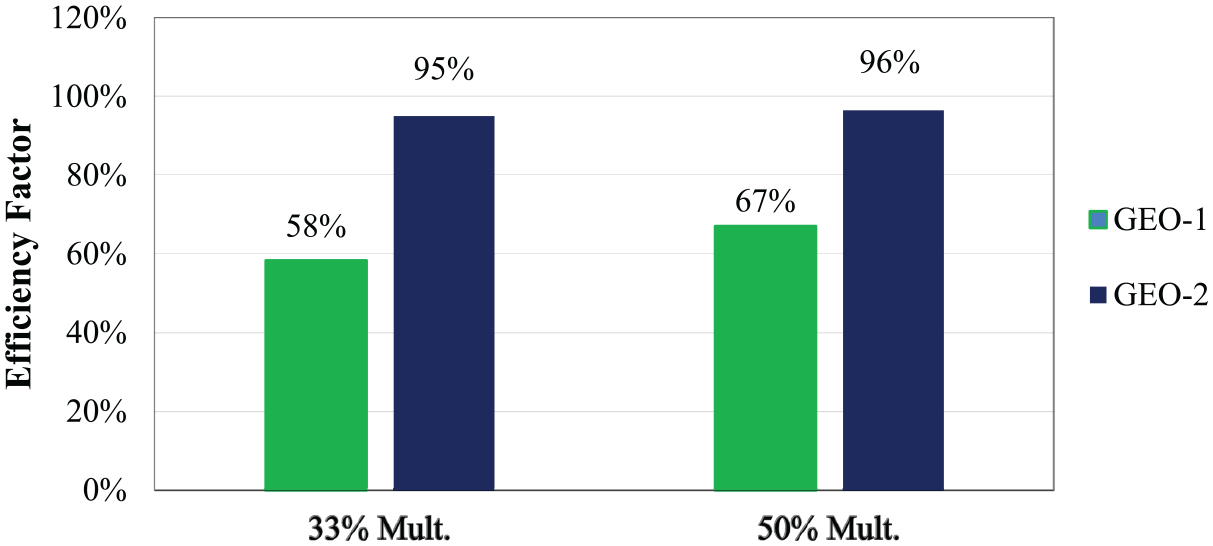
Efficiency factors of the seismic isolation devices.
To generate curves for the probability of failure, based on displacement of the top of the pole, limits of 350 and 500 mm were applied, as shown in Figure 21. The mean (θ) and standard deviation (β) are also labeled in Figure 21. At PGA = 0.6 g, neither isolation system shows a probability of failure above 0%; however, with an increase to PGA = 1.0 g, the probabilities increase to 20% for GEO-1, and 7% for GEO-2.
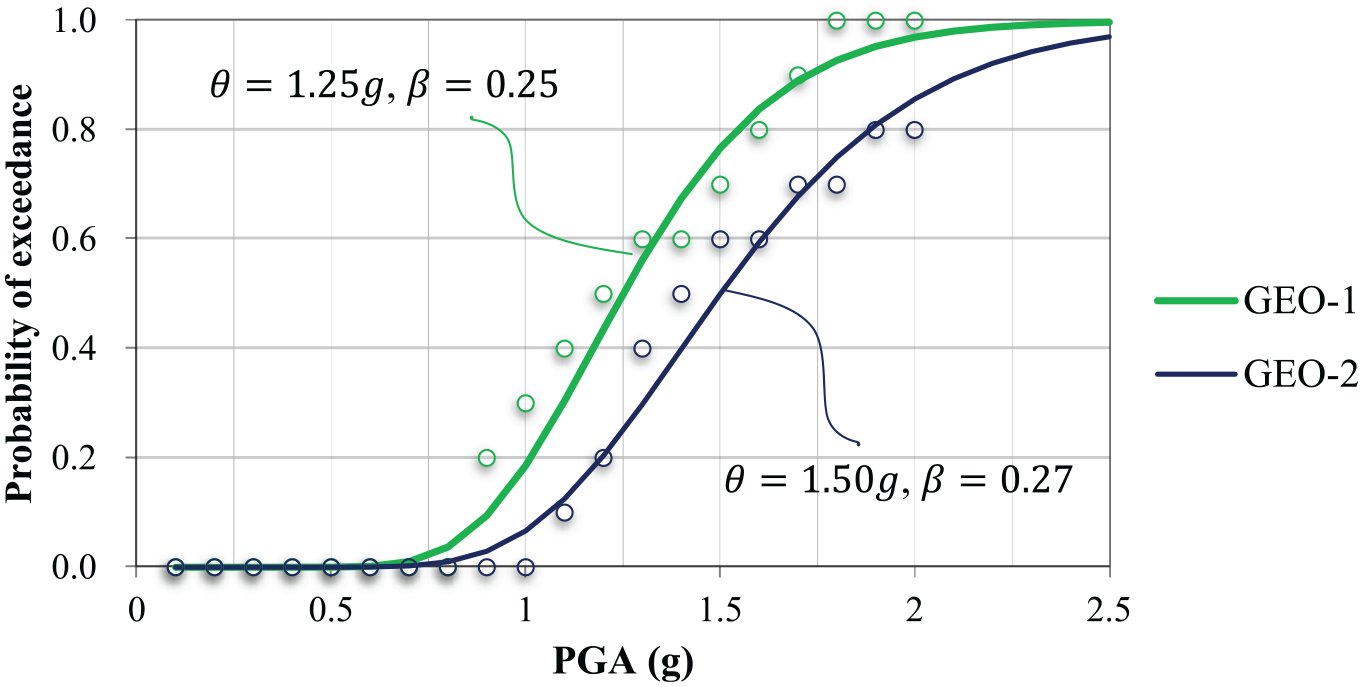
Probability of exceedance for the top displacement.
The probability of exceeding threshold limits for displacement at the top of the pole is relatively low for the intensities less than PGA = 1.0 g even though the probability of failure in terms of base moment is quite high.
Conclusion
The PSIDs were numerically and experimentally evaluated to determine optimal isolation system for 550 kV HV porcelain post insulator. Based on the experimental and numerical results, the following conclusions can be made:
The natural dominant frequency of the fixed-base post insulator is approximately 5.57 Hz, while the isolated cases were 1.56 Hz (GEO-1) and 1.17 Hz (GEO-2).
The damping ratio of the systems were identified as 1%–2%, 3%–8%, and 3%–6% for fixed base, GEO-1, and GEO-2 cases, respectively.
The maximum displacements at the top of the pole were measured as 33.1, 278, and 347 mm for fixed base, GEO-1, and GEO-2 cases, respectively. The relatively large displacement at the top of the pole should be considered in the design of slackness of flexible conductors.
Performance of the seismic isolation devices were assessed by calculating the probability of failure as a function of the porcelain base moment. Probability of failure curves were generated for the allowable base moments (0.33 × Mult. and 0.50 × Mult.) according to IEEE-693 (2018). In the case of 0.33 × Mult. and PGA = 0.6 g, the failure probabilities of the isolated systems are 0% even though it was 40% for fixed-base system.
Compared with the fixed-base case, low probability of failure was consistently demonstrated for the seismically isolated systems. The efficiency factors extracted from the fragility curves are between 58% and 65% for GEO-1 and 92% and 94% for GEO-2.
Based on these results, it has been shown that utilization of this low-cost seismic isolation device is an effective way to enhance seismic safety of porcelain insulators. The effectiveness can be improved by adjusting the flexibility of the seismic isolation device with the consideration of displacement limits. The effectiveness of the seismic isolation systems can be optimized in the design of the device flexibility, which is ultimately the factor which improves the response to a seismic event. The maximum flexibility will be dictated by the maximum allowable displacement of the top of the pole.
Footnotes
Acknowledgements
The 550 kV HV post insulators were supplied by Güral Elektrik Company. The study was carried out in the Structural and Earthquake Engineering Laboratory (STEELab) of ITU. All supports are gratefully acknowledged.
Declaration of conflicting interests
The author(s) declared no potential conflicts of interest with respect to the research, authorship, and/or publication of this article.
Funding
The author(s) disclosed receipt of the following financial support for the research, authorship, and/or publication of this article: The first author was sponsored by Bideb 2211 Program of Scientific and Technological Research Council of Turkey (TUBITAK). The study was sponsored by the research funds of Istanbul Technical University (ITU BAP 39552).