
Abstract
The seismic response of safety-related equipment mounted on the head of an advanced reactor, including pumps, control rod drive mechanisms, and reactor monitoring devices, will affect the design and layout of many advanced reactors. High earthquake-induced accelerations in such equipment may challenge their seismic qualification and trigger the need for additional support framing on the reactor head. Base isolation is a design solution that can drastically reduce seismic demands on equipment. This article describes a set of earthquake-simulator experiments conducted on a scale-model of a base-isolated reactor vessel including four representations of head-mounted equipment, with frequencies spanning from 4.5 to 27 Hz. Dynamic responses of the head-mounted equipment, including displacements, accelerations, and strains, were measured in the experiments for three support conditions: conventional, and seismically isolated using single concave Friction Pendulum (SFP) bearings and triple Friction Pendulum (TFP) bearings. Seismic isolation was effective at reducing equipment responses (accelerations, displacements, and strains) with respect to those in the conventionally supported vessel across a range of seismic inputs. Companion numerical studies highlight the accuracy to be expected in the calculation of different response quantities for lightly damped equipment. The importance of characterizing damping in head-mounted, safety-related equipment through physical experiments to support design and risk assessment is made clear through the numerical simulations.
Keywords
Introduction
Many vertically configured advanced nuclear reactors include head-mounted equipment. The volume directly above these reactor vessels is occupied by equipment, much of it is safety-related, such as primary coolant pumps, reactivity control rods, fuel handling machinery, and instrumentation and control devices and assemblies. Although the equipment varies by reactor technology and power rating, efficiently utilizing the volume above the head is a common goal for reactor designers. Figure 1 presents head-mounted equipment for four advanced reactors. Information for other reactor designs was presented at an American Society of Mechanical Engineers (ASME, 2020) workshop on high-temperature reactors in 2020. The equipment is cantilevered vertically from the reactor head.
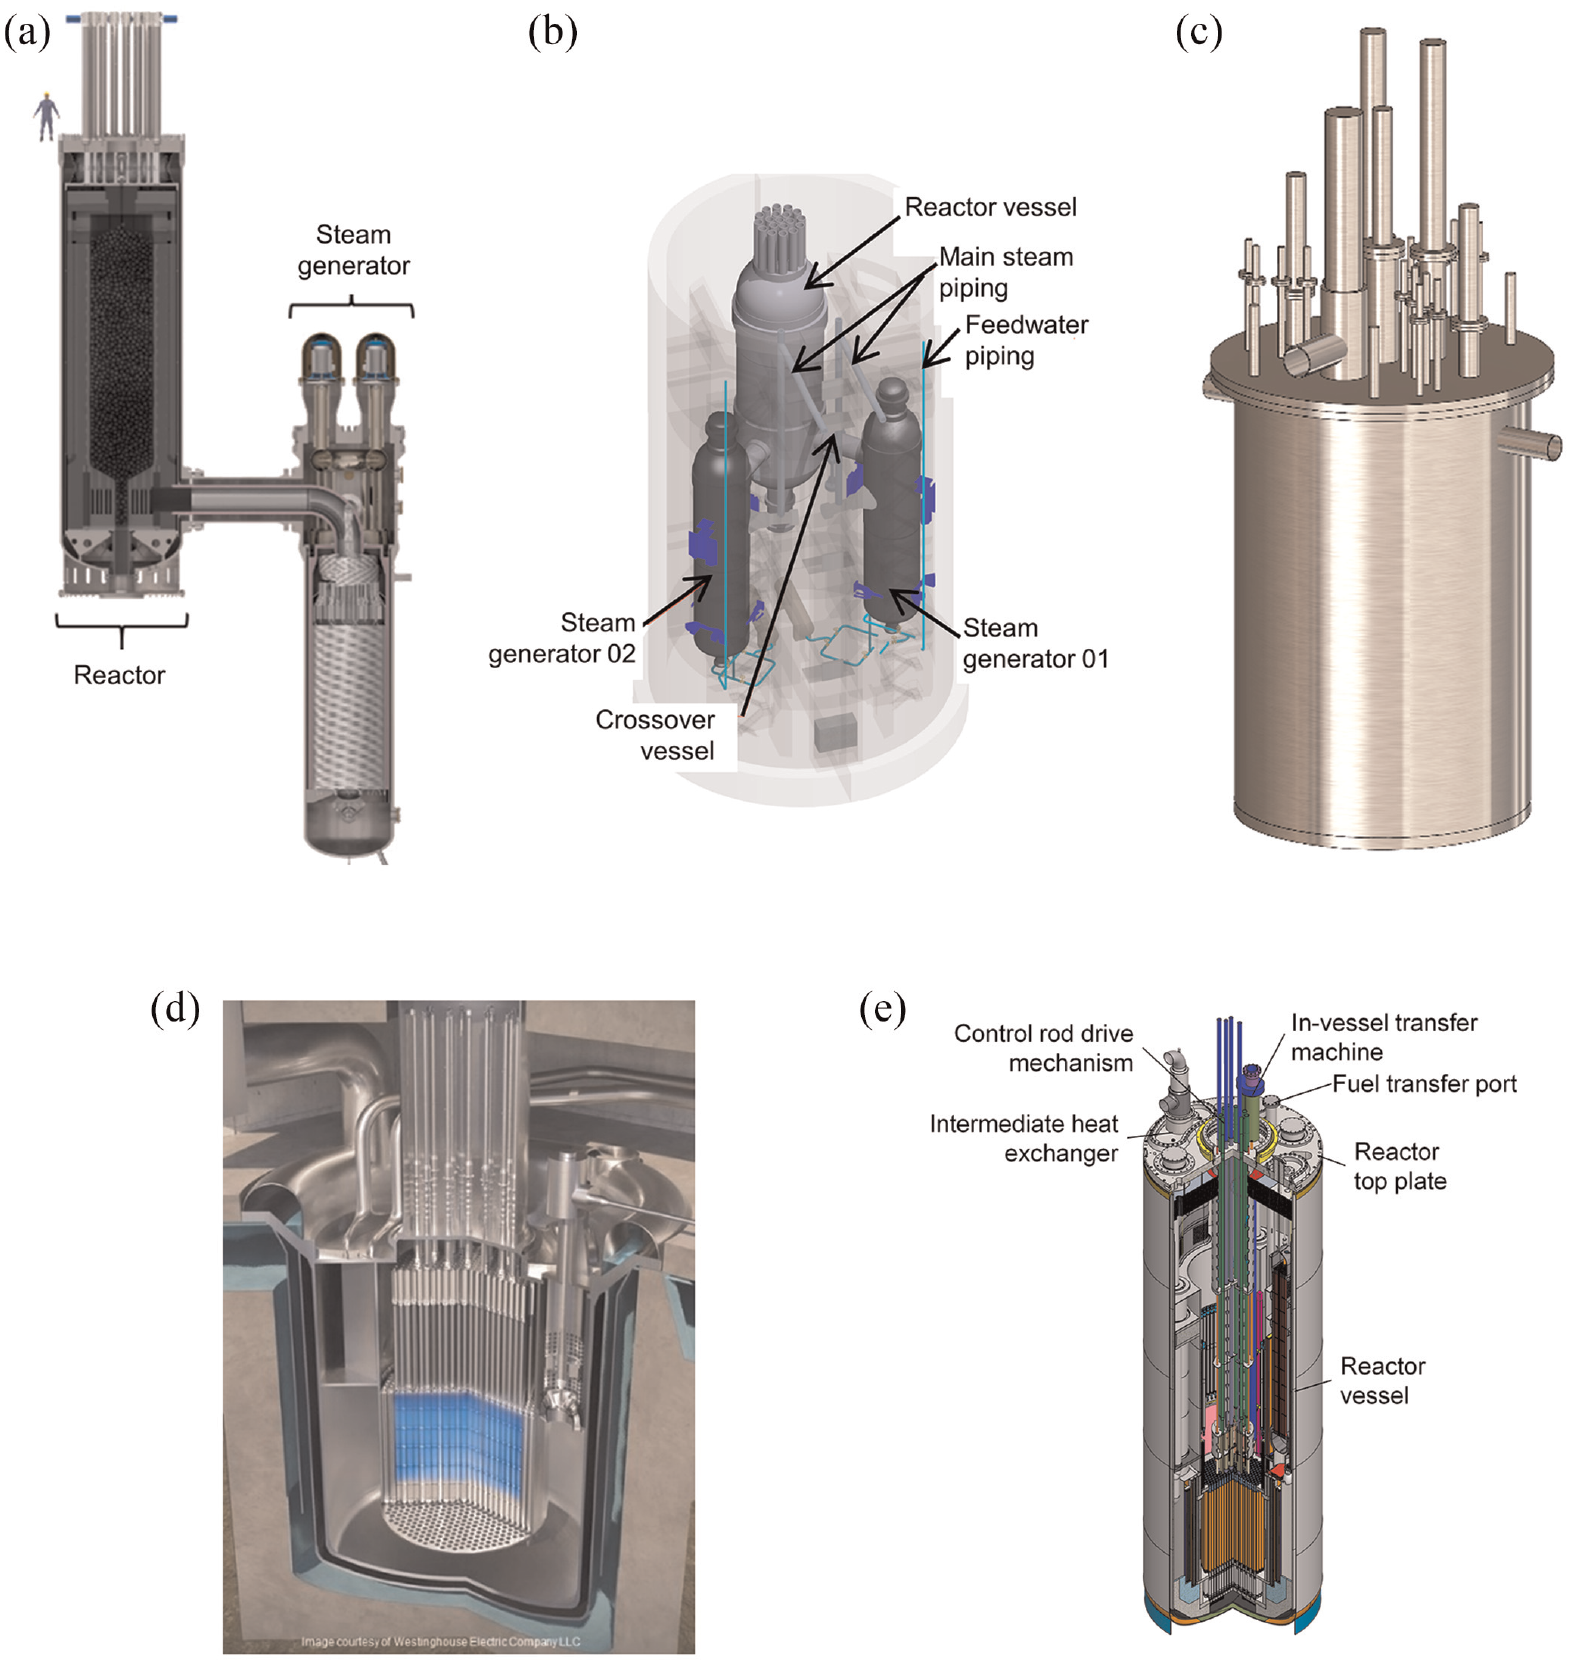
Head-mounted equipment in advanced reactor designs: (a) X-energy HTGR; (b) Framatome HTGR; (c) Kairos Power MSR; (d) Westinghouse LFR, and (e) typical SFR (courtesy of X-energy, Framatome, Kairos Power, Westinghouse, and GE Hitachi, respectively).
Regardless of where a reactor vessel is supported (i.e. base, head, mid-height), equipment attached to the head is subjected to vibratory motions during earthquake shaking. Herein, these vibrating pieces of equipment are referred to as head-mounted oscillators (HMOs). The natural frequencies of HMOs can vary widely based on the component type, weight, and height, and therefore can be excited by very different seismic inputs. In some reactor designs, the space above the head is very crowded, and insulation and shielding requirements can challenge the installation of lateral bracing for tall HMOs to reduce their horizontal displacement response. Horizontal displacement and impact of closely spaced HMOs during earthquake shaking could be of safety-related significance. Accurately characterizing and developing strategies to reduce HMO responses were goals of the study reported in this article. Identical to Figure 1, all of the HMOs tested in this study were vertically cantilevered from the head of the model reactor vessel.
Seismic base isolation is a design solution that some reactor developers are exploring. Studies have demonstrated that seismic isolation can significantly reduce the overnight capital cost of advanced reactors and support the deployment of standardized reactor designs at sites of varying seismicity (Lal et al., 2022; Parsi et al., 2022). Huang et al. (2008) showed that drastic reductions in equipment response could accompany the implementation of seismic isolation. Figure 2 identifies the isolators (bearings) and dampers that could be used to seismically protect HMOs by isolating either the reactor building or the reactor vessel. Shown in this figure, from left to right, are a single concave spherical sliding (Friction Pendulum) bearing, a lead rubber bearing, a coil-spring isolator, a one-dimensional (1D) nonlinear fluid viscous damper, and a three-dimensional (3D) viscodamper, courtesy of Earthquake Protection Systems, Dynamic Isolation Systems, GERB, Taylor Devices, and GERB, respectively. The Friction Pendulum bearing, lead rubber bearing, and 1D nonlinear fluid viscous damper have been widely used for seismic protection of mission-critical infrastructure in the United States.
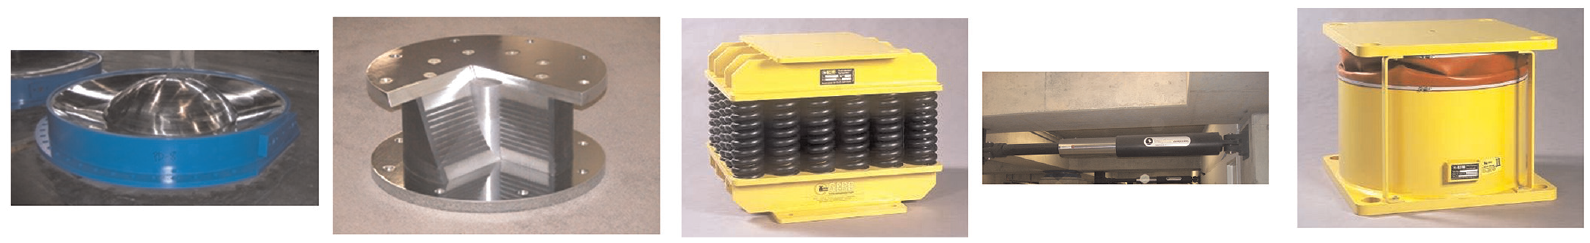
Seismic bearings and dampers.
To gain insights into the dynamic responses of components in a base-isolated advanced reactor, earthquake-simulator experiments were conducted on a scale model of a seismically isolated molten salt reactor. Two sets of experiments were carried out. The first set of experiments, described in the study by Mir et al. (2022a), addressed reactor internal components, including a core barrel, positively buoyant reflector blocks that act as a moderator, positively buoyant spherical fuel pebbles, and molten salt coolant. A length scale of 0.39 was used in the model design, based on results of a scaling analysis (see Mir et al. 2022a for details). The second set of experiments focused on the behavior of head-mounted equipment and is the subject of this article. Because the internal components studied in the first set of experiments had an average density of approximately 900 kg/m3 (i.e. comparable to water), they were replaced for the second set of experiments by filling the vessel with water. The earthquake-simulator experiments described herein thus included a base-mounted cylindrical vessel filled with water, a top plate (or head), and four pipes attached to the head, representing HMOs of varying frequencies. Two types of spherical sliding bearings were utilized to seismically isolate the test vessel at its base: single concave Friction Pendulum (SFP) bearings and triple Friction Pendulum (TFP) bearings. Earthquake-simulator tests were conducted in three configurations: the vessel restrained at its base, and the vessel supported by the two types of friction pendulum bearings in separate test setups, achieving different isolated periods.
The following sections describe the experimental setup, instrumentation, and seismic inputs used. 1 Responses of HMOs from tests in the three configurations are compared to identify the effectiveness of seismic isolation to mitigate earthquake effects. Numerical simulations of the measured HMO responses are presented to inform designers and analysts on the likely accuracy of computed responses for prototype applications. The tested HMOs are very lightly damped. Results of numerical simulations are presented to illustrate the importance of correctly characterizing damping in HMOs, perhaps requiring dynamic testing of equipment mounted to a surrogate reactor head.
Experimental setup
The experimental setup included a cylindrical test vessel, 1.52 m in diameter, 7.9 mm thick, and 2 m in height (see footnote 1) completely filled with water, a 95 mm thick square base plate with plan dimensions of 2 m × 2 m, a 38.1 mm thick circular top plate (head) covering the vessel, and four aluminum pipes (HMO1 through HMO4), each having an outer diameter of 89 mm and a thickness of 3 mm. The four aluminum pipes had lengths of 2, 1.52, 1, and 0.76 m and weights of 19, 3.5, 4.2, and 5.62 kg, respectively, attached at their ends. Each aluminum pipe was welded to a 25.4 mm thick plate, 150 mm × 150 mm in plan, which was bolted to the head of the vessel. Figure 3a shows the test specimen on the earthquake simulator and the Cartesian coordinate system used for this study. The total weight of the test specimen was 81 kN.
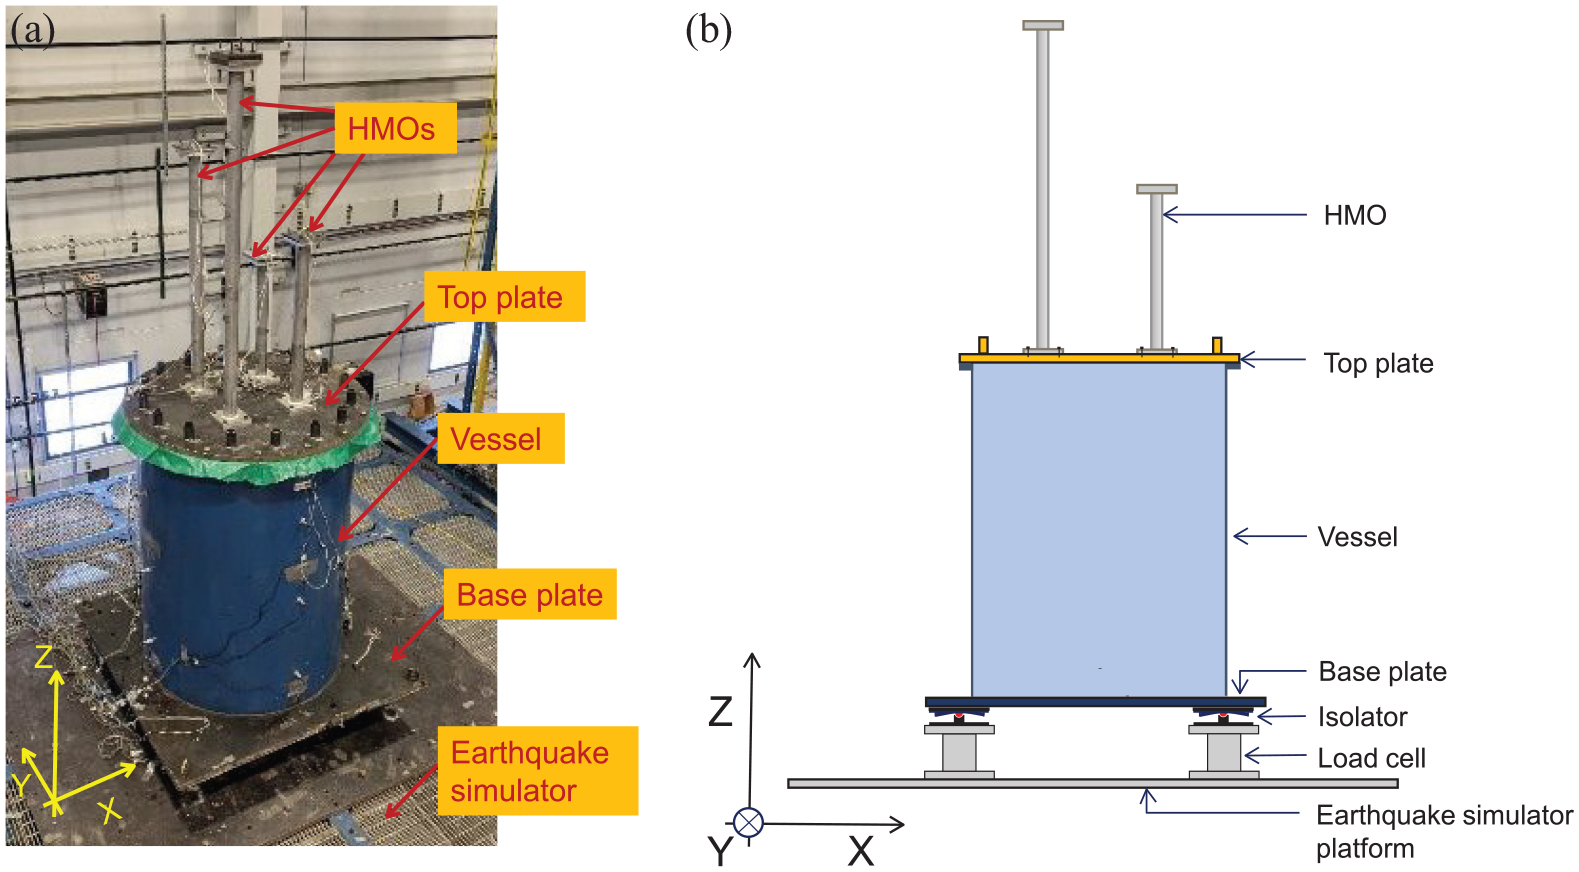
Test specimen and Cartesian coordinate systems used: (a) specimen on earthquake simulator and (b) schematic of the specimen.
The four HMOs were designed to achieve well-separated, first-mode frequencies, to ensure results from the experiments would be applicable to a range of equipment (e.g. from control rod drive mechanisms to pumps) and reactor types. The aluminum pipes and supplemental weights achieve the goal.
Tests were conducted in the fixed-base condition wherein the test specimen was supported on four load cells and in two base-isolated configurations, wherein the test specimen was supported on four SFP bearings or four TFP bearings (isolators in Figure 3b). A detailed description of the friction pendulum bearings is presented in Appendix A of Mir et al. (2022d) and is not reproduced here. The SFP and TFP bearings had sliding periods of 1.38 and 1.96 s, respectively, where period is a function of the radius of curvature of the sliding surfaces. Figure 4 presents the construction of the bearings.
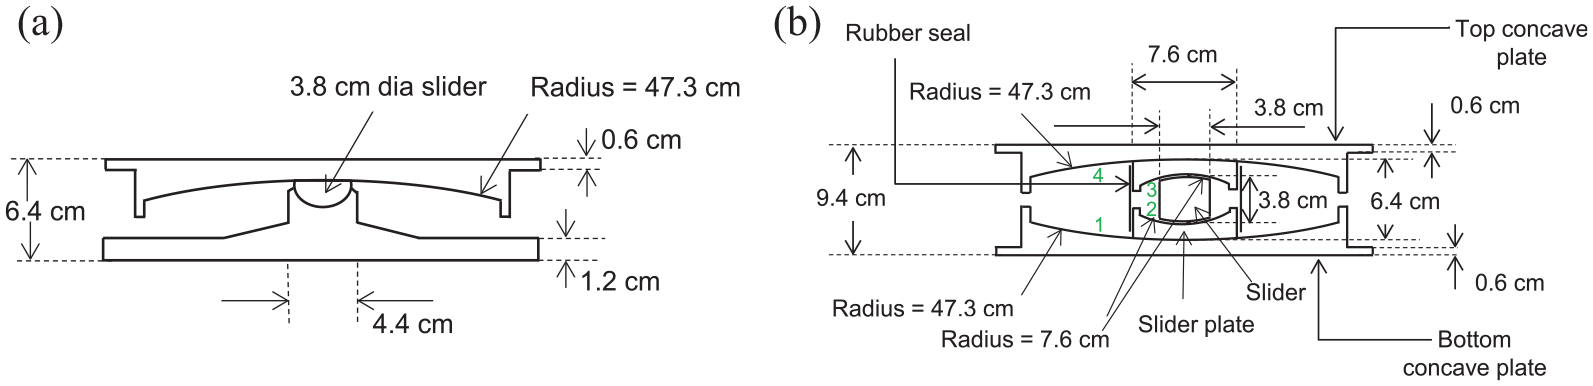
Cross-sections of the bearings used in the experiments: (a) SFP and (b) TFP, sliding surfaces numbered 1 through 4 in green.
Characterization tests were conducted prior to the earthquake-simulator tests to evaluate the coefficient of friction at different sliding surfaces (one surface in an SFP bearing and four surfaces in a TFP bearing; see Figure 4), the velocity dependence of the coefficient of friction (characterized by a rate parameter; see Appendix A of Mir et al. 2022d), and the axial stiffness of the bearings. The characterization tests were carried out at an axial load of 20 kN, which was nearly equal to the gravity load per bearing in the earthquake simulator tests. Table 1 summarizes results of the characterization tests.
Average properties of the bearings, characterization tests at axial load = 20 kN (Mir et al., 2022a)
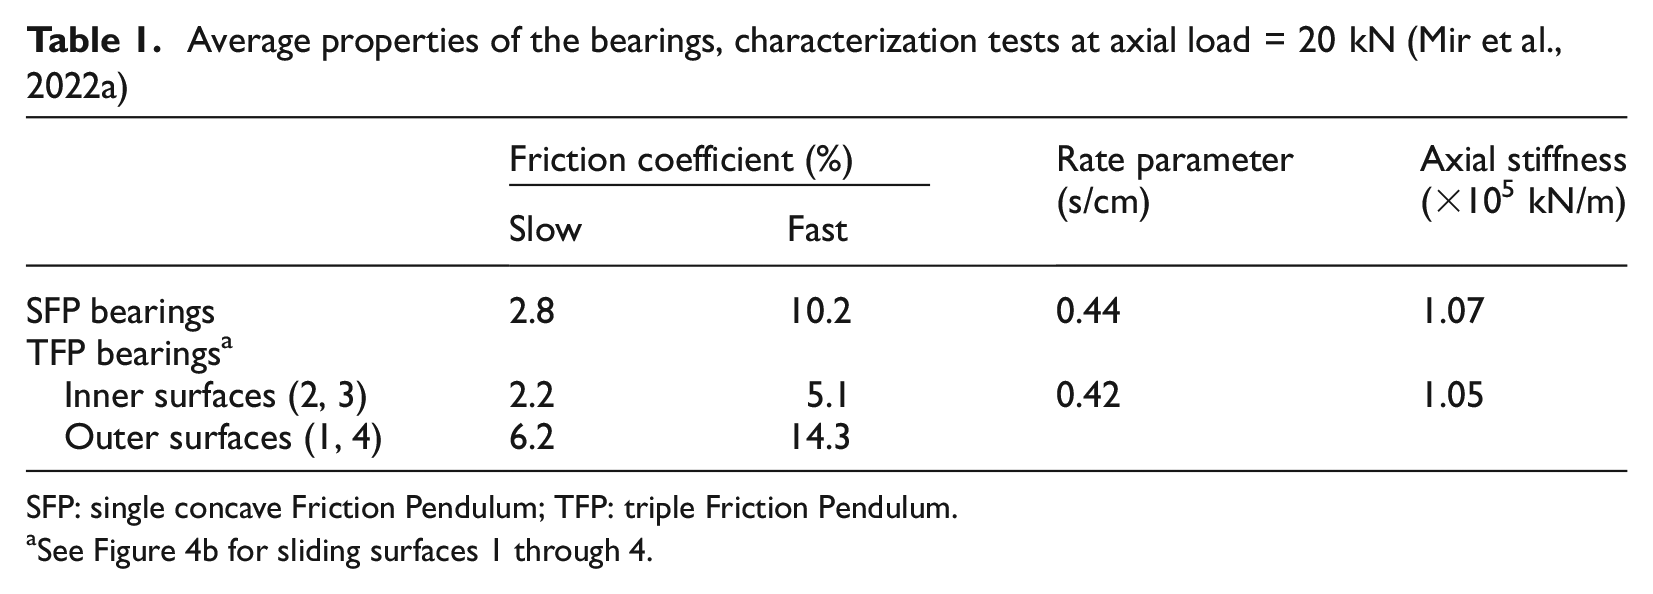
SFP: single concave Friction Pendulum; TFP: triple Friction Pendulum.
See Figure 4b for sliding surfaces 1 through 4.
The instrumentation on the vessel, base, and the earthquake simulator was very similar to that presented in Figure 8 of Mir et al. (2022c) and included tri-axial accelerometers and displacement transducers at multiple locations on the test specimen. Three directional accelerations were measured on the earthquake simulator, below and above the isolation system for the base-isolated configurations, and at the top of the vessel. Horizontal displacements were measured above and below the isolation system and at the top of the vessel. Base reactions were recorded using four load cells installed below the base of the vessel as shown in Figure 3b. Each HMO was instrumented with a tri-directional accelerometer at its free end, two displacement transducers to measure free-end displacements along the x and y directions, and two strain gages near the fixed end to measure strains corresponding to bending along the x and y axes. Figure 5 presents the instrumentation for HMO1 and Figure 6 presents images of instruments on an HMO.
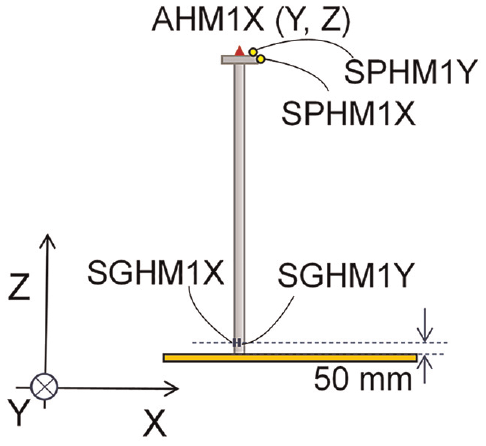
Instrumentation on HMO1, accelerometer, string potentiometer, and strain gage names begin with “A,”“SP,” and “SG.”
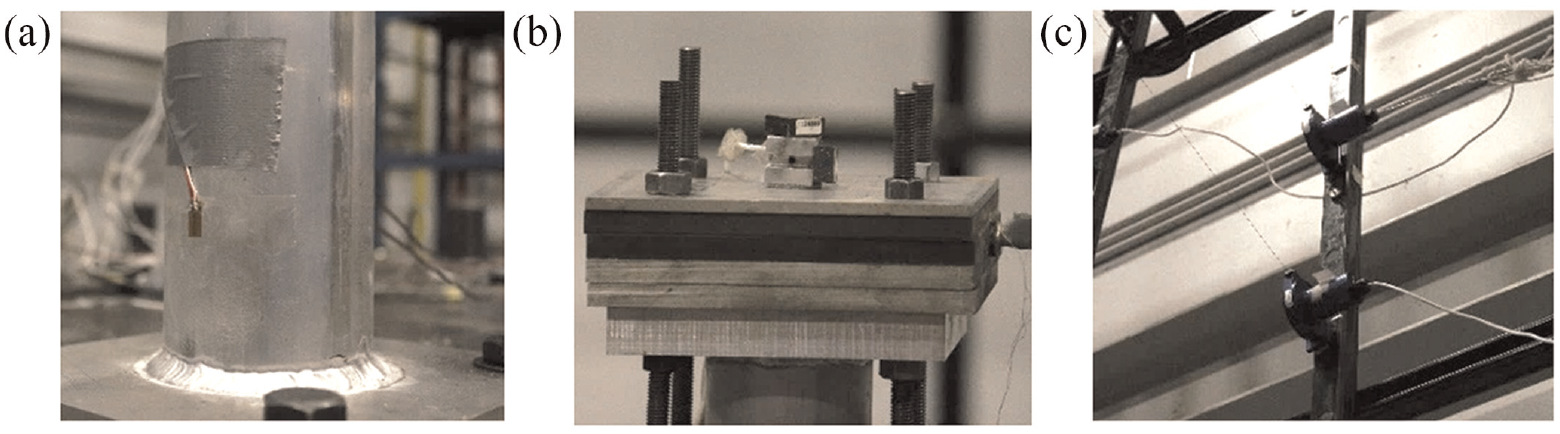
Instrumentation on an HMO: (a) strain gage near the point of attachment, (b) tri-axial accelerometer near the HMO tip, and (c) string potentiometers mounted off the earthquake simulator.
Seismic inputs and test series
Seismic inputs similar to those described by Mir et al. (2022c) were used for testing and included three recorded ground motions and one synthetic motion, all triplets. The recorded motions were extracted from the PEER Ground Motion Database (http://ngawest2.berkeley.edu) and were from the 1999 Chi-Chi Earthquake (CCE), the 1940 Imperial Valley earthquake (ECE), and the 1952 Kern County earthquake (KCE). The synthetic triplet, referred to as the broad-band motion (BBM) hereafter, had frequency contents that spanned a broad range. The recorded motions were time-scaled to be consistent with the length scale of test specimen: the time-axis was compressed by a factor of 1.6 (=
Earthquake-simulator inputs used for testing after time-scale compression
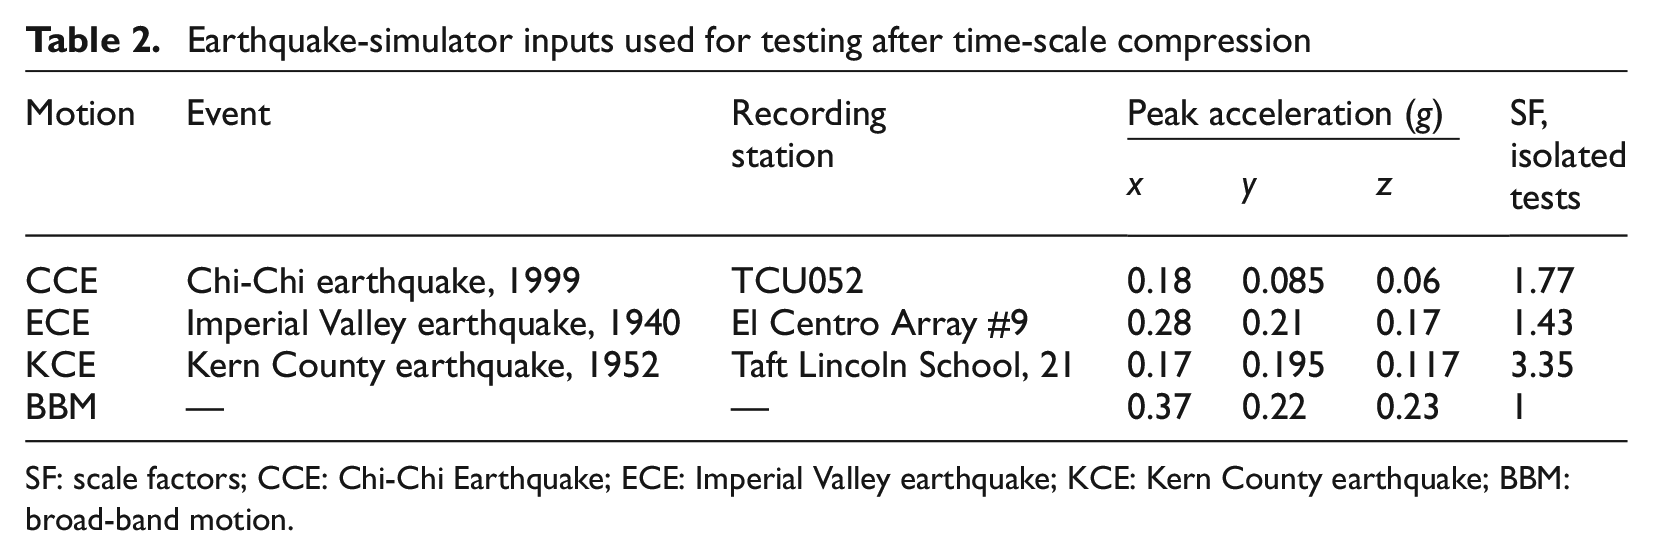
SF: scale factors; CCE: Chi-Chi Earthquake; ECE: Imperial Valley earthquake; KCE: Kern County earthquake; BBM: broad-band motion.
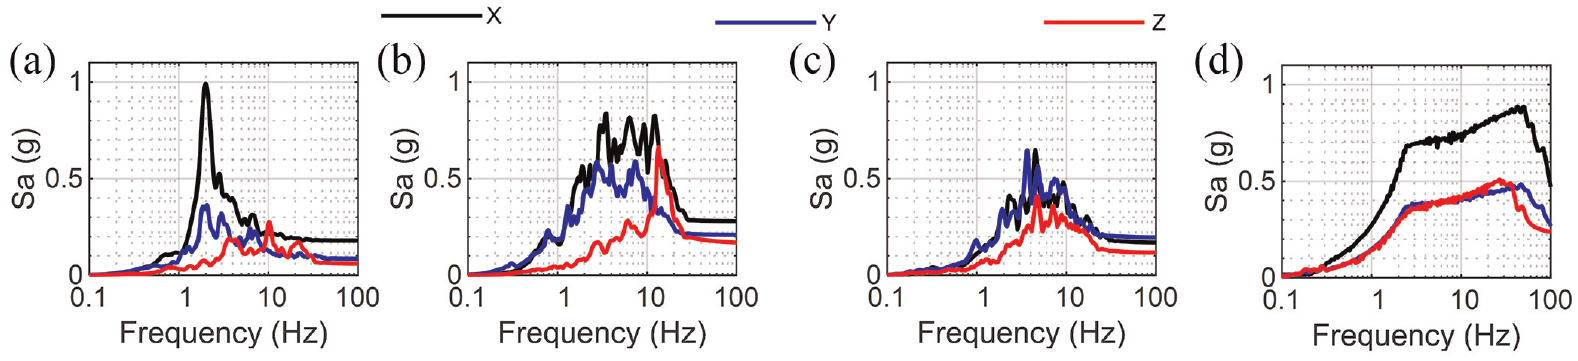
Response spectra of earthquake simulator inputs, fixed-base configuration, 5% damping: (a) CCE, (b) ECE, (c) KCE, and (d) BBM.
One-directional (x) and three-directional inputs corresponding to the four motions listed in Table 2 were run in the three test configurations. In the base-isolated configuration, only two one-directional motions were imposed (CCE and KCE) together with four three-directional motions.
The three-directional inputs described above (command motions) did not include rocking accelerations about the two horizontal axes (x and y) of the earthquake simulator. However, due to compliance between the simulator’s horizontal and vertical actuators, rocking of the earthquake-simulator platform was observed in the tests. These accelerations had a high-frequency content (> 20 Hz) and amplitudes were sensitive to the command motions, test setup, and prior testing. Figure 8 through Figure 10 enable a comparison of observed five-directional acceleration response spectra on the earthquake simulator platform for: (1) same command motion run twice (immediately; back-to-back) on the same setup; (2) same command motion run on different setups (SFP-isolated and TFP-isolated setups on different days); and (3) same command motion run on the same setup on two consecutive days. The translational accelerations are reproduced very well, but there are differences in the rocking accelerations in Figure 8 through Figure 10. These differences are related to the servo-hydraulic response of the simulator (i.e. oil column flexibility, changes in viscosity of hydraulic fluid with temperature) and their characterization is beyond the scope of this study.
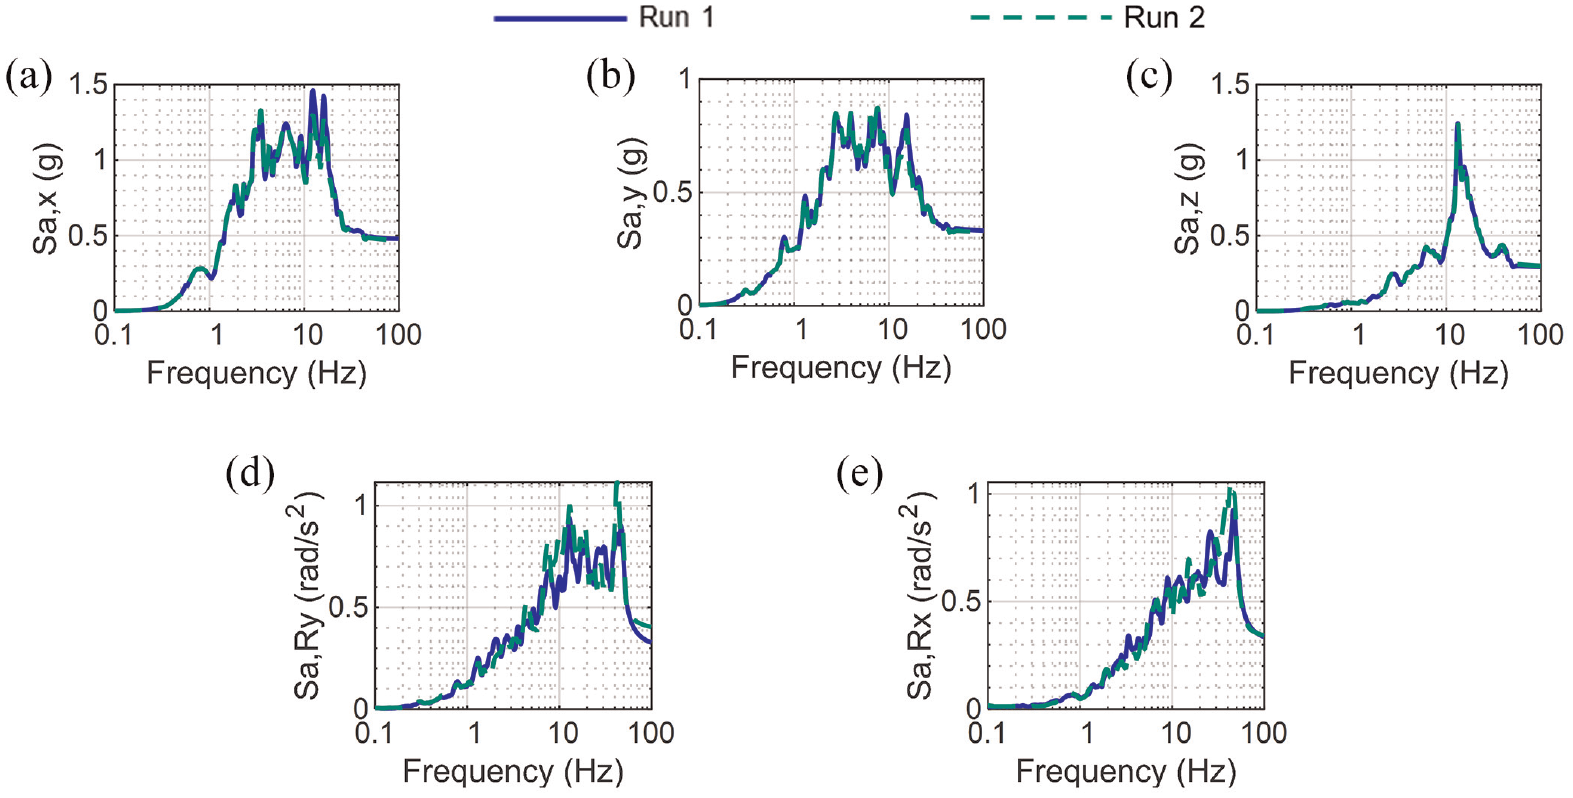
Acceleration spectra, ECE motion run twice (back-to-back), SFP-isolated configuration: (a) x-direction, (b) y-direction, (c) z-direction, (d) rocking about x, and (e) rocking about y.
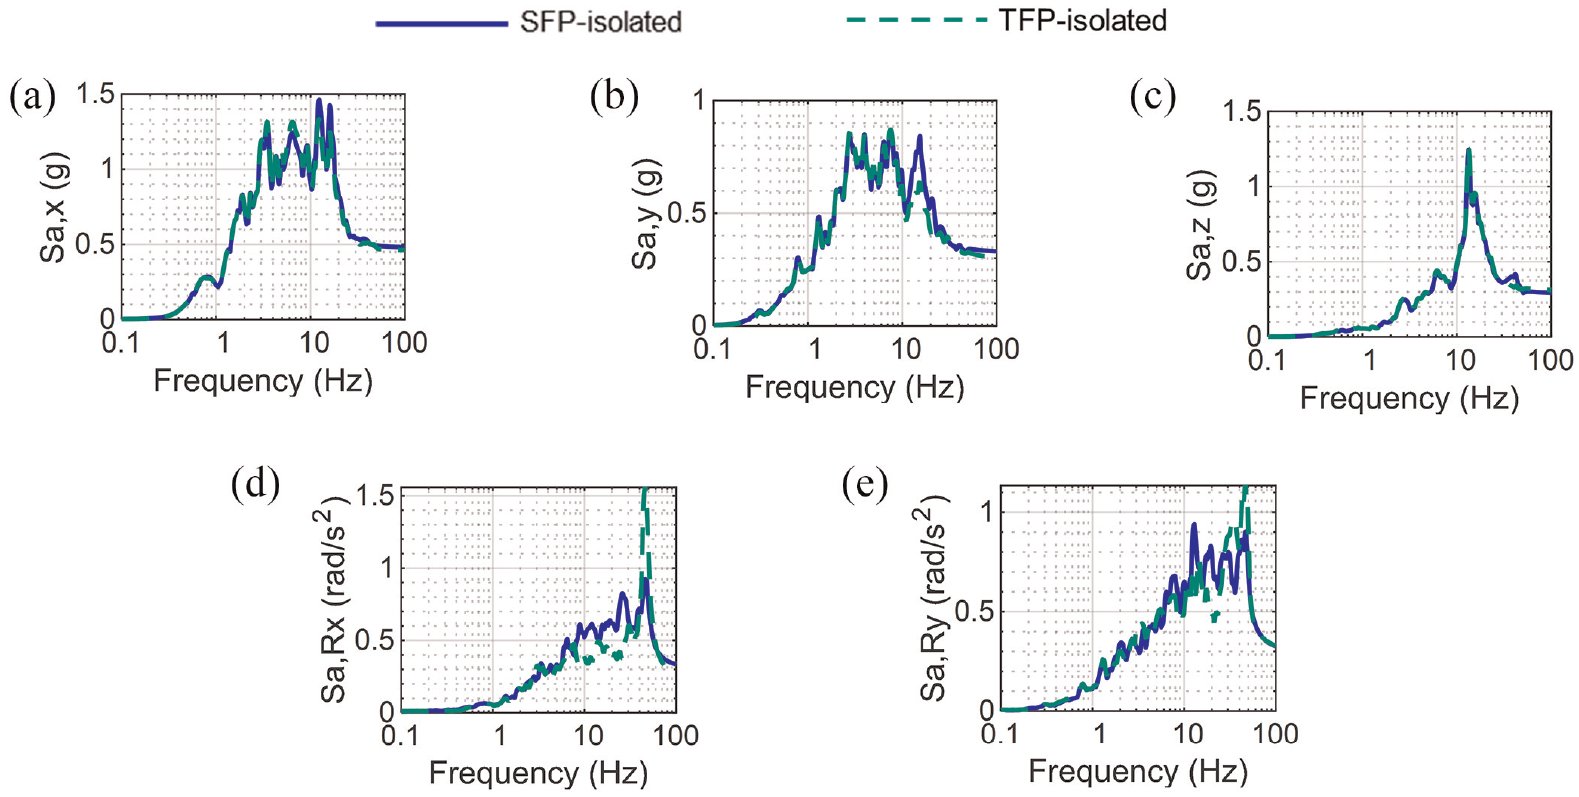
Acceleration spectra, ECE motion, SFP-isolated and TFP-isolated configurations: (a) x-direction, (b) y-direction, (c) z-direction, (d) rocking about x, and (e) rocking about y.
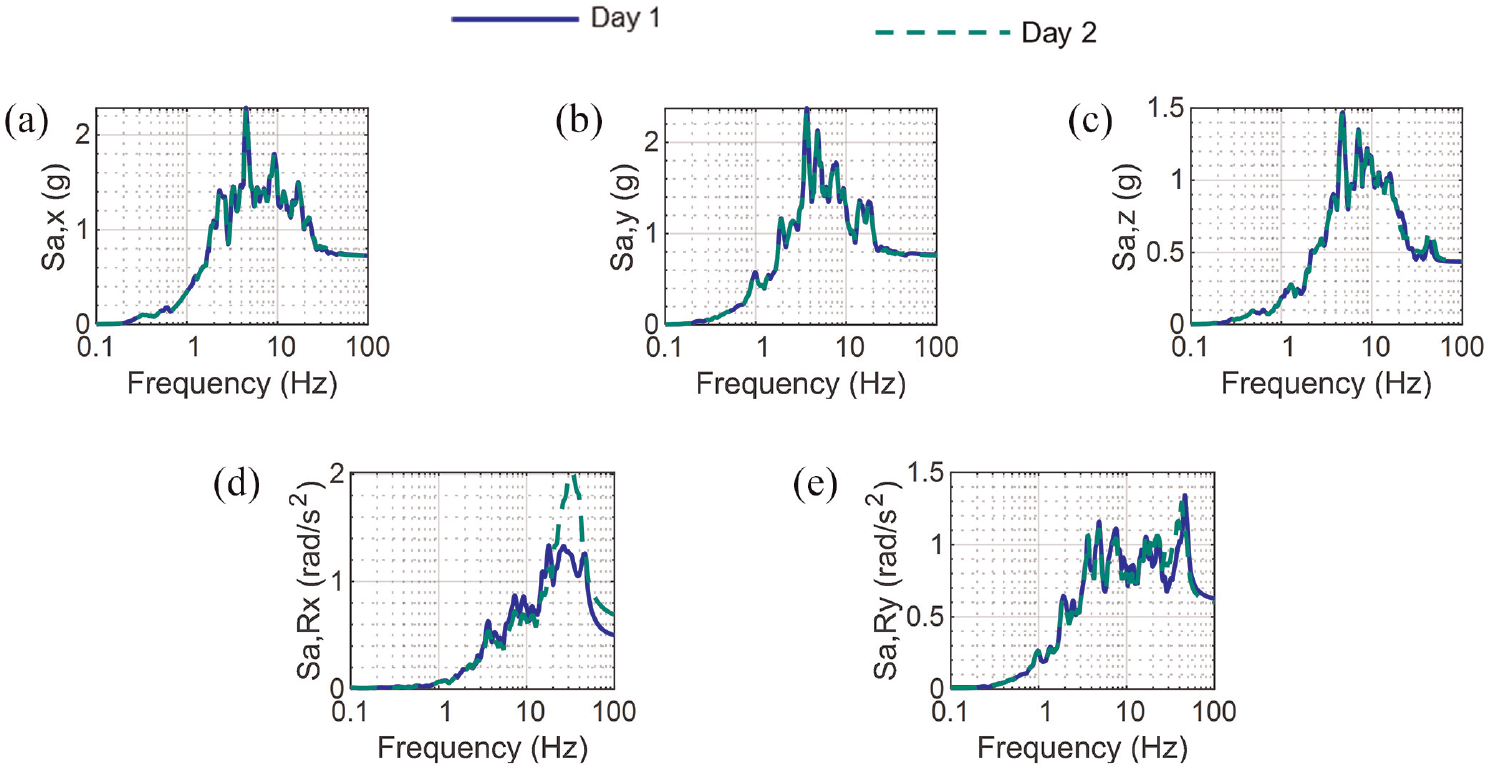
Acceleration spectra, KCE motion run on consecutive days, TFP-isolated configuration: (a) x-direction, (b) y-direction, (c) z-direction, (d) rocking about x, and (e) rocking about y.
Identification tests
The dynamic characteristics of individual HMOs (frequency and damping) were established by analyzing acceleration histories recorded from impact tests, wherein each HMO was struck by a hammer and the ensuing horizontal accelerations were recorded by top-mounted accelerometers. The 25.4 mm thick baseplate of each HMO was bolted to the 38.1 mm thick, 550 kg steel head placed on the laboratory floor. (The identification tests were also carried out in the final installed condition atop the vessel head with similar outcomes. A test similar to the on-floor test described here could be performed on prototype equipment to determine frequencies and damping.) Figure 11 presents normalized power spectral density (PSD) plots of the acceleration responses for the four HMOs. The first-mode frequencies of the four HMOs at the model scale were 4.5, 11.8, 19.9, and 27 Hz. (At the prototype scale, these correspond to HMOs with first-mode frequencies of 2.8, 7.4, 12.4, and 16.9 Hz, respectively.) The damping ratios in the first modes of HMO2 and HMO4 were evaluated by fitting exponential functions, as shown in Figure 12b and d, to the modal acceleration histories extracted from the measured acceleration time series by applying a band-pass filter centered at the modal frequency. The recorded acceleration histories for HMO1 and HMO3 showed noticeable beats, (see recorded time series in Figure 12a and c), indicating excitation of closely spaced vibrational modes in the two orthogonal directions due to hammer impact along one direction. The damping in these two cases was estimated using an approach similar to that presented in the study by Mir and Whittaker (2022a), which involved curve fitting using modal parameters of two closely spaced modes as the unknowns in a least squares solver. Figure 12 presents the recorded and the fitted data for the four HMOs. The HMOs were very lightly damped, with damping less than 0.08% of critical, and substantially smaller than what might be anticipated for the reactor-specific, head-mounted equipment of Figure 1.
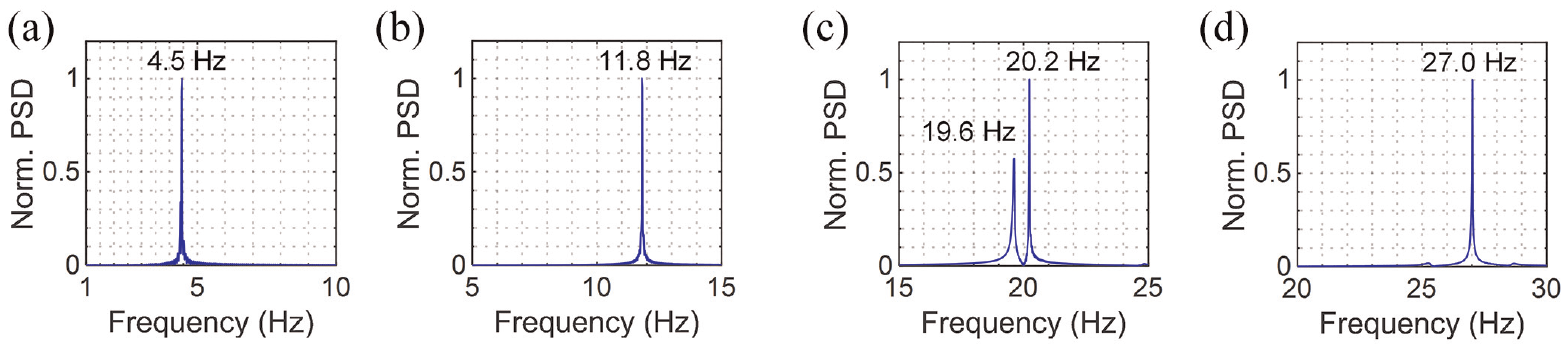
PSD, acceleration response of HMOs, hammer impact tests: (a) HMO1, (b) HMO2, (c) HMO3 (mean = 19.9 Hz), and (d) HMO4.
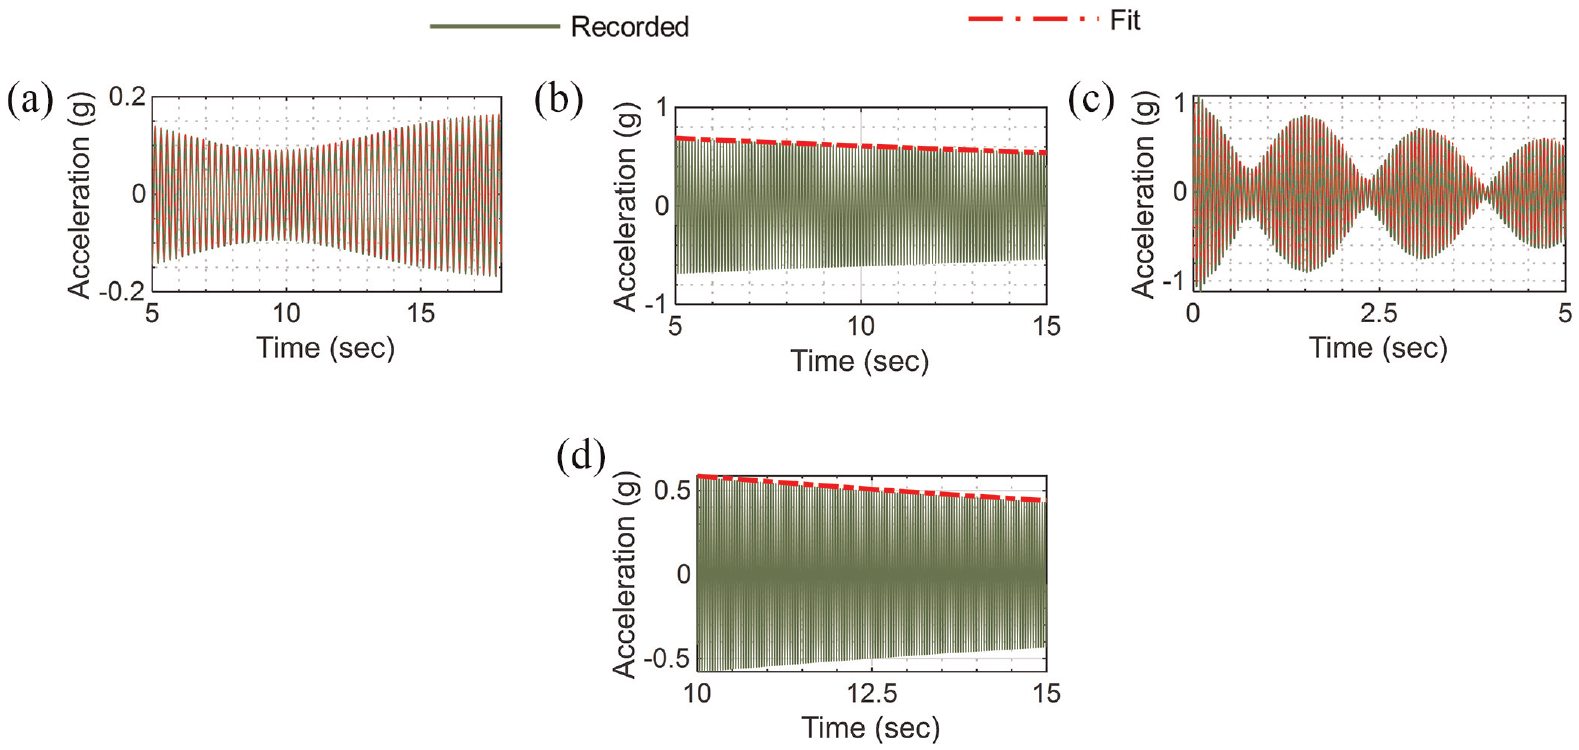
Curve fitting for estimation of modal damping: (a) HMO1, damping = 0.025%; (b) HMO2, damping = 0.03%; (c) HMO3, damping = 0.08%; and (d) HMO4, damping = 0.03%.
Experimental results
Isolation-system behavior and peak HMO responses in the fixed-base and base-isolated configurations are presented in this section. Figure 13 presents response spectra of the acceleration time series recorded above and below the isolation interface in the SFP-isolated configuration for the 3D KCE motion. The peak horizontal accelerations above the isolation system are reduced significantly. The response spectrum ordinates above the isolation system in the vertical direction are increased slightly at high frequencies (> 20 Hz). Rocking accelerations above the isolation interface are also amplified at high frequencies. The observations regarding amplification of vertical and rocking accelerations are identical for other inputs in the SFP-isolated configuration and inputs to the TFP-isolated configuration.
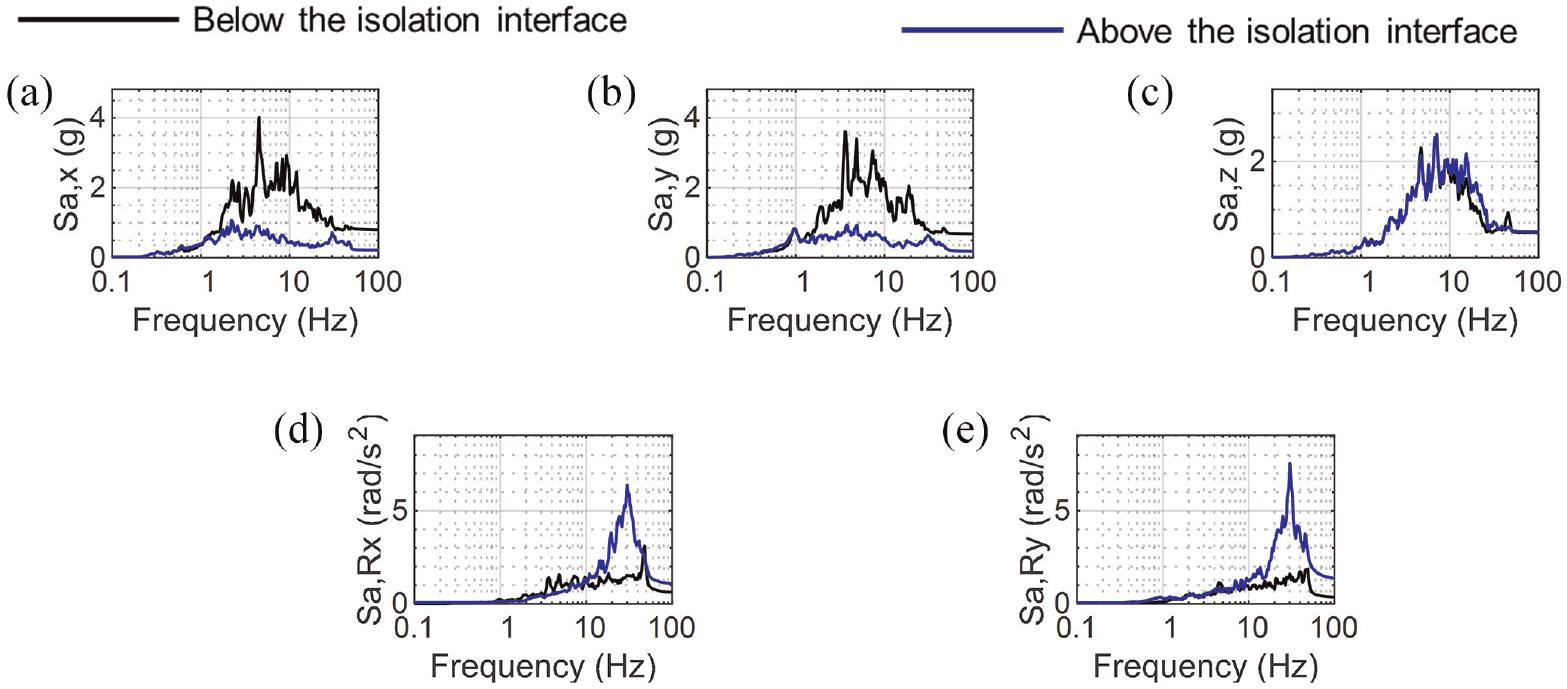
Acceleration spectra above and below the isolation interface, SFP-isolated configuration, 3D KCE motion: (a) x-direction, (b) y-direction, (c) z-direction, (d) rocking about x, and (e) rocking about y.
This amplification in vertical and rocking accelerations is due to the (relatively) small axial stiffness of the model-scale bearings in the vertical direction. Per Table 1, the average vertical stiffness of the SFP (TFP) bearings is approximately 3% of the axial stiffness of a cylindrical steel column with diameter equal to the slider diameter and height equal to that of the bearing (nested slider assembly); see Figure 4. Tight tolerances are required in the slider assemblies and outer plates for achieving high axial stiffness. Fabricating the bearings to such tolerances at the model scale is challenging. For prototype scale bearings, a higher axial stiffness, equal to 10% of column stiffness can be achieved (Mir et al., 2022b).
Responses in the fixed-base and base-isolated configurations are compared next. Since smaller amplitude motions were used in the fixed-base tests, those responses were increased by the scale factors of Table 2 to enable a more direct comparison of results, noting that the assumed linear behavior of the HMOs was confirmed by analysis. Figure 14 presents acceleration spectra at the top of the vessel (i.e. input to the HMOs) in the three test configurations for the four 3D inputs. The reduction in accelerations input to the HMOs in the base-isolated configurations is evident in Figure 14. Peak HMO responses (x-direction displacements, accelerations, and corresponding strains) for the 3D inputs in the fixed-base and base-isolated configurations are presented in Figures 15 to 17. In general, there are significant reductions in HMO responses in the two base-isolated configurations. The reductions in peak responses are greatest for the high intensity KCE input (factor of 4 for HMO1), which is an expected outcome. There are cases where there is no reduction, and indeed amplification, but these are related to differences in rocking accelerations across experiments, as explained below.
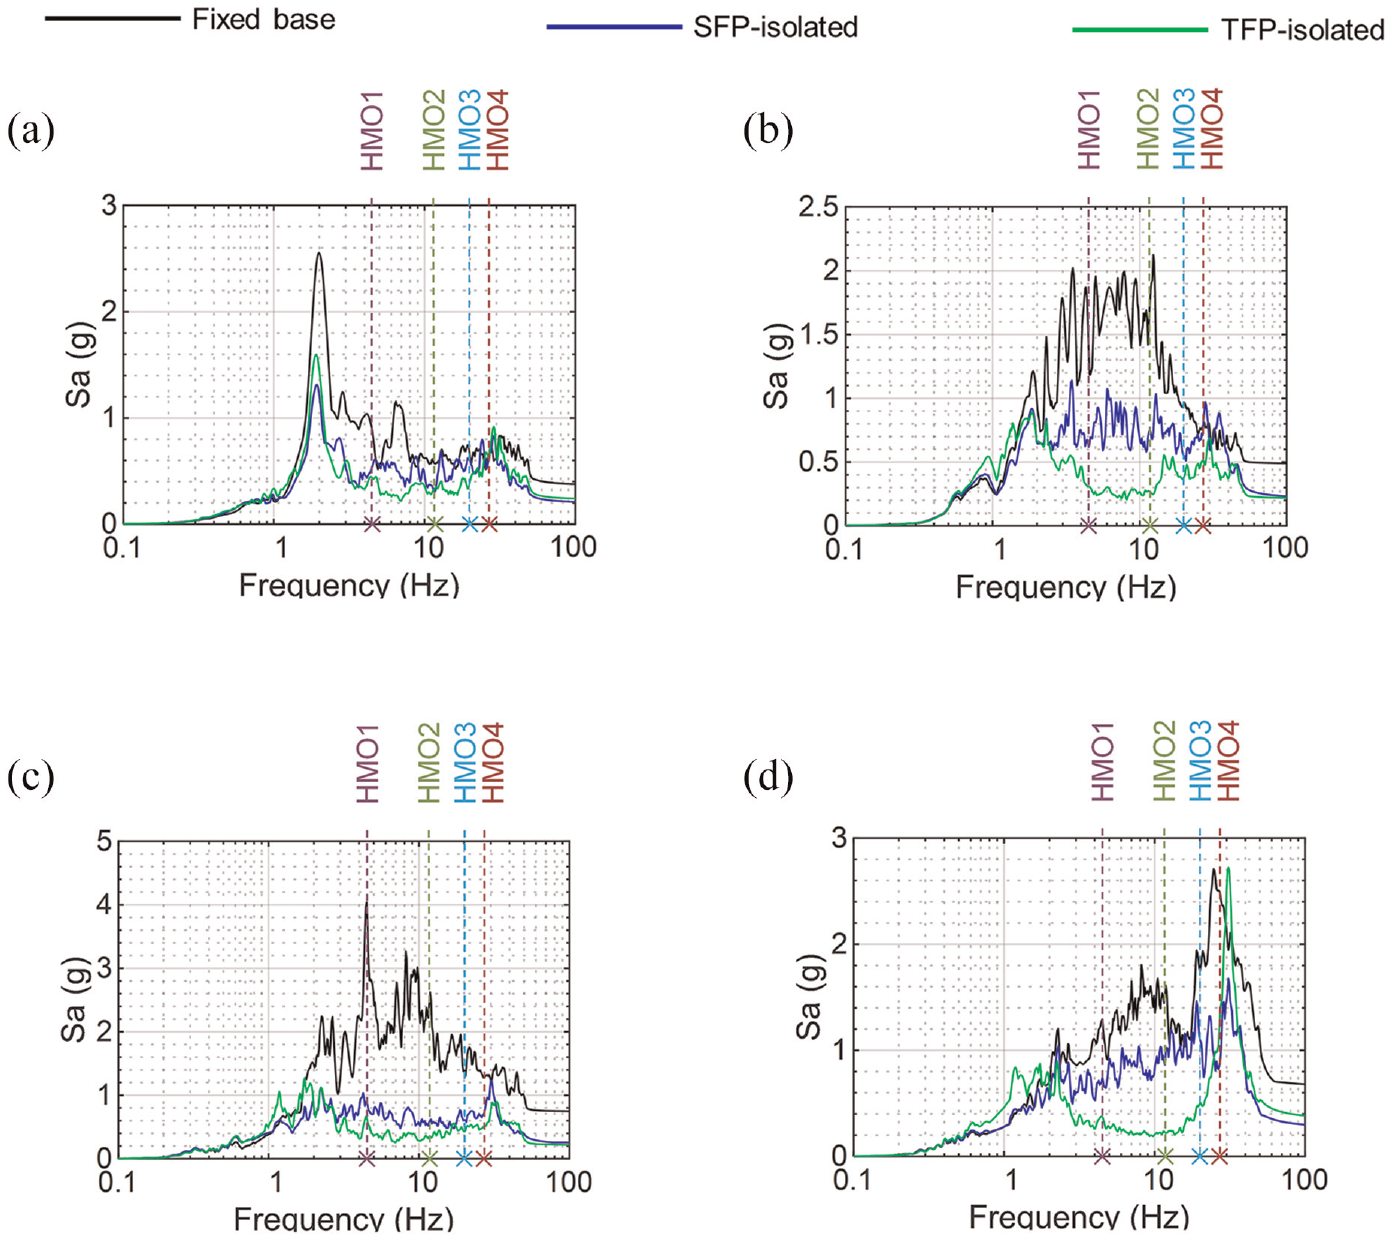
Acceleration spectra in the x direction at the top of the vessel, three test configurations, damping = 2%, frequencies of HMOs identified: (a) 3D CCE; (b) 3D ECE; (c) 3D KCE; (d) 3D BBM; peak input x-direction accelerations of 0.32, 0.40, 0.57, and 0.37 g, respectively.
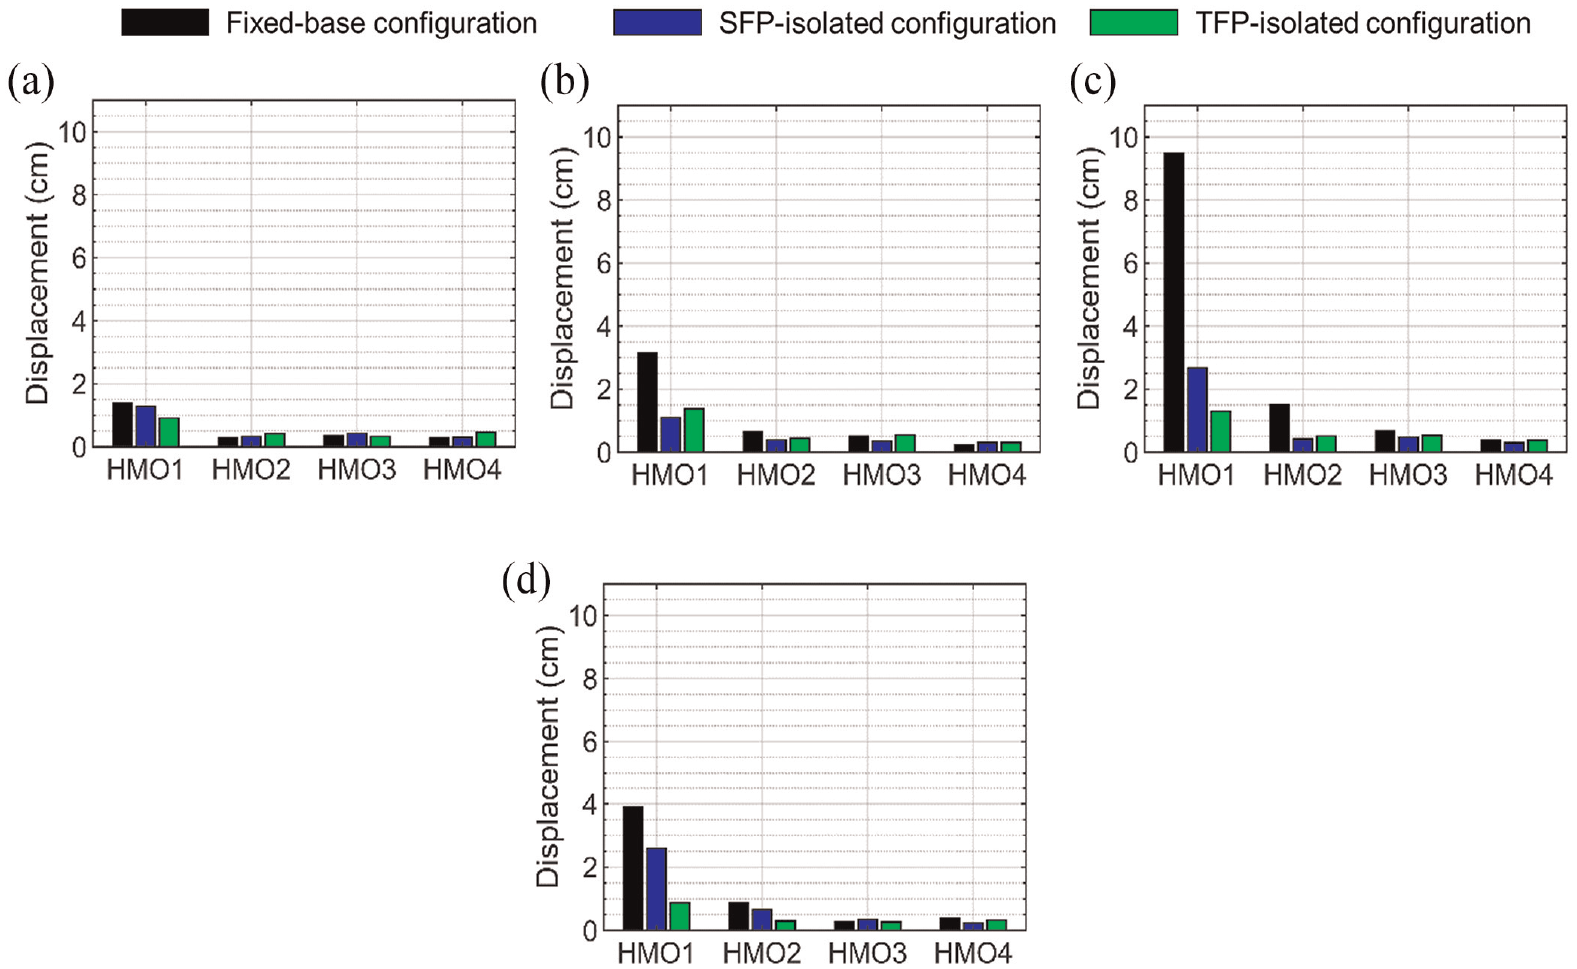
Peak x-direction displacements of HMOs, different support configurations, 3D inputs: (a) CCE; (b) ECE; (c) KCE; and (d) BBM; peak input x-direction accelerations of 0.32, 0.40, 0.57, and 0.37 g, respectively.
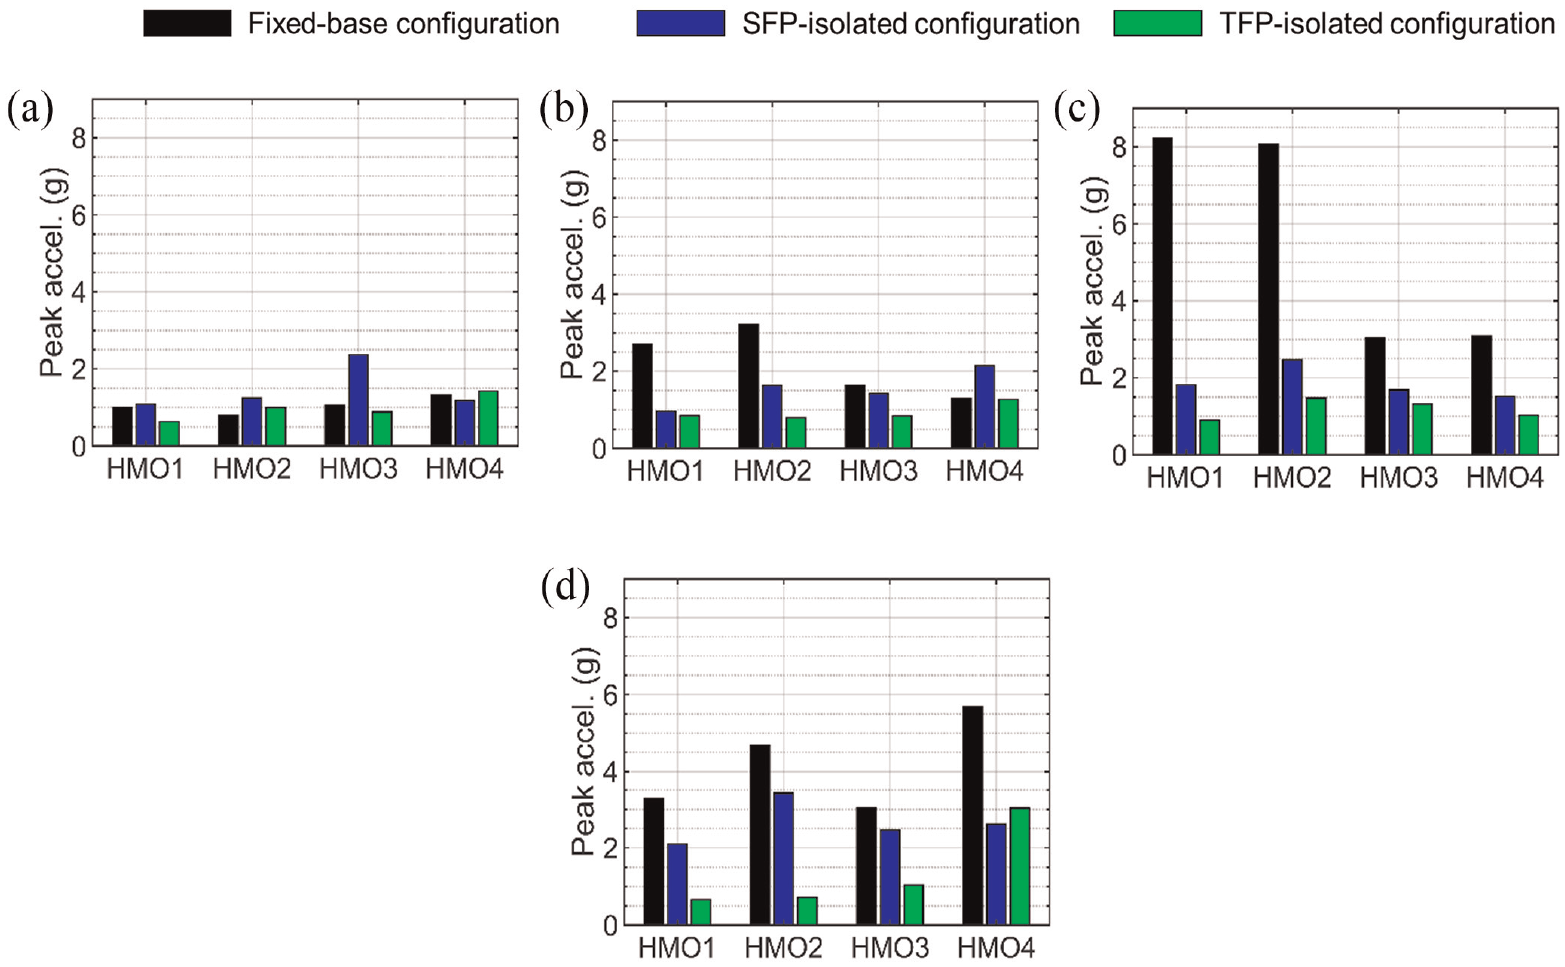
Peak x-direction accelerations of HMOs, different support configurations, 3D inputs: (a) CCE; (b) ECE; (c) KCE; and (d) BBM; peak input x-direction accelerations of 0.32, 0.40, 0.57, and 0.37 g, respectively.
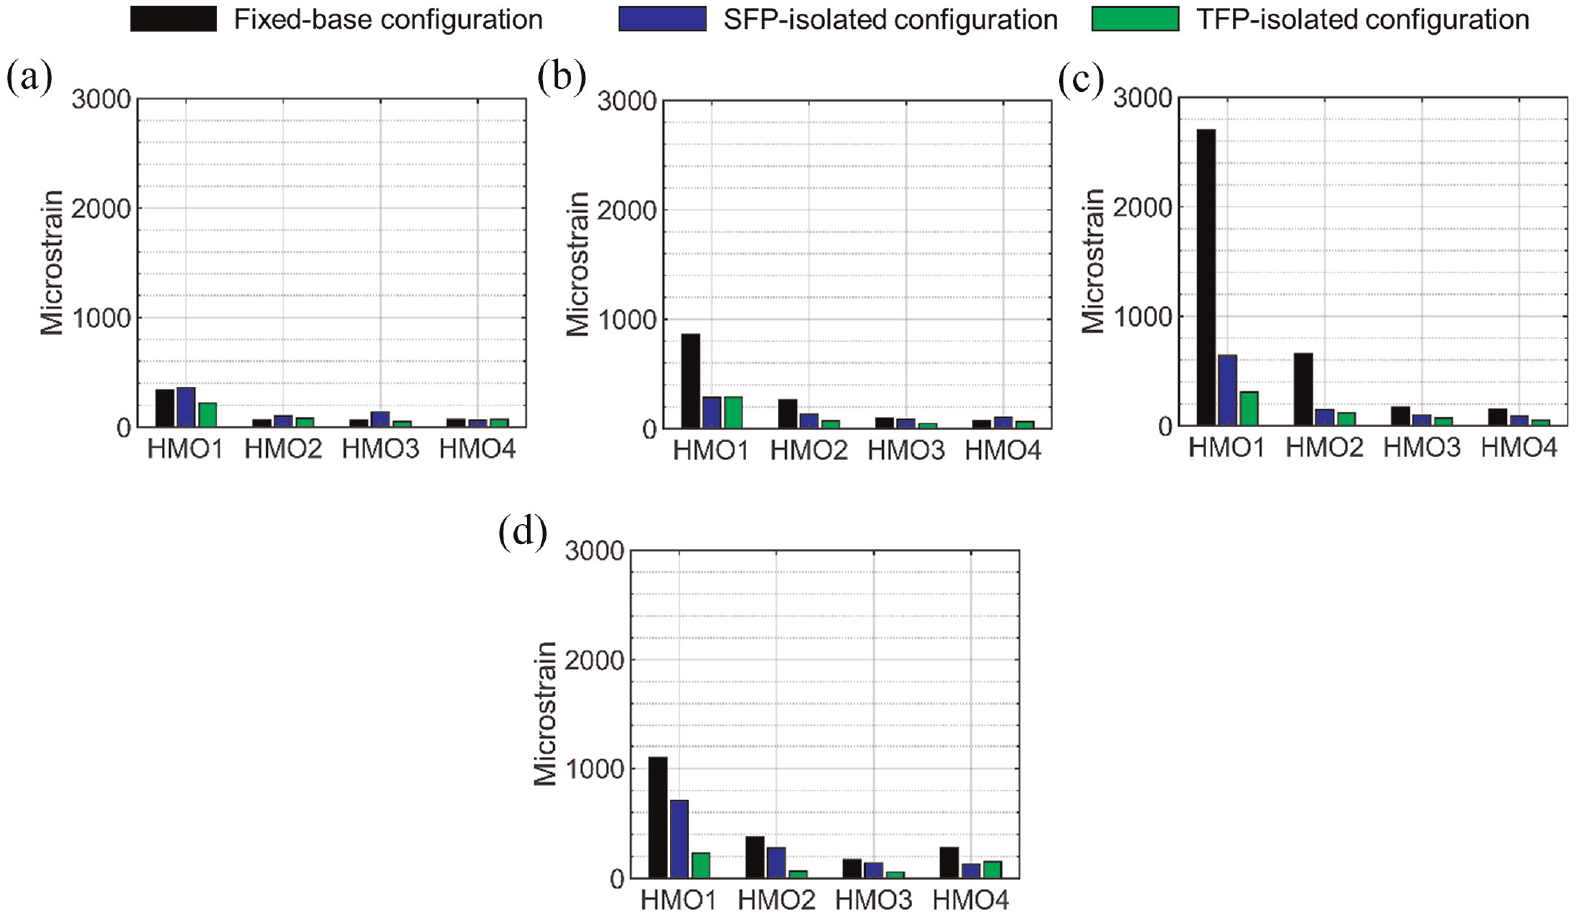
Peak strains of HMOs, different support configurations, 3D inputs: (a) CCE; (b) ECE; (c) KCE; and (d) BBM; peak input x-direction accelerations of 0.32, 0.40, 0.57, and 0.37 g, respectively.
The isolator displacements for the SFP-isolated configuration in tests with the 3D CCE, 3D ECE, 3D KCE, and 3D BBM motions were 3.8, 3, 4.8, and 1.3 cm, respectively. The corresponding isolation system displacements in the TFP-isolated configuration were greater and equaled 6.4, 4.3, 6.4, and 3.6 cm. This is an expected outcome because the TFP isolators had a higher sliding period (1.96 s) than the SFP isolators (1.38 s).
The differences in rocking inputs across the tests make a direct comparison of peak HMO responses across test setups impossible. The data presented in Figure 15 through Figure 17 do not address the differences in the rocking responses. The rocking inputs affect the responses of the HMOs since they are located at a significant height above the earthquake-simulator platform. The relatively stiff HMOs, namely, HMO3 and HMO4, are affected most because of the high-frequency content in the rocking accelerations. As an example, consider the peak accelerations for HMO4 presented in Figure 16b: the peak acceleration of the HMO for the 3D ECE input in the SFP-isolated configuration (2.2 g) is greater than that in the fixed-base configuration (1.3 g). Figure 18 presents acceleration spectra recorded at the base and head of the vessel in the fixed-base and SFP-isolated configurations for the 3D ECE input. Spectra are shown for two values of damping: 0.03% and 5% of critical, where the smaller value is the damping for HMO4 estimated from the identification tests. The horizontal spectral acceleration at the top of the vessel (i.e. input to the HMOs) around the frequency of HMO4 (27 Hz) in the SFP-isolated case is greater than the corresponding spectral acceleration in the fixed-base case: compare the green dashed line and the blue dashed line in Figure 18b. This amplification of horizontal accelerations at the top of the vessel is due to rocking inputs to the test specimen (see section 5.2.2 in Mir et al. (2022a) for details).
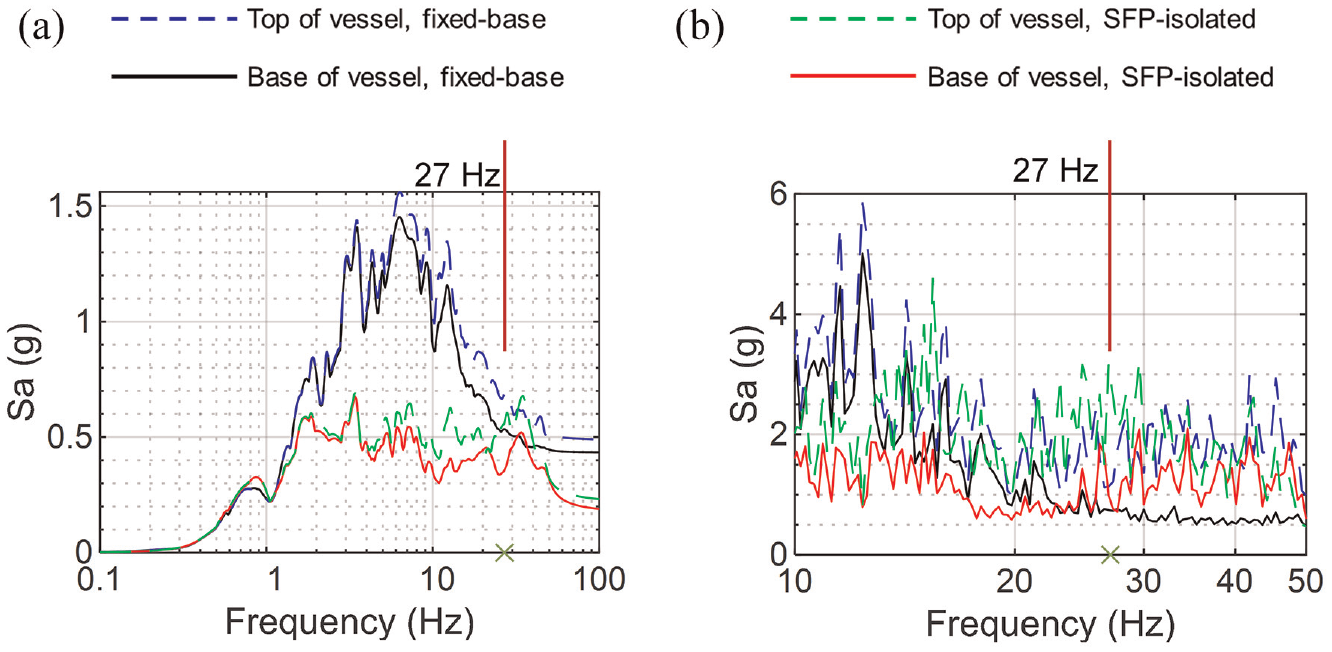
Acceleration spectra in the x direction at the base and top of the vessel, fixed-base and SFP-isolated configurations, 3D ECE input, frequency of HMO4 = 27 Hz: (a) damping = 5% and (b) damping = 0.03%.
Numerical modeling
This section presents details of the numerical model of the test specimen that was used for response-history analyses.
SAP2000 model and numerical results
A numerical model of the test specimen was constructed in SAP2000 (Computers and Structures, Inc. (CSI), 2017). The vessel, base plate, and the top plate were modeled using rigid shell elements with the mass density of carbon steel. (Modeling the test vessel using rigid shell elements was justified because the impulsive-mode frequency of the vessel-fluid system was higher than 100 Hz, as calculated per Malhotra et al. (2000)). The water inside the test vessel was simulated in the SAP model as a distributed mass on the wall of the vessel (see Mir et al. 2022a). The head-mounted oscillators were modeled using beam elements with material properties of aluminum: mass density equal to 2700 kg/m3 and elastic modulus equal to 70 GPa. Rigid plates with distributed masses were attached to the free ends of the HMOs to simulate the added masses, as noted previously. Figure 19 presents an isometric view of the SAP2000 numerical model.
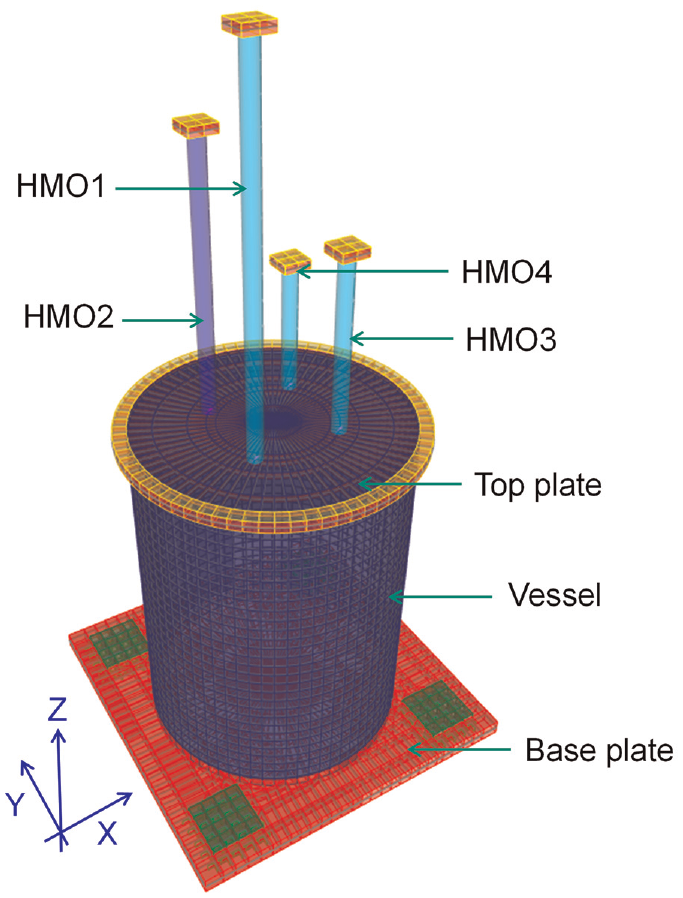
Numerical model in SAP2000.
The HMOs were connected to the head via flexible, bolted endplates. Rigidly connecting the HMOs to the head of the vessel resulted in HMO frequencies higher than those measured in the hammer tests. Linear rotational springs were introduced at the connection of the HMOs to the head, and spring stiffnesses were calibrated using frequencies from the system identification tests. Table 3 presents the computed first-mode frequencies of the HMOs with and without the rotational springs. The stiffness of the rotational springs adopted for each of the HMOs is identified in the table. The differences in the frequencies of each HMO make clear the importance of accurately characterizing the moment–rotation relationship of the connection, which might be nonlinear, for the dynamic analysis of prototype head-mounted equipment.
Numerical first-mode frequencies of HMOs, with and without rotational springs
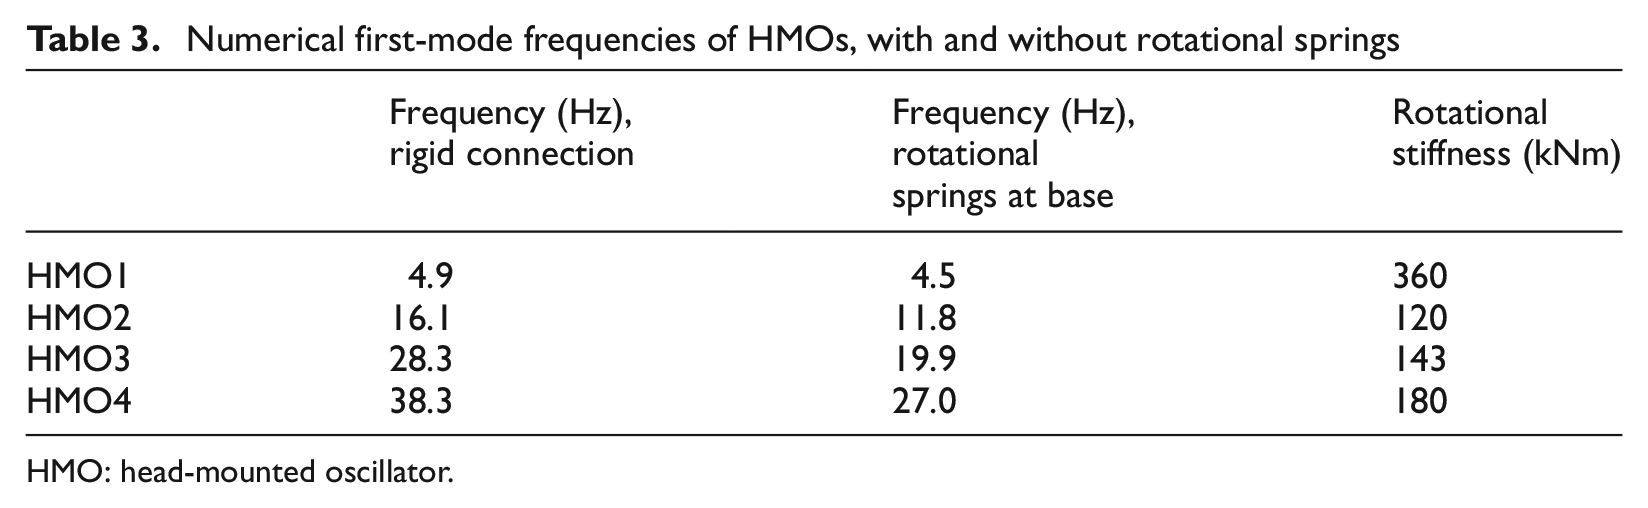
HMO: head-mounted oscillator.
The flexural vibration modes of the HMOs were assigned damping values obtained from the identification tests described earlier. The SAP model was analyzed for the fixed-base and the base-isolated conditions utilizing the five-directional inputs recorded on the base of the vessel in the experiments and below the isolation interface, respectively. In the fixed-base condition, the base plate was fixed at the four locations shown in green in Figure 19. In the two base-isolated configurations, four isolators of a kind (SFP or TFP) were installed under the base plate at the centers of the green-colored squares in Figure 19. The SFP and TFP isolators were modeled using the friction isolator link element and the triple pendulum isolator link element, respectively, in SAP2000. A detailed description of the key inputs used to define the link elements in SAP2000 is presented in Mir et al. (2022a) and not reproduced here. (The link element definitions in Mir et al. (2022a) correspond to a load of 18.9 kN, which was the gravity weight per bearing in the first set of experiments on the molten salt reactor, and is slightly smaller than the weight per bearing here: 20.2 kN). Table 4 presents information on the isolation-system modal frequencies, obtained from eigen analysis of the numerical models. The vertical and rocking modes of the SFP- or TFP- isolated structure lie around and above 30 Hz. (The experimental rocking spectra above the isolation system interface, presented in Figure 13d and 13e, peak at about 30 Hz, which is nearly equal to the rocking mode frequency of the isolated specimen presented in Table 4.) Whereas the horizontal modes of the isolation system are damped by hysteresis in the bearings, damping must be specified for the rocking and vertical modes. For this study, a value of 10% damping was used for these modes, similar to the value used in another study utilizing the same earthquake simulator (Lal et al., 2023).
Isolation-system modes
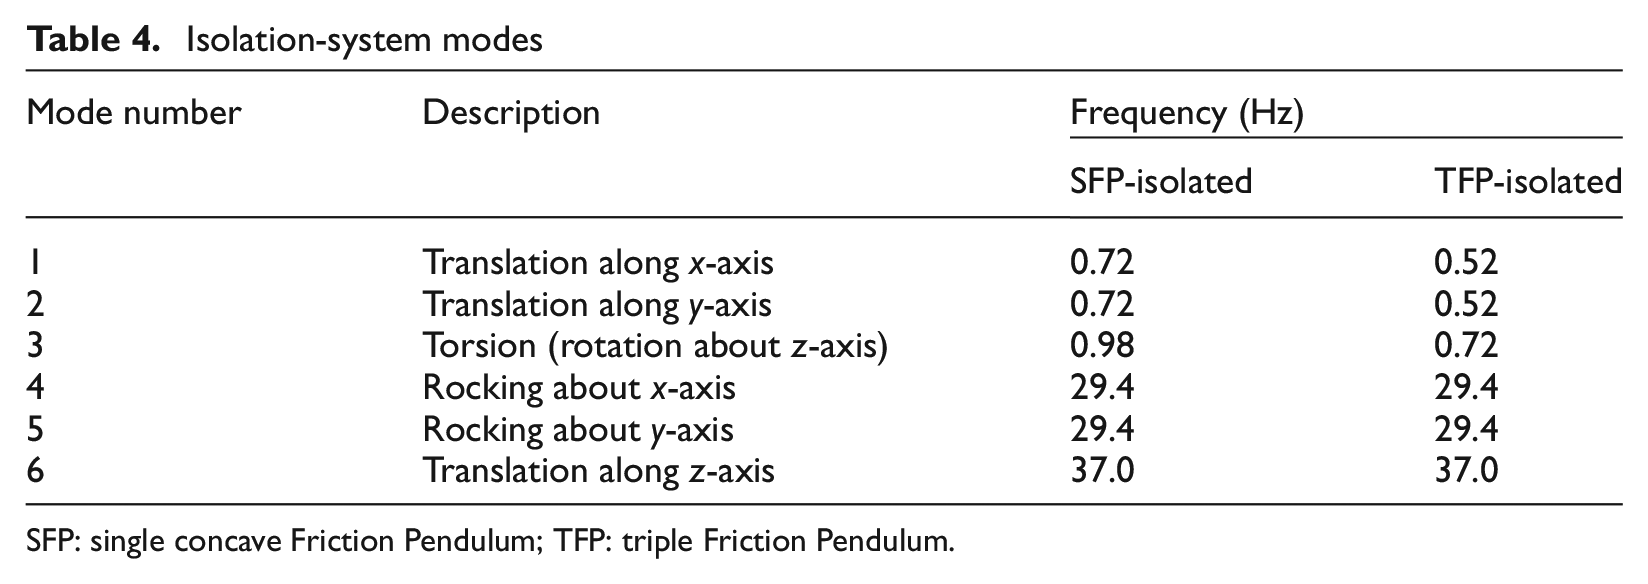
SFP: single concave Friction Pendulum; TFP: triple Friction Pendulum.
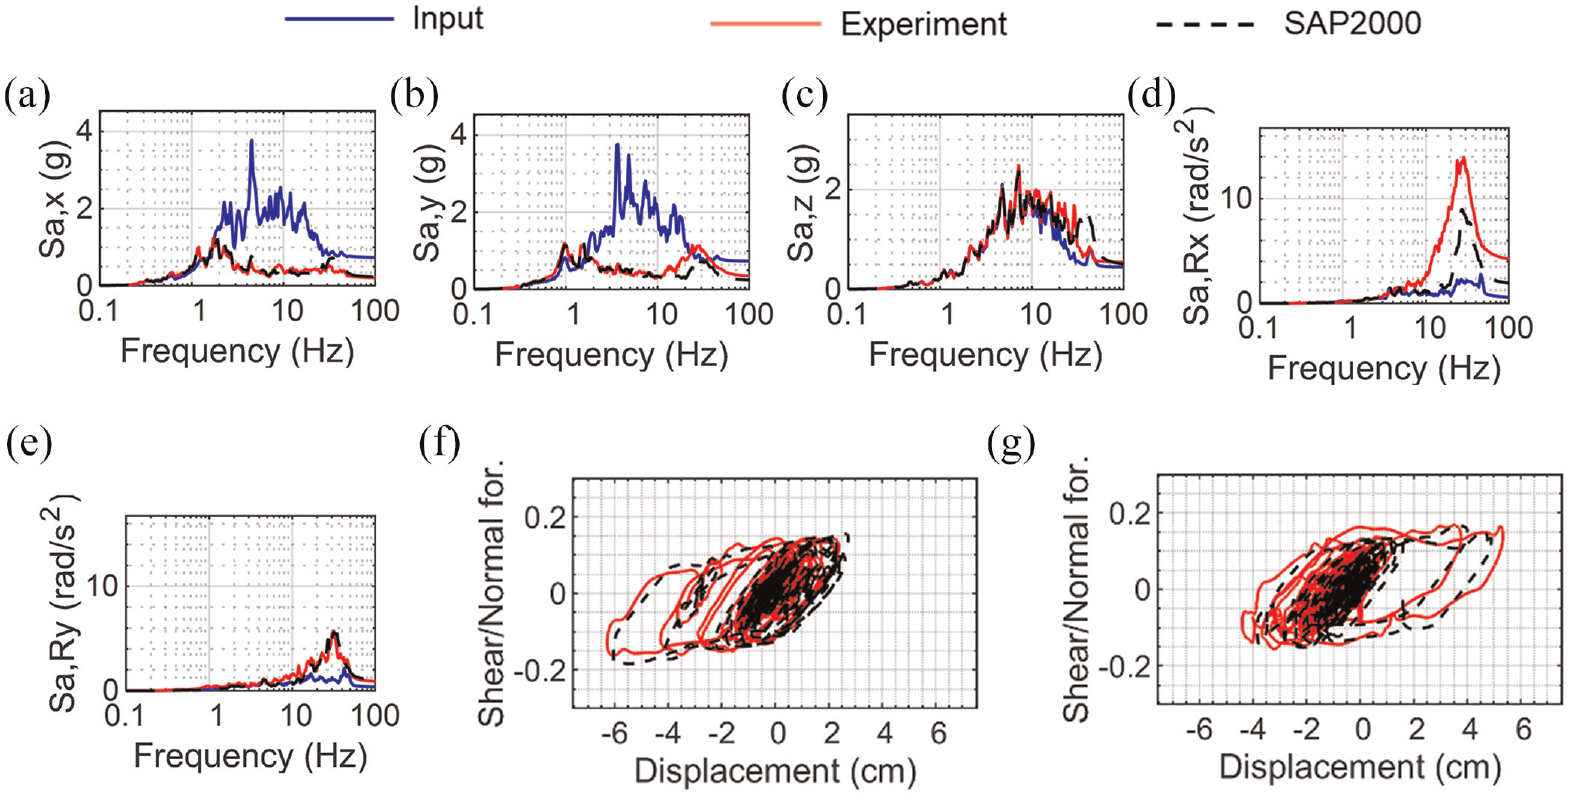
Figures 20 and 21 present sample numerical and measured isolation-system responses (acceleration spectra and force–displacement loops) in the SFP- and TFP- isolated configurations, respectively, for a 3D input. The input spectra reported in Figures 20 and 21 are computed using acceleration histories recorded immediately below the isolation interface. These spectra are presented together with those generated using numerical and experimental output accelerations on the base plate of the vessel, immediately above the isolation system. Similar to Mir et al. (2022a), the agreement between the measured results and numerical predictions for isolation-system responses is excellent. The absolute differences between the peak measured and numerical responses in the SFP-isolated (TFP-isolated) configurations are less than 8%, 6%, and 14% (9%, 7%, and 13%), on average, for isolator displacements, reaction forces, and accelerations above the isolation interface, respectively. (Six inputs were considered here: two x-direction inputs and four three-directional inputs.) The accuracy of the numerically predicted vertical and rocking accelerations are poorer than for other isolation-system responses because the axial stiffness of the bearings used in the experiments is small and highly dependent on the imposed axial load, which is affected by the input vertical acceleration (see Appendix A of Mir et al. 2022d). The load dependence of axial stiffness in the model-scale isolators is not captured by the numerical model, which assumes linear stiffness for the isolators in the axial direction. Damping in the vertical and rocking modes is also difficult to characterize from the experimental data.
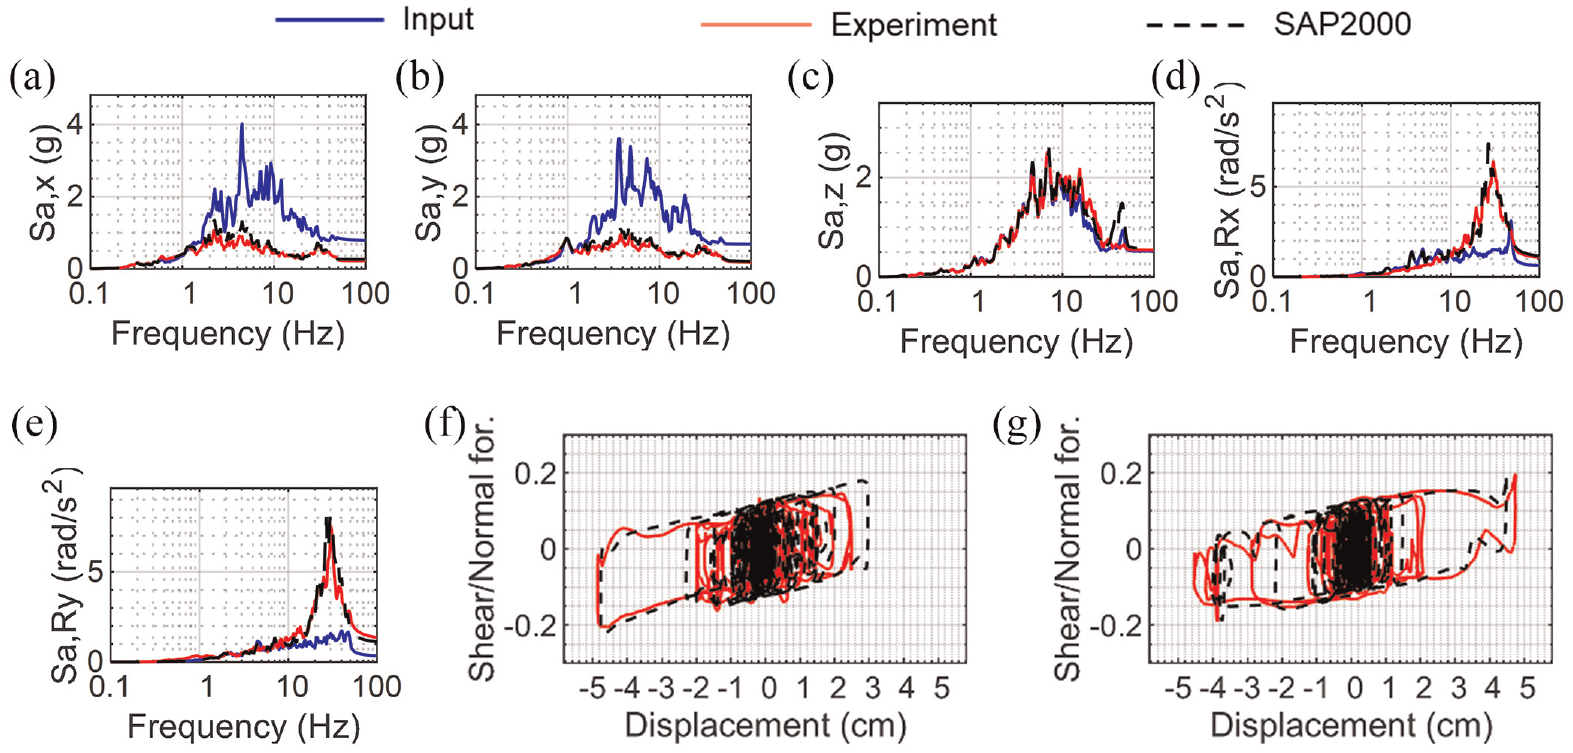
Numerical and experimental isolation-system responses, 3D KCE motion, SFP-isolated configuration, acceleration spectra, 5% damping: (a) acceleration spectra, x; (b) acceleration spectra, y; (c) acceleration spectra, z; (d) acceleration spectra, rocking about x-axis; (e) acceleration spectra, rocking about y-axis; (f) normalized force–displacement loop, x; and (g) normalized force–displacement loop, y.
Numerical and experimental isolation-system responses, 3D KCE motion, TFP-isolated configuration, acceleration spectra, 5% damping: (a) acceleration spectra, x; (b) acceleration spectra, y; (c) acceleration spectra, z; (d) acceleration spectra, rocking about x-axis; (e) acceleration spectra, rocking about y-axis; (f) normalized force–displacement loop, x; and (g) normalized force–displacement loop, y.
Figure 22 through Figure 24 present sample numerical and experimental HMO acceleration responses for a 1D and a 3D input in the fixed-base and base-isolated configurations. The percentage differences between the numerically predicted and measured peak horizontal accelerations for all inputs and setups considered here are listed in Table 5 through Table 7. The measured frequencies of the HMOs are recovered exactly in Figure 22 through Figure 24 because the base rotational springs were calibrated. The average absolute differences in the peak numerical and measured horizontal HMO accelerations are 18%, 44%, and 41% in the fixed-base, SFP-isolated, and TFP-isolated configurations, respectively. The maximum absolute differences in the three configurations are 76%, 214%, and 145%. The greater differences in the peak accelerations in the isolated configurations are due to the challenges identified previously in modeling the rocking response of the model-scale isolation system; see Figure 21d for an example.
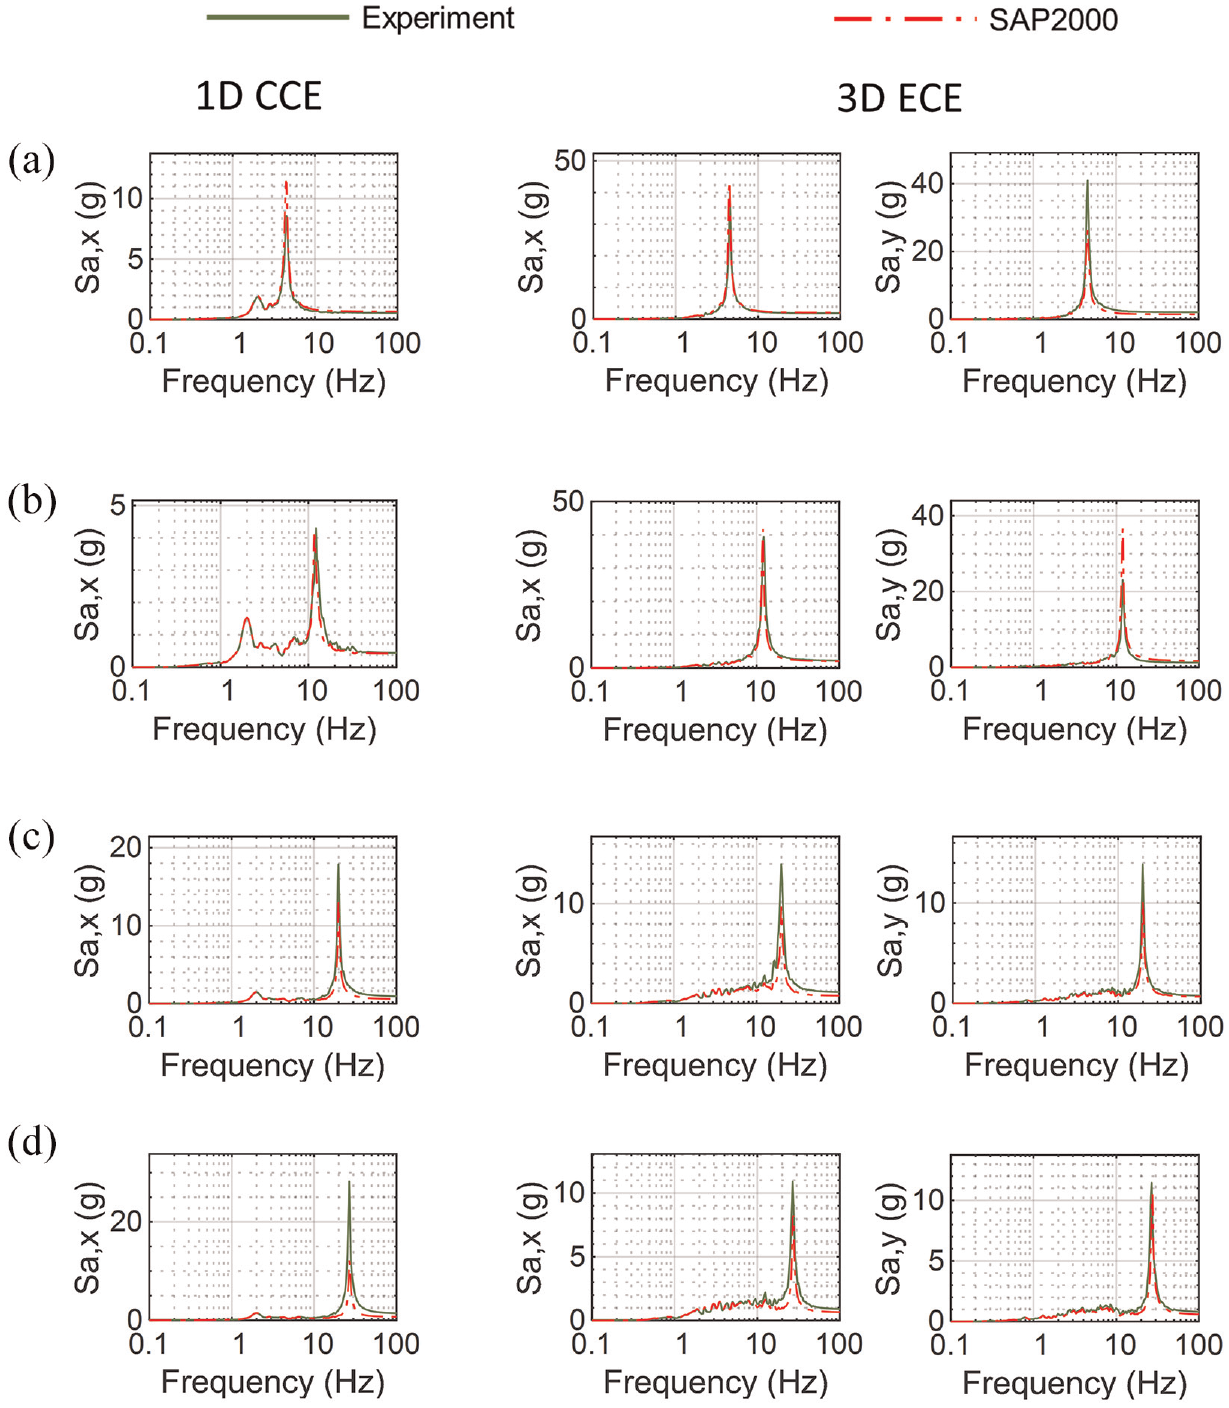
Numerical and experimental acceleration responses of HMOs, fixed-base configuration, spectra for 5% damping: (a) HMO1, (b) HMO2, (c) HMO3, and (d) HMO4.
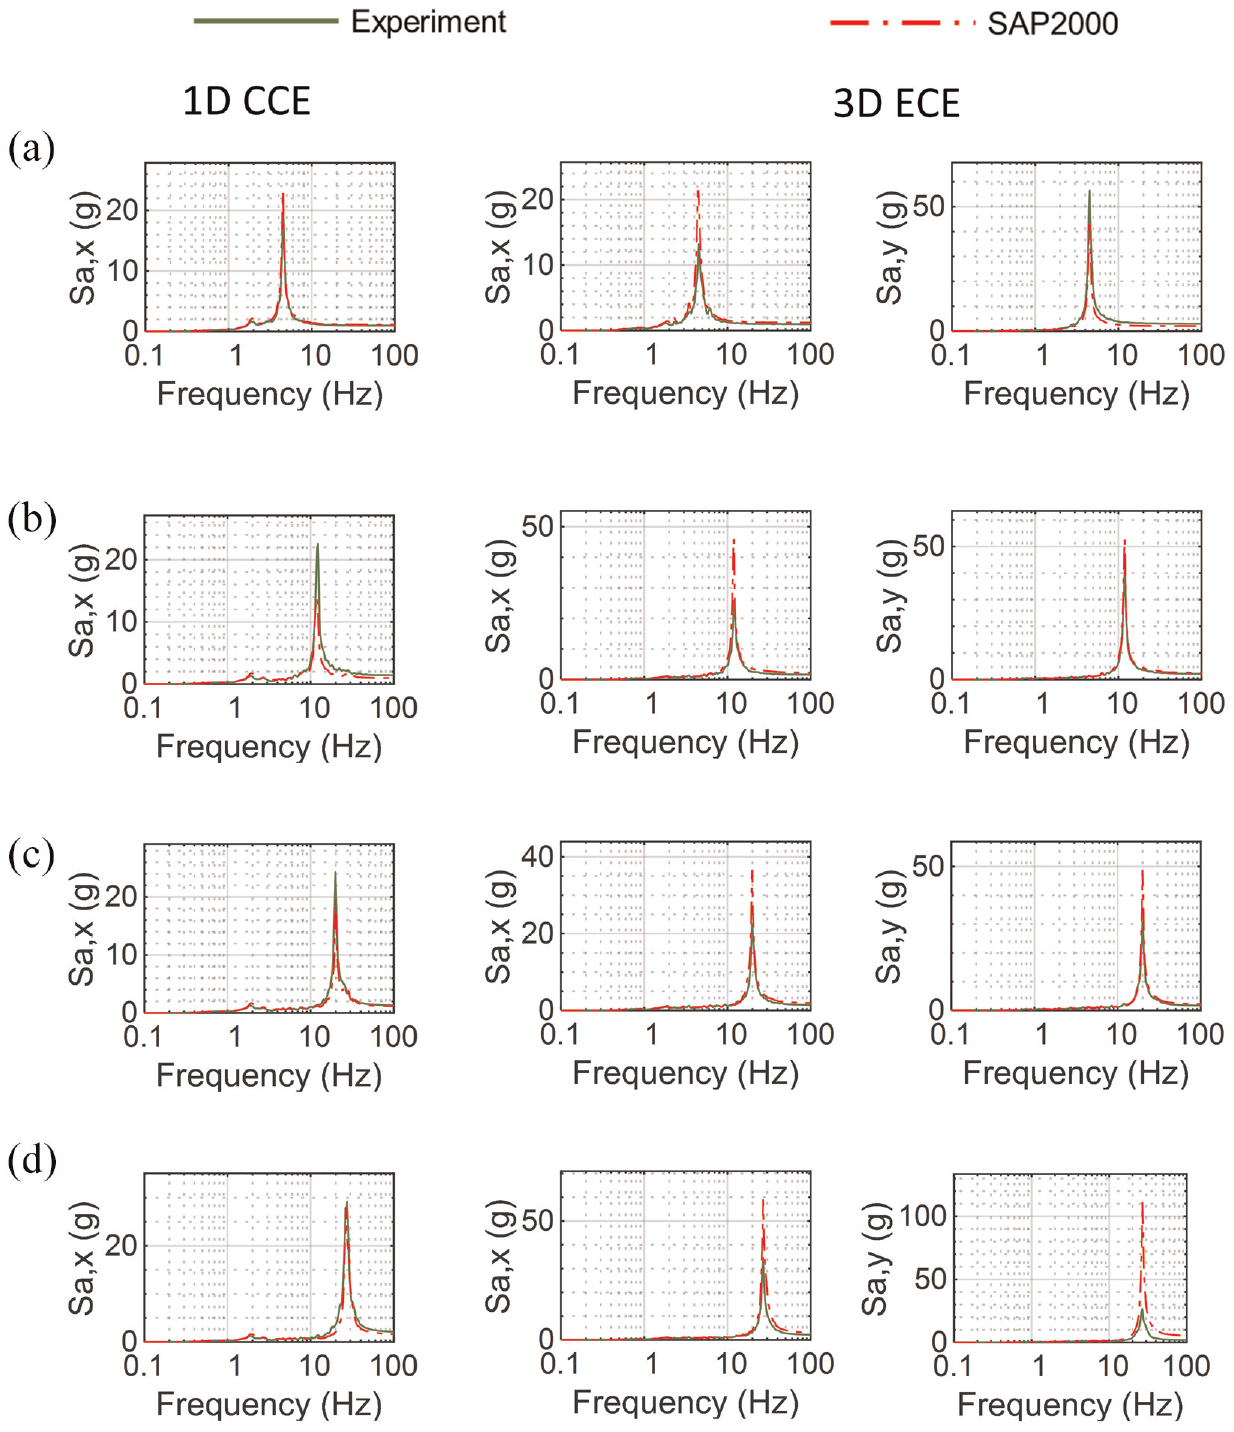
Numerical and experimental acceleration responses of HMOs, SFP-isolated configuration, spectra for 5% damping: (a) HMO1, (b) HMO2, (c) HMO3, and (d) HMO4.
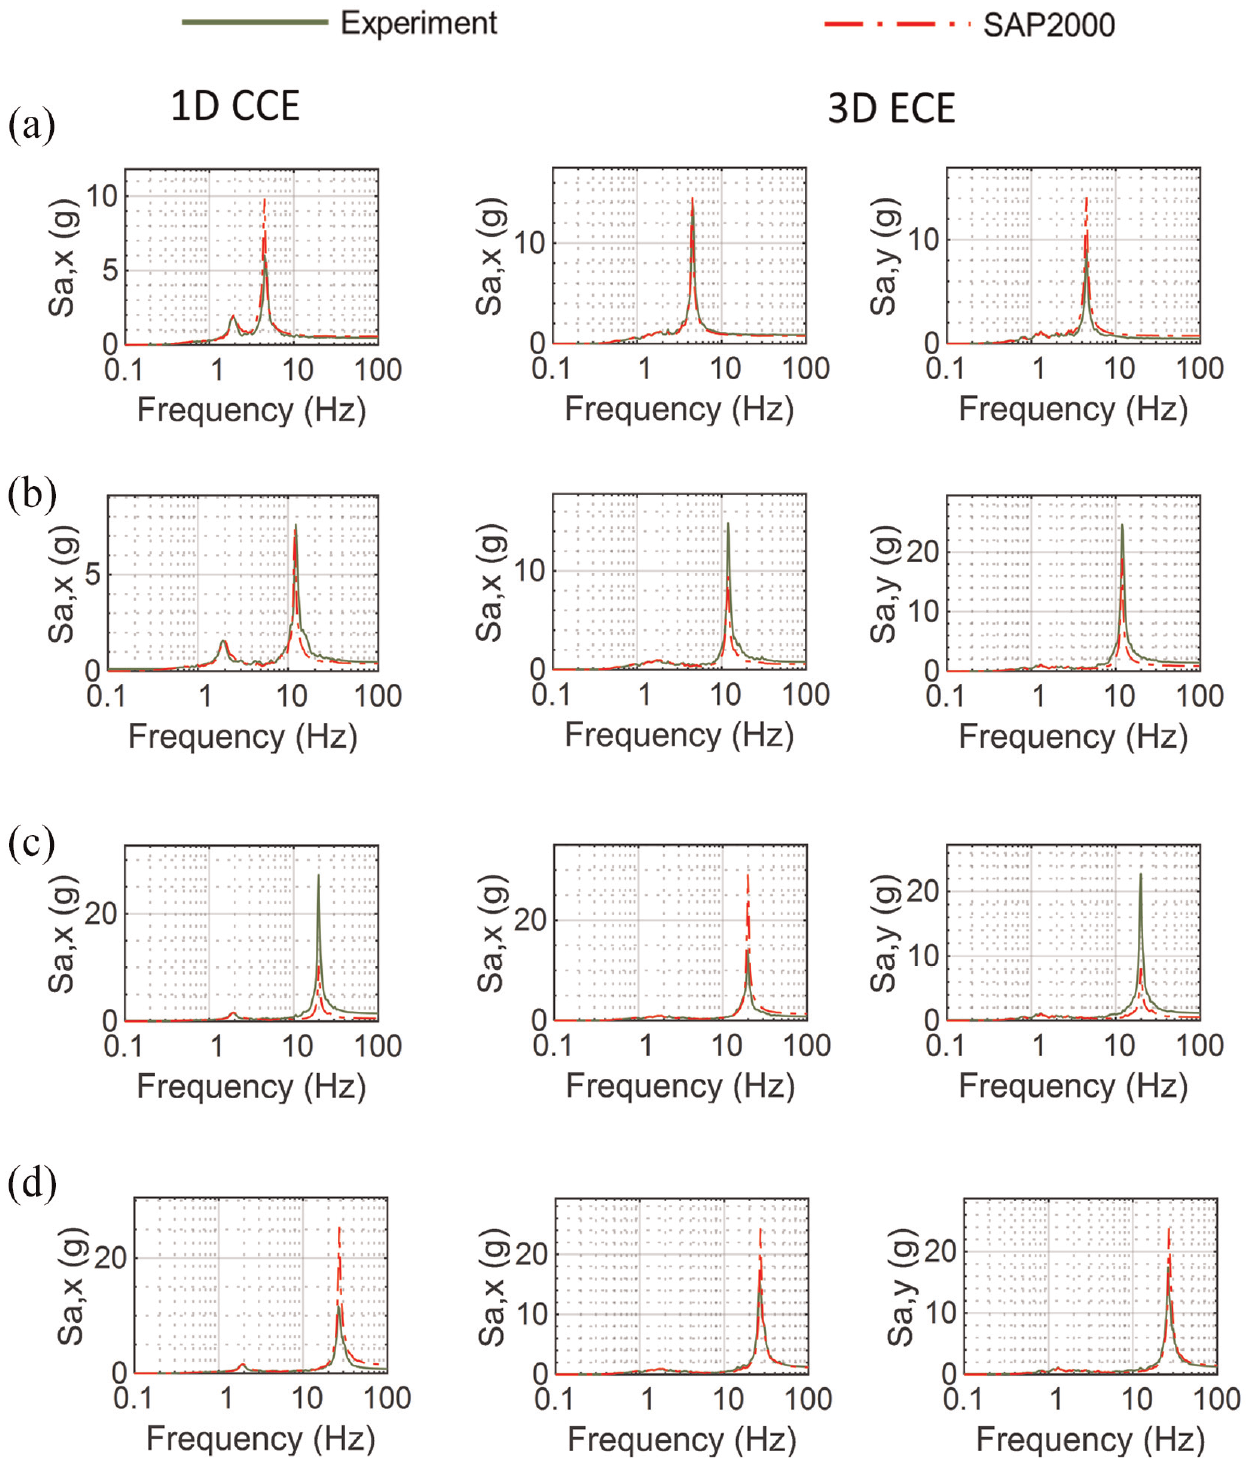
Numerical and experimental acceleration responses of HMOs, TFP-isolated configuration, spectra for 5% damping: (a) HMO1, (b) HMO2, (c) HMO3, and (d) HMO4.
Percentage differences between peak experimental and numerical values of HMO accelerations, fixed-base
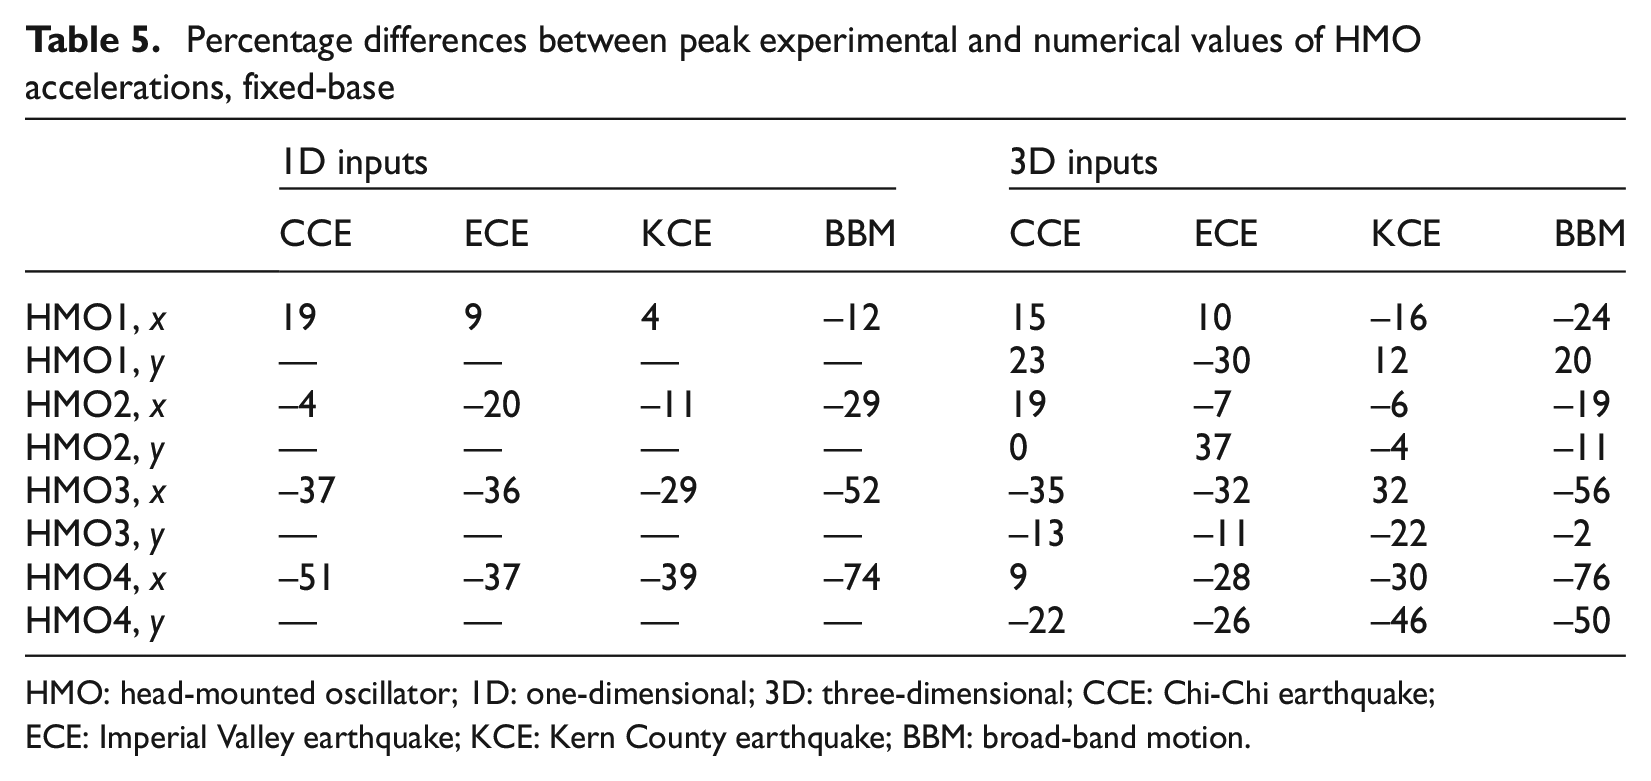
HMO: head-mounted oscillator; 1D: one-dimensional; 3D: three-dimensional; CCE: Chi-Chi earthquake; ECE: Imperial Valley earthquake; KCE: Kern County earthquake; BBM: broad-band motion.
Percentage differences between peak experimental and numerical values of HMO accelerations, SFP-isolated
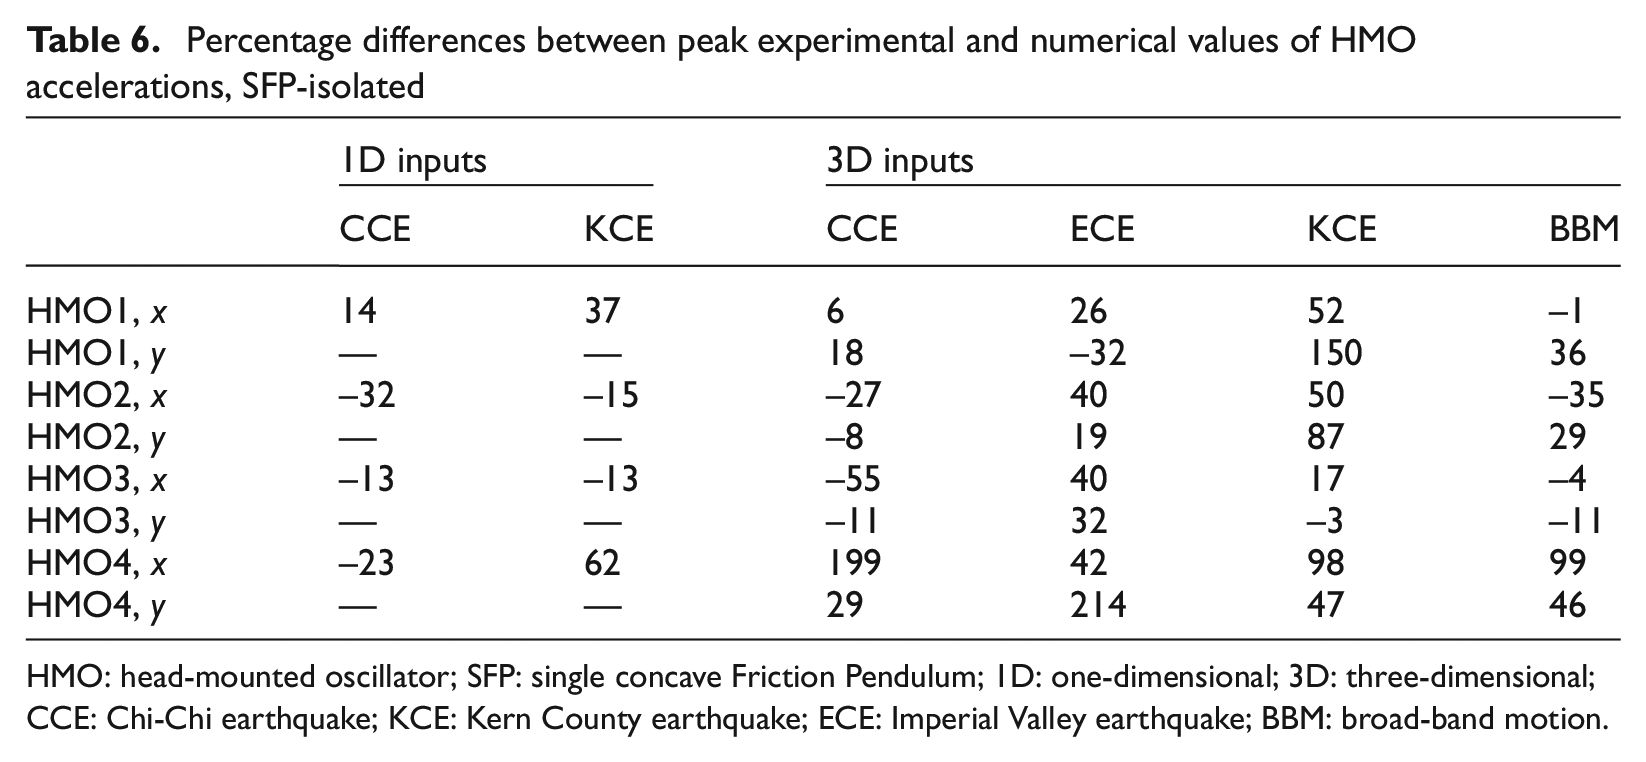
HMO: head-mounted oscillator; SFP: single concave Friction Pendulum; 1D: one-dimensional; 3D: three-dimensional; CCE: Chi-Chi earthquake; KCE: Kern County earthquake; ECE: Imperial Valley earthquake; BBM: broad-band motion.
Percentage differences between in peak experimental and numerical values of HMO accelerations, TFP-isolated
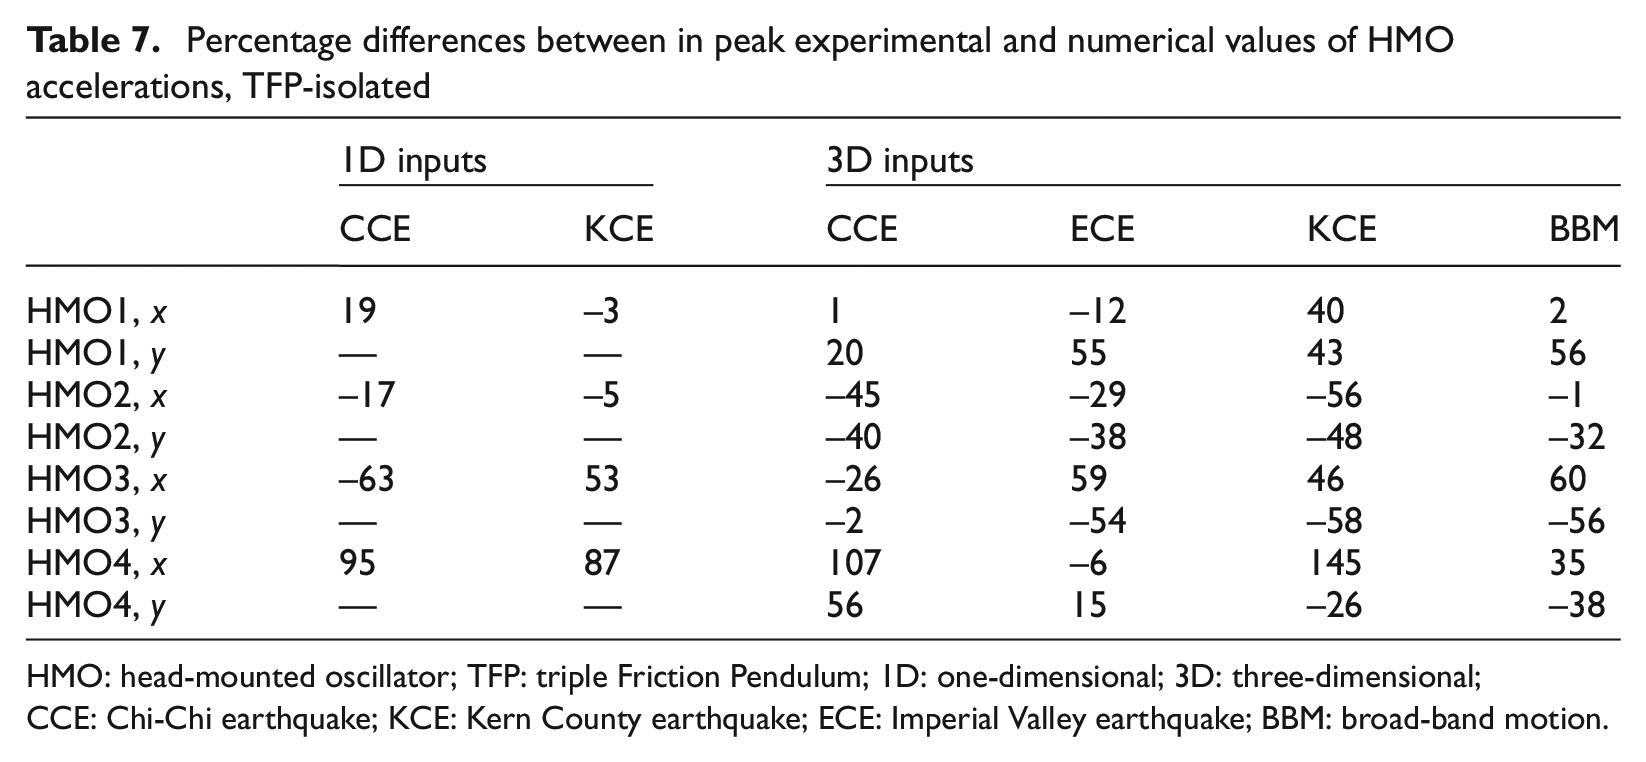
HMO: head-mounted oscillator; TFP: triple Friction Pendulum; 1D: one-dimensional; 3D: three-dimensional; CCE: Chi-Chi earthquake; KCE: Kern County earthquake; ECE: Imperial Valley earthquake; BBM: broad-band motion.
The experimentally measured HMO displacement responses were extracted from the string potentiometers attached to the free ends of the HMOs and the head of the vessel: HMO displacements were calculated with respect to the head of the vessel. A similar approach was used for the numerical analyses. Figure 25 presents the measured and predicted displacement responses of the four HMOs in the three test configurations for the 1D KCE input. The plots for HMO1, presented in Figure 25a, show that damping is not captured accurately by the numerical model across the time series. This points to the non-linear nature of damping in these HMOs. The displacements of the stiff HMOs, namely, HMO2 through HMO4, were smaller than the displacements of HMO1, and were tiny (< 2.5 mm) in most of the tests. 2 The average absolute differences in the peak numerical and experimental displacements of HMO1 are 15%, 36%, and 25% in the fixed-base, SFP-isolated, and TFP-isolated configurations, respectively, and the maximum absolute differences in the three configurations are 29%, 152%, and 48%. The differences are greater for the base-isolated configurations because the additional rocking responses were not accurately characterized. The percentage differences in the numerical and experimental displacements for HMOs 2 through 4 are not presented because the displacements were tiny in most cases (see footnote 2), and percentage differences would be misleading. The strain responses of the HMOs were measured in the experiments and reported previously (see Figure 17) but were not evaluated numerically because results could not be extended to prototype equipment.
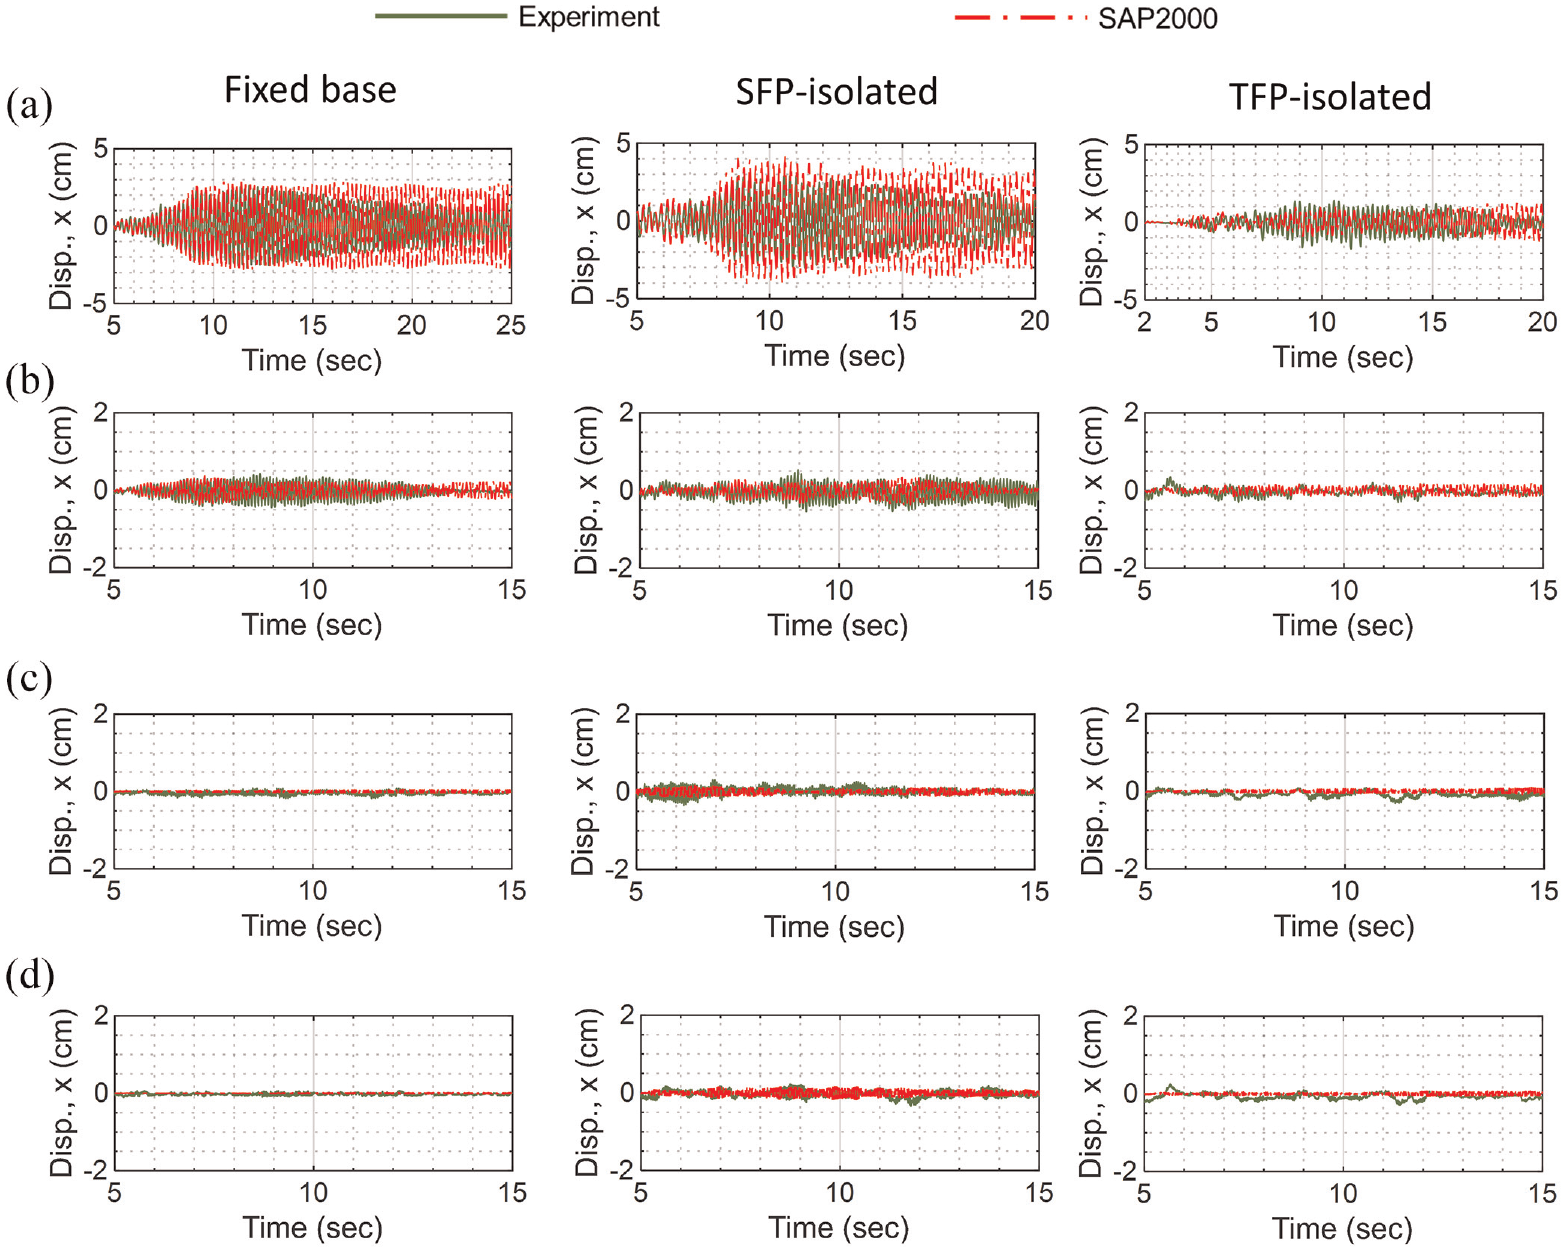
Numerical and experimental displacement responses of HMOs, three test configurations, 1D KCE input: (a) HMO1, (b) HMO2, (c) HMO3, and (d) HMO4.
Effect of damping ratio on equipment responses
The numerical simulations presented in the section “SAP2000 model and numerical results” utilized damping ratios for the equipment measured in the “Identification tests” section. These damping ratios are very small, but this is expected for bare aluminum tubes. Figure 26 enables a comparison of HMO responses in the fixed-base and SFP-isolated configurations, computed using different values of damping. The damping assigned to the vertical and rocking modes in the SAP2000 model was not changed. Data for the acceleration responses of all HMOs and the displacement response of HMO1 are presented for the 1D KCE motion in the two configurations. (The displacement responses in HMOs 2, 3, and 4 were very small, regardless of the assigned damping ratio, and so are not presented.) Significantly different peak responses are obtained for the different values of damping assigned to the HMOs. As an example, the peak acceleration of HMO2 in the fixed-base configuration, computed using the experimentally identified damping ratio, is 4.7 times the value determined using a damping ratio of 5%. (The outcomes are similar for the SFP-isolated case.) Such a difference for safety-related equipment could substantially affect design, risk calculations, seismic qualification, and importantly, equipment cost. The differences in the numerical responses associated with choice of damping ratio highlight the importance of establishing the dynamic properties of head mounted equipment.
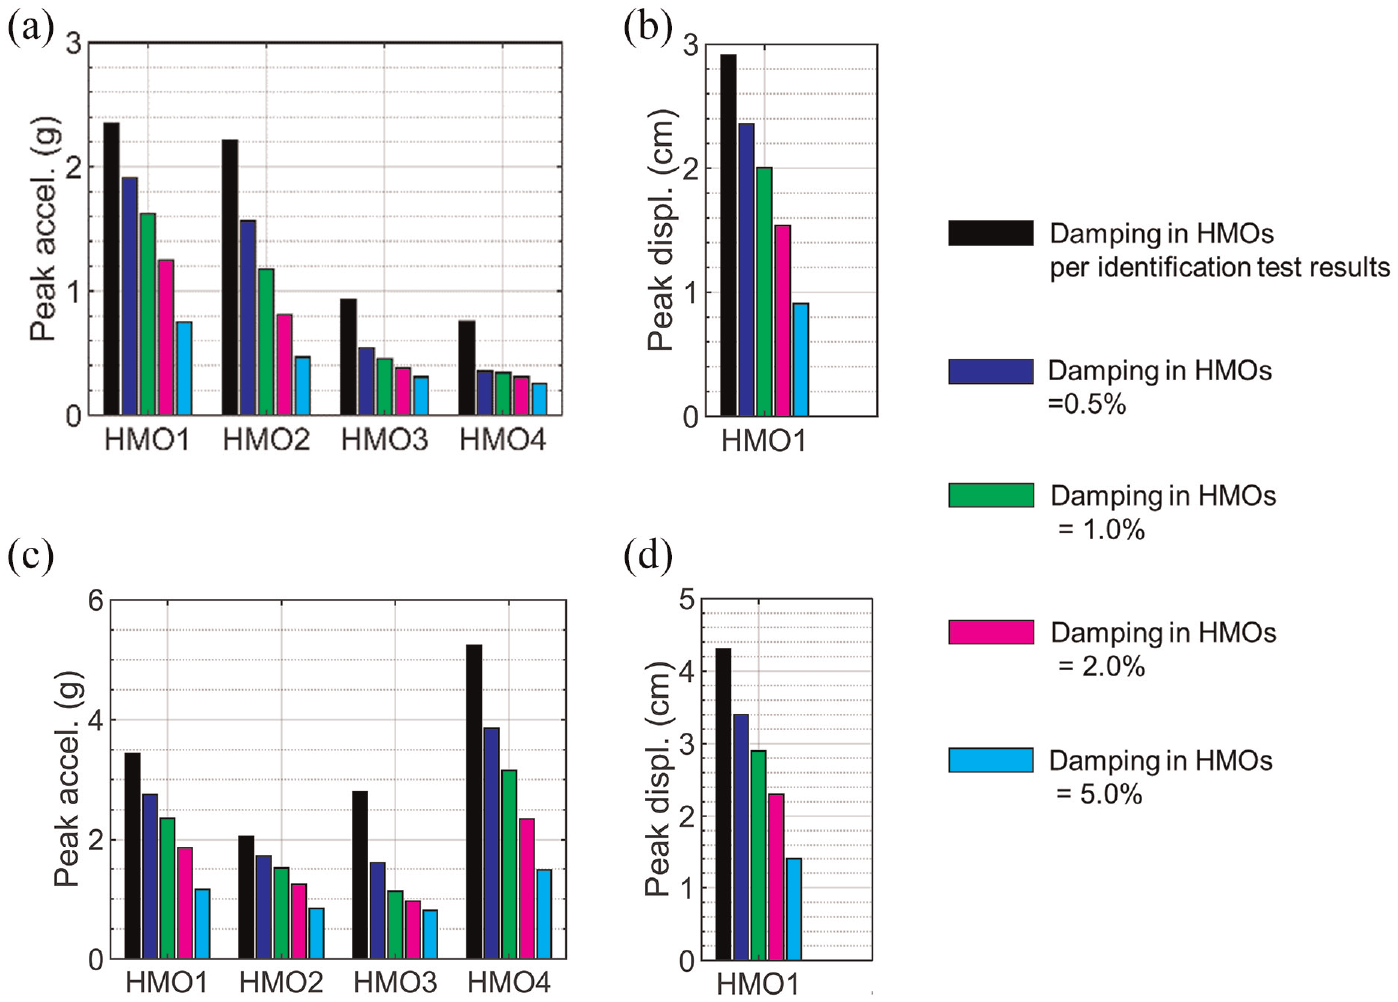
Effect of damping on peak HMO responses, 1D KCE input: (a) acceleration, fixed-base; (b) displacement, fixed-base; (c) acceleration, SFP-isolated; and (d) displacement, SFP-isolated.
Observations
The accuracy of the numerical prediction of responses of the equipment and the isolation systems varied. The isolation-system responses were predicted accurately, except for vertical and rocking accelerations because the axial stiffness of the bearings, assumed to be constant in the numerical simulations, varied significantly as a function of the changing normal load. Because the axial stiffness of a prototype friction pendulum bearing is expected to be high and essentially independent of varying normal load, vertical and rocking accelerations responses of a prototype isolation system should be predicted well. Further improvements in response predictions may be realized if axial stiffness can be modeled as load (or pressure) dependent.
Responses of the HMOs, including frequency, peak acceleration, and peak displacement, were predicted reasonably well. The near-zero damping in the HMOs and the assumed constant values of rotational stiffness connecting them to the reactor head challenged accurate predictions of response. Like the HMOs tested here, prototype equipment is likely to have a semi-rigid connection to the vessel head to accommodate thermal stresses. The outcomes of the numerical simulations presented here make clear that the force–deformation (or moment-rotation) relationships, likely nonlinear, of these connections must be appropriately characterized to enable accurate predictions of acceleration and displacement response. Rocking motion at the reactor head, if present (e.g. due to either flexibility of the support systems or rotational components of ground motion), might significantly affect equipment responses and should be modeled explicitly.
Closing remarks
Many advanced reactors have safety- and control-related equipment mounted atop the head of the vessel. The calculation of the dynamic responses of such equipment is important for seismic design and subsequent risk assessment. A set of experiments was executed on a scaled model of a reactor vessel to investigate the behavior of reactor-head-mounted equipment for a wide range of seismic inputs. Four pieces of head-mounted equipment with frequencies of 4.5, 11.8, 19.9, and 27 Hz at the model scale were installed atop the head of a cylindrical water-filled vessel and the vessel was subjected to intense three-directional seismic inputs. The vessel was tested in three configurations: conventionally supported (or fixed-base) and two base-isolated configurations utilizing two types of spherical sliding (friction pendulum) bearings. The measured dynamic responses of the equipment were used to (1) demonstrate the effectiveness of seismic isolation in mitigating seismic responses, and (2) to evaluate numerical approaches for estimating different response quantities in the base-isolated vessels. The key conclusions of the study are:
The tested equipment (HMOs) was very lightly damped and likely not indicative of equipment installed on reactor heads. The companion experimental and numerical studies identify the nonlinear nature of damping in these oscillators, associated with the use of bolted, baseplate connections. The effect of connection flexibility on the frequency of the HMOs was significant. The frequency and damping of equipment mounted on the head of a nuclear reactor vessel may be deformation dependent and should be confirmed by physical testing.
Seismic isolation is effective in reducing the peak dynamic responses of the equipment (i.e., strains, accelerations, and displacements). The reductions are greater for the more intense seismic inputs. In general, the reductions for the TFP-isolated configuration with a sliding period of 1.96 s were greater than for the SFP-isolated configuration with a sliding period of 1.38 s, which is an expected outcome.
The accuracy of the numerically predicted responses varied widely. Isolation-system responses (i.e. responses immediately above the isolators) were accurately predicted, except for rocking accelerations. The accuracy of the predicted HMO responses was poorer in general. More accurate predictions of equipment responses are anticipated at the prototype scale, assuming that values of equipment stiffness and damping, including connection flexibility, are accurately characterized by physical testing.
Rocking inputs to reactor-head-mounted equipment may significantly affect peak translational responses and should be considered for analysis and design.
Footnotes
Acknowledgements
Kairos Power contributed the head-mounted equipment and the head of the vessel used in the experiments. The views and opinions of the authors expressed herein do not necessarily state or reflect those of the United States Government or any agency thereof, or Kairos Power. Earthquake Protections Systems (EPS) contributed the seismic isolators at no cost to the project. Computers and Structures Inc. (CSI) provided a SAP2000 license to remotely support the numerical analyses presented in this article. The authors thank EPS and CSI, and the technical staff in the Structural Engineering and Earthquake Simulation Laboratory at the University at Buffalo for their assistance in fabricating and instrumenting the test article and executing the experiments. The authors gratefully acknowledge Mr Harlan Bowers of X-energy, Mr Farshid Shahrokhi of Framatome, Mr Tod Baker of Westinghouse Electric Company, and Michael Arcaro of GE Hitachi Nuclear Energy for providing the images presented in Figure 1a, b, d and ![]() , respectively.
, respectively.
Funding
The author(s) disclosed receipt of the following financial support for the research, authorship, and/or publication of this article: The information, data, or work presented herein were funded by the Advanced Research Projects Agency-Energy (ARPA-E), US Department of Energy, under Award Number DE-AR0000978.
Declaration of conflicting interests
The author(s) declared no potential conflicts of interest with respect to the research, authorship, and/or publication of this article.
Data availability statement
The experimental data supporting the findings of this study are available on DesignSafe (see Mir and Whittaker, 2022b). Supporting codes and finite element models are available from the corresponding author upon reasonable request.