
Abstract
In the present paper, an approach for measuring the micrometre scale residual stress around the fusion boundary in dissimilar steel welded joints was introduced. An as welded joint and a post-weld heat treated joint were examined using a nanoindenter system. The results revealed that a compressive residual stress existed around the fusion boundary in a range 200 μm extending to the overheated heat affected zone (HAZ) and 300 μm to the weld metal, and the compressive stresses were reduced after post-weld heat treatment. The maximum compressive stress occurred in the fusion boundary and then dramatically decreased in the adjacent HAZ base metal and weld metal. In comparison with the regular approaches for macrometre scale measurement, the nanoindentation has the advantages of high resolution and precision for effectively evaluating the residual stresses in a narrow region. The measuring error was analysed.
Introduction
It is well known that the existence of residual strain–stress plays a key role in failure and service life of structural materials. In general, the residual strain–stress in materials mainly arises from non-uniform plastic deformation during mechanical processing, dimension tolerance in assembly and local thermoplastic deformation due to the non-homogeneous temperature field, such as residual stress induced from welding or heat treatment. The measurement of residual strain–stress is of importance for assessing the local deformation in materials and afterward predicting the service life. It is also helpful to find out the magnitude and distribution of the residual strain–stress in materials, in which variant approaches can then be applied to control and reduce or even diminish the residual strain–stress in order to improve the bearing capacity, prolong service life and avoid the premature failure of structural materials.
Many measurements have been used to evaluate the residual strain–stress. Conventionally, it can be divided into two groups: destructive or semidestructive (mechanical stress relaxation) methods and non-destructive (physical parameter analysis) methods. The former mainly includes hole drilling, saw cutting, layer by layer sectioning techniques, etc., and the latter includes X-ray diffraction, ultrasonic wave, magnetic Barkhausen noise, neutron diffraction, etc. These techniques have been widely applied in industrial and reported in the literature.1–4 From a measurement scale viewpoint, the resolutions of the above techniques belong to the millimetre scale and are suitable to evaluate the macroresidual strain–stress.
In recent years, the measurement of the residual strain–stress in the range of below 100 μm or even several micrometres becomes crucially necessary due to the deep researches on fracture behaviours and failure mechanisms of materials, and the rapid developments on thin film, microelectronics, electronic packing, integrated circuit chip, microelectromechanical system, etc. For example, the local residual strain–stress in alloys exhibit a key role on cracking initiation and propagation, which eventually result in the failure of the mechanical workpiece; in addition, the existence of thermal stress and lattice mismatched strain–stress in an epitaxially grown semiconductor device will lead to the nucleation of unwanted lattice defects or band gap variation and therefore, reduce the light emission efficiency and reliability of the device.
Up to now, there are several kinds of approaches for measuring the micrometre scale residual strain–stress, i.e. nanoindentation,5–7 focused iron beam based method,8–10 micro-Raman spectroscopy,11,12 electron backscatter diffraction13,14 and X-ray diffraction.15 The nanoindentation measures the micrometre scale residual strain–stress distribution from the variation in hardness and the corresponding contact area. It has advantages, such as convenience, non-destructivity and large measuring range from nano- to microscale and to macroscale. A great deal of research has been undertaken for studying the residual strains–stresses at grain boundaries, around weld interfaces and in coatings, thin films, gradient materials, heterogeneous materials, etc.16–21
As a widely applied hot working technology, welding causes the most complicated residual stress in a narrow range, especially in a dissimilar steel welded joint, which is one of the main reasons that many failures happened in the welded zone during service. For a dissimilar steel welded joint between ferritic and austenitic steels, the residual strain–stress state exhibits the following characters:
a large thermal stress is induced at the weld interface due to the difference in thermal expansion coefficient between ferritic (13·5×10−6–14·5×10−6 K) and austenitic (16×10−6–18·5×10−6 K) steels. Therefore, a Ni based alloy is used as a transition layer to reduce the stress concentration because the thermal expansion coefficient of Ni based alloy is in between ferritic and austenitic steels22,23
during the post-weld heat treatment (PWHT) or service at evaluated temperature, due to carbon migration from ferritic steel to austenitic steel, a decarburised layer with a good ability of plastic deformation as well as a recarburised layer with poor ability of plastic deformation will form in the joints. Consequently, during cooling, the constraint stress can be relaxed in the decarburised layer; however, the constraint stress again concentrates in the recarburised layer. That is to say, PWHT cannot completely eliminate the residual stress but only redistributes it
the residual strain–tress in a joint can also be generated from other factors, such as internal pressure in a pipe, external bending stress, alternative loading, structural geometry and so on.
There are some different viewpoints on the residual strain–stress state in the dissimilar steel welded joints. Most researches considered that tensile stresses were prevalent in the weld metal and fusion boundary, while compressive stresses formed in the heat affected zone (HAZ) base metal, which then changed to tensile stresses in the range far from the weld interface to maintain the equilibrium with the weld metal.24,25 Schimmoeler and Ruge's experimental measurements indicated that the tensile stresses developed in both the weld metal and HAZ base metal, which dropped in the fusion boundary to values of about zero based upon X-ray diffraction; however, after PWHT, the residual stress in HAZ transformed into compressive stress.26 Sarafianos established a mathematical model to calculate the residual stresses at the weld interface between ferritic and austenitic steels according to the lattice misfit between body centre cubic (bcc) and face centre cubic (fcc). It was found that the residual stresses change from tensile in the ferritic base metal (bcc) to compressive in the austenitic weld metal (fcc) across the fusion boundary, and the experimental X-ray diffraction residual stress measurements were performed by cutting the specimens normal to the welding direction and established macro- and microstress profiles extending up to 22 mm and 55 μm respectively.27 Obviously, most of the above research results were based upon millimetre scale approaches and obtained the macroresidual strain–stress. The actual residual strain–stress distribution around the narrow region of weld interface or fusion boundary has little been reported.
In the present paper, the micrometre scale residual stresses around the fusion boundary of dissimilar steel welded joints were measured using a nanoindentation system. Both the as welded and PWHT dissimilar joints were investigated in order to better understand the relationship between the variation in microstructures and the residual stresses around the fusion boundary. It is expected to provide more precise data for studying the failure mechanism happening in the fusion boundary.
Micrometre scale stresses measurement based on nanoindentation technique
The nanoindentation technique (or depth sensing indentation), which has been rapidly developed in the past two decades, is a powerful tool for exploring mechanical properties. It provides the data, such as microhardness, elastic modulus, fracture toughness, creep stress exponent, etc., by analysing the load–displacement P−h curve with very sharp indenter tip and small load in order to get indentations in several micrometres and even several hundred nanometres scale. The continuous stiffness measurement process provides a possibility to continuously measure the mechanical properties of materials in one sample experiment without the need for discrete unloading cycles, which is ideal for detecting the difference in properties between external and interior of materials.
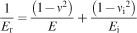
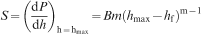
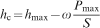
Figure 1 shows a typical indentation P−h curve. hmax is the max displacement at the peak load Pmax, hc is the contact depth, S is the initial unloading contact stiffness and hf is the final displacement after complete unloading. According to the Olive–Pharr model,28 there exists the following equation

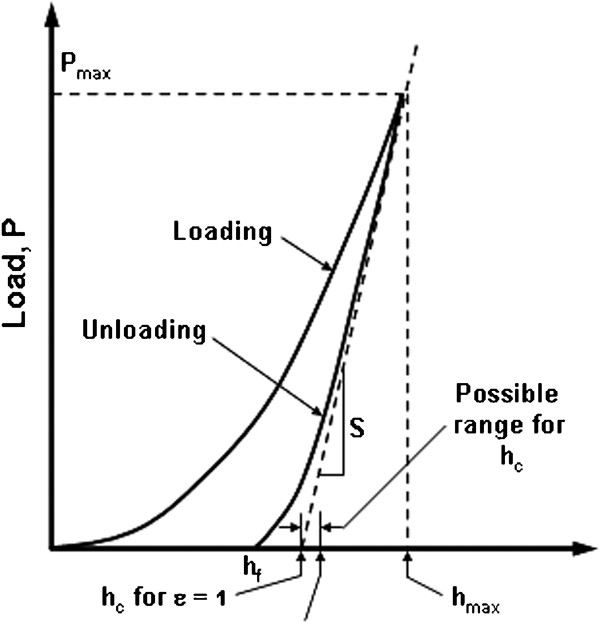
Typical load–displacement indentation curve
From the P−h curve, the hardness can be obtained at the peak load as


The measurement of residual stress using nanoindentation is mainly based upon two effects.29,30
the effect of residual stress upon the indentation deformation. That is, a compressive stress intends to result in a ‘pile-up’ (Fig. 2a) at the edge of an indentation, while a tensile stress to a ‘sink-in’ (Fig. 2c)
the effect of residual stress upon the P−h curve. As shown in Fig. 3, when the indenter reaches to the similar maximum indentation depth, the applied load at an area with a compressive stress state Pc is higher than that at a stress free state Po. This is ascribed as that the compressive stress induced a backward force to the applied load, as shown in Fig. 2a. Therefore, the actual applied load Pc can be described as follows

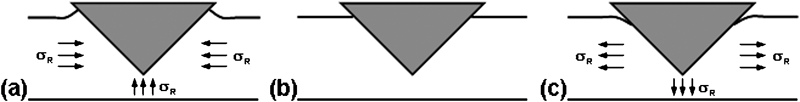
Theoretical surface morphologies around contact for a compressive stress, b stress free and c tensile stress
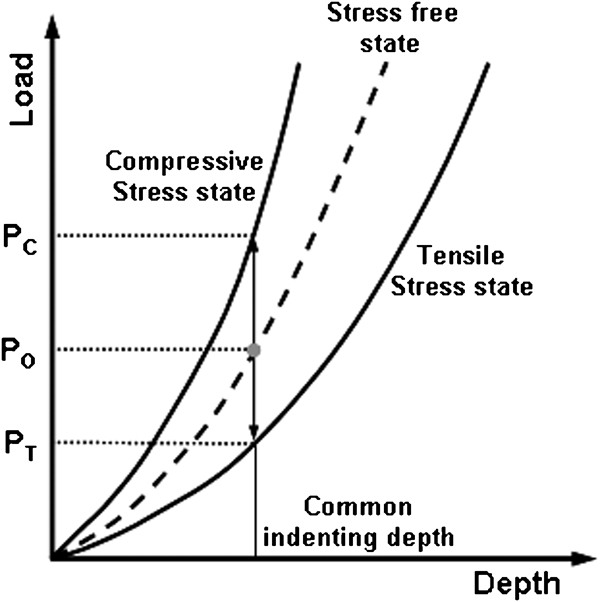
Variation in indentation curves with changes in stress state
Similarly, for a tensile stress, there is the equation


Furthermore, Lee and colleagues validated their model towards a general biaxial residual stress state by inserting a stress ratio κ, relating with the directionality and magnitude of residual stress, into the previous equation (i.e. equation (11)),32 that is
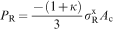
 to the major in-plane residual stress component
  , i.e.
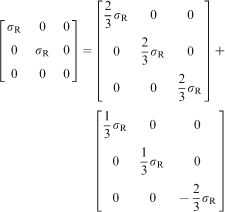
  . When a stress state approaches to the equibiaxial state or κ = 1·0, equation (12) converges to equation (11). Generally, obtaining stress ratio accurately is a complex procedure, which should further analyse the stress induced pile-up shifts combined with a scanning probe microscope (SPM) technique.32 Since the purpose of the present work was to develop an easy and feasible method estimating the micrometre scale residual stress by nanoindentation, so the residual stress in dissimilar steels welded joints was approximately considered as an equibiaxial state.
In the present work, there are large differences in microstructures, chemical compositions and mechanical properties in the character zones of the dissimilar steel welded joints. Therefore, the indentation induced deformations from base to weld metal crossing to the fusion boundary during a loading–unloading cycle are also quite different and result in variant P−h curves. That is to say, the ideal Po−ho curve in a stress free region should be respectively established for each character zone as an indentation reference to analyse the nanoindentation testing results influenced by the residual stress.
Generally, a welded joint can be divided into several character zones involving original base metal, HAZ, fusion boundary and weld metal. According to the thermal cycle from high to low temperature, the HAZ can be further divided into several narrow zones, such as overheated zone (area A), phase transformation and recrystallisation zone (area B) and uncompleted recrystallisation zone (area C), as shown in Fig. 4. The present work only concentrates on the residual stress variants around the fusion boundary and extend 200 μm to the overheated HAZ and 300 μm to the weld metal respectively, as shown in the dashed rectangle in Fig. 4.
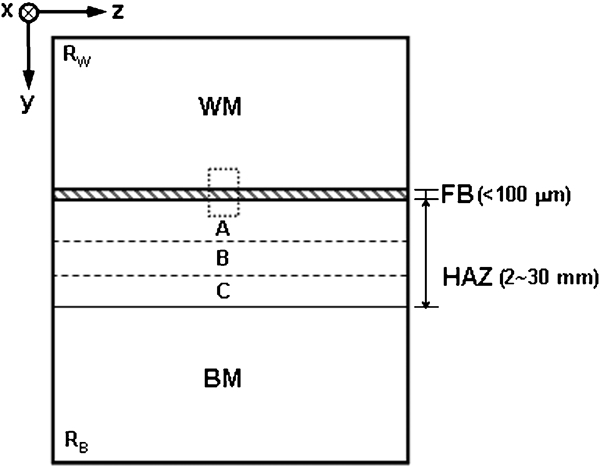
Schematic illustration of dissimilar steel overlay welded joint: x longitudinal, y transverse and z through thickness
The role for determining the indentation reference Po−ho for each zone is described as follows:
the original base metal (point RB in Fig. 4) is chosen as a reference point for HAZ due to its similar microstructures with ferrite
the edge of the cladding layer (point RW) is chosen as the reference point for the weld metal, where the residual stress has been released
it is difficult to choose the reference point for the fusion boundary due to its completed microstructure and chemical compositions consisting of martensite, bainite and carbide.33
Here, the base metal (point RB) was also chosen as its approximate reference according to its basic ferrite matrix as the base metal.
Experimental
In the present work, a dissimilar strip overlay joint was prepared using a strip submerged arc cladding process. The base metal is 2·25Cr–1Mo low alloyed steel, and the strip electrode is Cr24–Ni13L austenitic stainless steel (Sandvik 24·13.L; Sandvik Materials Technology, Stockholm, Sweden). Welding parameters were as follows: current, 750 As; voltage, 28 V; speed, 12 cm min−1; flux, 10 s; and working temperature, 120–170°C. Strip dimension was 60×0·5 mm. The PWHT procedure was: annealing at 690°C for 36 h and then cooling to 400°C, and finally air cooling to ambient temperature. The heating and cooling rates were fixed at 40°C h−1. The chemical compositions of the base metal and strip electrodes are given in Table 1.
Chemical compositions of materials, wt-%
The metallographic cross-section samples were cut perpendicularly to the welding direction and then mechanically polished. The samples were etched as follows. First, the structure of the weld metal was electroetched using a solution of 10% oxalic acid and 90% water at 6 V for 45–60 s. Then, the structure of the base metal and the fusion boundary were etched using a solution of 1 g FeCl3, 5 mL HCl and 50 mL alcohol. The metallographic micrographs were observed using an Olympus BX51 optical microscope (Olympus Co., Ltd, Tokyo, Japan), and Sirion FEI scanning electron microscope (FEI, Portland, OR, USA), equipped with an EDAX Genesis energy dispersive X-ray spectrometer operated at 25 kV.
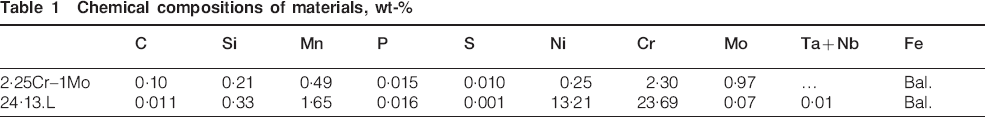
In order to eliminate the error of the nanoindentation data from surface roughness during metallographic etching, the sample surface was only slightly polished for the nanoindentation measurement. The nanoindentation testing was carried out on an Agilent G200 Nanoindenter (Agilent Technologies, Santa Clara, CA, USA). The continuous stiffness measurement standard hardness and modulus test program were used, in which the harmonic depth and frequency were 2 nm and 45 Hz respectively. The maximum indentated depth was 2000 nm. For each sample, 50 points (10×5 arrays) were tested around the fusion boundary, as shown in Fig. 5. In each transverse array, four points for the HAZ, one point for the fusion boundary and five points for the weld metal. The value of the residual stress was averaged from the residual stresses of the five equivalent points in the perpendicular array. The spacing between two adjacent points was 60 μm, which should be as 20–30 times as the maximums indentation depth avoiding indentation size effect. After testing, the indentation morphologies were observed using a Shimadzu SPM-9500J3 SPM (Shimadzu Corp., Kyoto, Japan).
a optical microscopy morphology of as welded joint around fusion boundary, b element distribution of Fe, Ni and Cr across fusion boundary respectively and c corresponding indentation matrix around fusion boundary
Results and discussion
Residual stresses in as welded joint
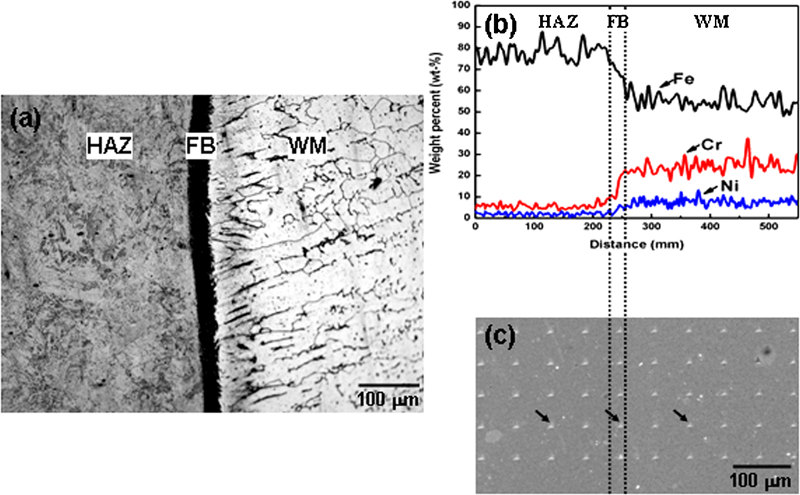
Figure 6 shows the indentation images in the HAZ, fusion boundary and weld metal of the as welded joint, corresponding to the black arrows in Fig. 5c. It was noted that the average length of the indentation edge was 12–14 μm, and the ‘pile-up’ was formed at the edge. However, the extent of the ‘pile-up’ or deformation varied according to different zones, i.e. the degree of deformation in the HAZ and fusion boundary were larger than that in the weld metal.
Scanning probe microscope images of indentations for a HAZ base metal, b fusion boundary and c weld metal respectively
Figure 7 illustrates the typical P−h curves in variant zones. Compared with the stress free Po−ho curves, all the P−h curves are located above the corresponding Po−ho curves; that is to say, the residual stresses in the welding zone were entirely compressive. The magnitude and distribution of compressive stresses along the transverse direction around the fusion boundary are given in Fig. 8. The maximum stresses occurred in the fusion boundary and then decreased dramatically on both sides. However, in total, the compressive residual stress in the HAZ was slightly higher than that in the weld metal.
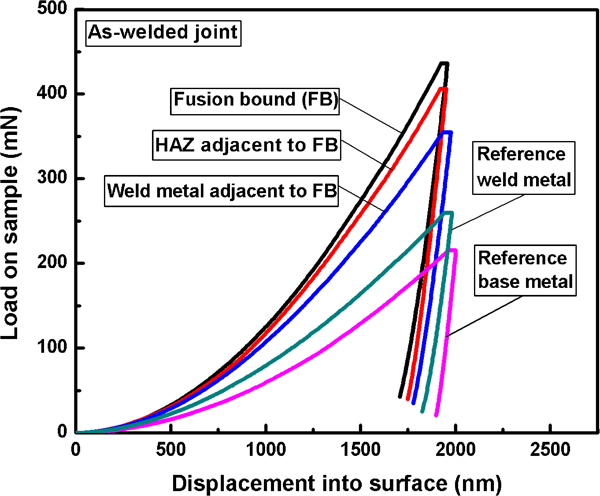
Typical load–displacement indentation curve and corresponding ideal curve for each microstructure in as welded joint according to residual stresses
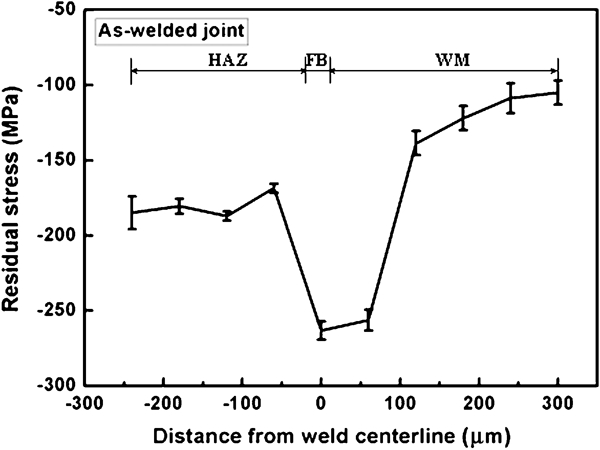
Distribution of residual stresses along transverse direction in as welded joint
Generally, in the dissimilar steel welded joints, tensile stresses were prevalent in the weld metal because the contraction was resisted during the cooling, while compressive stresses developed in the HAZ base metal associated with crystal lattice expansion induced by phase transformation at low temperature. 24 24,25 However, there were also some inconsistent results on the residual stress in joints measured by the millimetre scale technique26 or X-ray diffraction combined with layer by layer sectioning method.27 This is ascribed to the fact that the measuring accuracy and scale were above hundreds of micrometres or even millimetres, which cannot reflect the complicated changes in residual stress around the narrow fusion boundary and its adjacent micrometre scale regions. In the present experiment, with the high resolution nanoindentation approach, the residual strain–stress state and distribution in micrometre scale around the fusion boundary can be precisely measured.
It is well known that the welding residual stress is induced after welding and during cooling and related to the welding thermal cycle. For the portion of the solid state base metal, including HAZ, the residual strain–stress is formed due to the temperature gradient departing from welding heat source. Figure 9 illustrates a schematic diagram showing the volume change in HAZ during a welding thermal cycle.34 Clearly, the volume increase comes from two reasons, that is, the thermal expansion of the ferrite phase base metal during heating and the fcc austenitic (γ) to bcc ferrite (α) solid phase transformation during cooling. Therefore, the HAZ beside the fusion boundary is in a compressive stress state due to the thermal expansion. It has been reported that the compressive stresses could reach values approaching the yield strength of the 2·25Cr1Mo at ambient temperature (−590 MPa) after the phase transformation was complete.35 However, in the results of the present study, the compressive stresses in the HAZ were only about −181 MPa, which was much lower than the anticipated value, which indicated that most compressive stresses in HAZ beside the weld interface has been transferred or relaxed. This is because, at this period, the weld metal beside the interface was in a melting soft state, and the compressive stresses in the HAZ were prone to flow into the weld metal. An obvious drop in HAZ at the location of 30 μm beside the weld interface, as shown in Fig. 8, reveals the stress transfer and complexity.
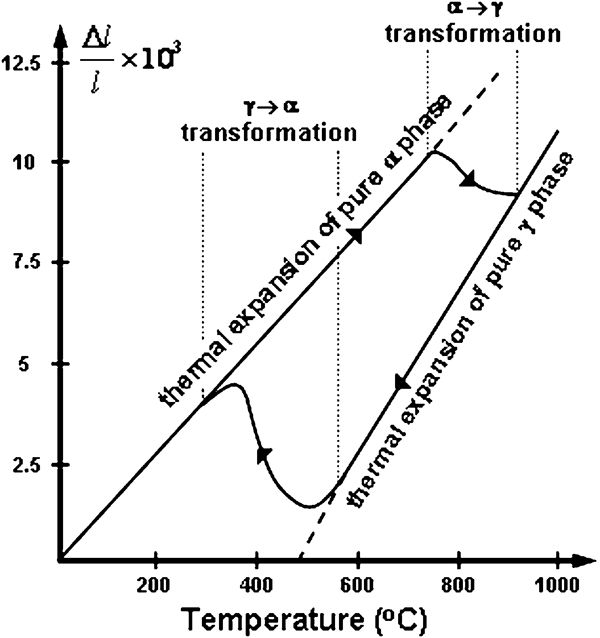
Dilatometric diagram of ferritic steel in thermal cycle
In addition, for the portions of the fusion boundary and weld metal, there are several distinct opinions on the residual strain–stress states. Most research indicated that the residual stress in these zones belonged to tensile,
24
24,25 whereas the compressive stresses were determined by the calculation method according to the bcc–fcc lattice misfit between the ferritic and austenitic steels at the weld interface.35 In fact, the fusion boundary and weld metal experienced a solidification process, and the residual stresses mainly arise from the contraction during cooling and interaction with the adjacent HAZ. The solidification structures had a high extent of contraction, which may induce a yield magnitude residual stress. Yield magnitude residual stress occurs if the thermal strain during cooling after welding is greater than the yield strain, that is

Contraction strain and yield strain in materials (To = 20°C)

The results suggested that yield magnitude residual stresses occurred in the weld metal, where the thermal strain was more than the yield strain during cooling. Consequently, the tensile stresses were generated due to the high restraint, and the maximum value of the tensile stress could be equal to the value of the yield strength, which was −220 MPa. The fusion boundary and weld metal also experienced a yield process, and they additionally suffered the compressive stresses (about −400 MPa) transferred from the adjacent HAZ. During cooling, these compressive stresses exerted the solidification microstructures in the shrinking direction, which could reduce the restraint to the free contraction of the solidification structures. That is to say, the tensile stresses in the fusion boundary and weld metal at the interface were lower than that in the weld centreline.
As a consequence, the higher compressive stresses compensated the lower tensile stresses, and redundant compressive stresses resided in the fusion boundary and weld metal at the interface. Besides that, the compressive stress in the fusion boundary was higher than that in weld metal beside the interface, which was associated with the change in microstructure phase from the fusion boundary to the weld metal. For the weld metal, it solidified in δ phase, which then transformed to γ phase, and these two processes resulted in volume shrinkage and increasing tensile stress and decreasing final compress stress. In Fig. 8, it can be seen that the compressive stresses are of a higher intensity in the fusion boundary as well as in the nearest weld metal at a distance of ∼50 μm and then decreased to a half intensity in the weld metal with increased distance from the fusion boundary. This variation is consistent with the micrometre scale calculation result in Sarafianos's study.27 Furthermore, the measurement results (Fig. 10) showed that the tensile stresses began to appear at the distance of 2 mm from the fusion boundary, and the tensile stresses were maintained in the macrometre scale scope in the weld metal, which was also in agreement with the conventional viewpoint. 24 24,25
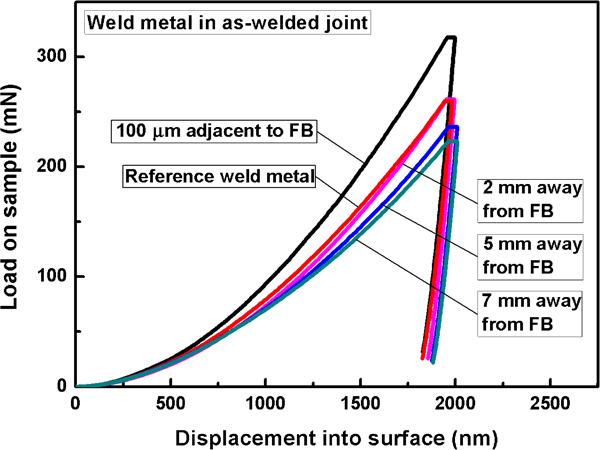
Shape changes in indentation curves in weld metal according to residual stresses
Residual stresses in PWHT joint
In general, the residual stresses in a welded joint will be redistributed after PWHT or service at evaluated temperature.37 Figures 11 and 12 exhibit that the residual stresses around the fusion boundary were still in the compressive state; however, the magnitudes have been dramatically reduced. That is,
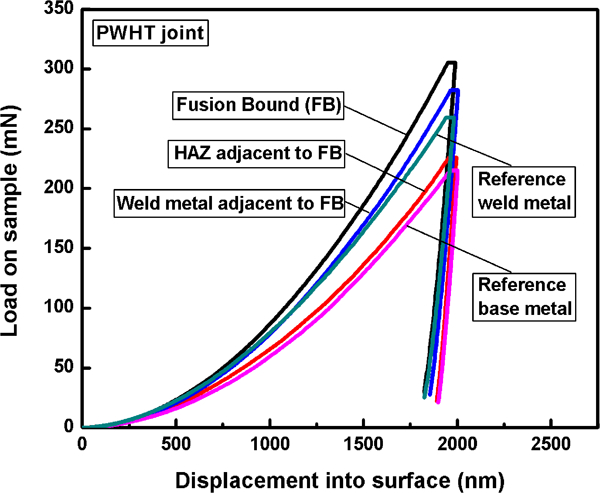
Typical load–displacement indentation curve and corresponding ideal curve for each microstructure in PWHT joint according to residual stresses
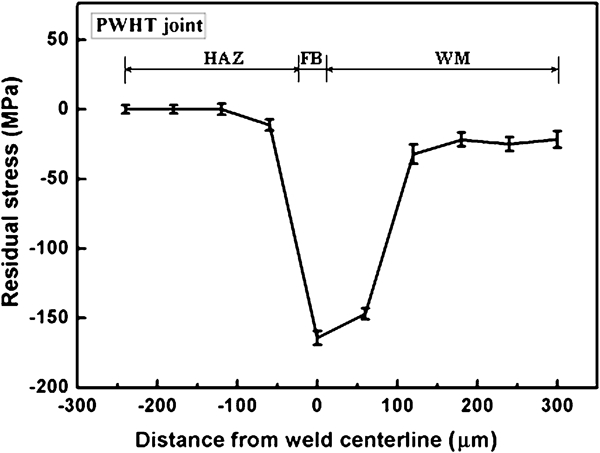
Distribution of residual stresses along transverse direction in PWHT joint
the maximum compressive stress in the fusion boundary reduced to approximately −164 MPa, which was 44% lower than that in the as welded joint
the stresses in the HAZ have been quickly dropped to the value close to stress free with a reduction of 93%
the compressive stress in the weld metal decreased to about −147 MPa within a distance of 50 μm beside the fusion boundary and then decreased fast to about −21 MPa with a reduction of 78%.
The decrease in compressive stresses in the PWHT welded joint was ascribed to the thermal stress relief, which was related to the variations in microstructures at evaluated temperature. For example, during PWHT, carbon migration from ferritic to austenitic steel produced a recarburised layer in the fusion boundary. Owing to the poor ability of deformation of the recarburised layer, the residual stresses were hardly transferred and relieved during subsequent cooling, and higher compressive stresses were still observed in the fusion boundary. On both sides of the fusion boundary, the recovery and recrystallisation process tended to let the microstructures much more stable and with lower energy. Figure 13 shows the microstructures around the fusion boundary after PWHT. Clearly, the grain sizes in HAZ had grown dramatically, and the columnar grains in the weld metal almost kept unchanged. Therefore, the compressive stresses in HAZ had been sufficiently relieved to almost a stress free state after PWHT.
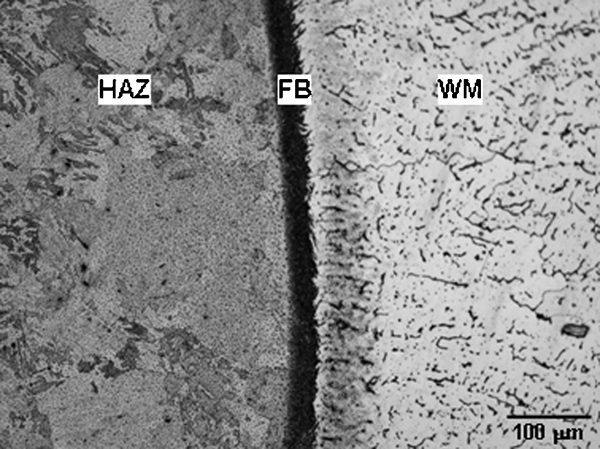
Optical microscopy morphology around fusion boundary in PWHT joint
The above results demonstrate that the nanoindentation is a powerful approach for evaluating the micrometre scale residual stresses without destructing the samples. However, other factors may also influence the results and induce the measuring errors. One is that the grain boundary and inclusions or carbides will increase the indentation values, and in the present work, the multipoint measurement was used for obtaining average data. Second is the accurate measurement of the contact area of the indentation for equation (11). In the present work, the contact areas were measured using an optical microscope and did not use the data provided by the GSM software, without considering the effect of the ‘pile-up’ and giving a higher hardness. Third is that the residual stress approximately considered as an equibiaxial state will be a little higher compared to the general biaxial state. Fortunately, these differences generated only small deviation of obtained residual stress value and not the abrupt change in the residual stress distribution in the dissimilar steels welded joints
Conclusions
The nanoindentation provides a possible and powerful approach for measuring the micrometre scale residual stresses around the fusion boundary of the dissimilar steels welded joints, which is not possible to be obtained when using a regular technique. The preliminary results indicate that:
In the as welded joint, residual stresses around the fusion boundary are entirely compressive. The maximum compressive stresses occur in the fusion boundary and then dramatically decrease on both sides in the range of several hundred micrometres.
After PWHT, the compressive stresses around the fusion boundary become relieved. The maximum compressive stress is only 44% lower in the fusion boundary when comparing with the as welded joint, and the compressive stresses in the HAZ and weld metal decrease to 93 and 78% respectively.
Footnotes
Acknowledgements
The present work was supported by the National Nature Science Foundation of China (grant no. J0830310).