
Abstract
In this part II, the comparison of physical mechanisms between tungsten inert gas (TIG) and active TIG (A-TIG) welding is shown. The plasma was monitored by a high speed camera to present the arc constriction phenomena while passing from TIG to A-TIG. The elemental analysis and the arc temperature measured by optical emission spectroscopy were performed according to the type of welding and the different fluxes in A-TIG welding. The two-dimensional axial symmetric model presented in part I was used to simulate the flow behaviour in the melting pool realised on a stainless steel disc (304L) melted by a stationary heat source and to study the influence of energy density.
Introduction
The active tungsten inert gas (A-TIG) welding process was developed in the early 1960s by the Paton Welding Institute (Kiev, Ukraine) to improve the tungsten inert gas (TIG) welding process.
In A-TIG welding, a fine layer of activating flux, constituted of inorganic powder, is deposited on the steel plate before welding. The penetration depth was multiplied by a factor of 1·5–4 while passing from the process TIG to A-TIG, depending on alloys. In this study, we considered only three mechanisms in the A-TIG welding process: the Marangoni effect combined with Lorentz forces and the arc constriction effect. The chemical mechanisms were already studied in part I.
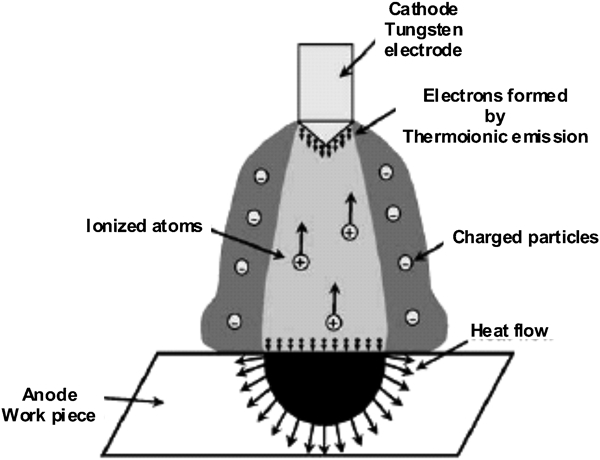
The electrical arc constriction is generated by the dissociation and ionisation of the components of the fluxes, as shown in Fig. 1. The use of fluxes such as fluorides, chlorides and oxides supports the arc constriction mechanism.1 The arc constriction can have two consequences: an energy densification on the metal and/or an increase in the arc temperature. The arc temperature depends on the first ionisation potential of the metallic element.2 The presence of oxides leads to a constriction of the plasma column and an increase in the arc temperature, which may explain the observed effects on the weld bead.3 The fluorides (once dissociated) have great affinity for electrons. Arc constriction depends on the ability of the flux to combine with electrons.
Arc constriction
In A-TIG welding with fluorides or chlorides, the Marangoni convection remains centrifugal as in TIG welding. Some fluorides do not affect the chemistry of the melting zone. Consequently, some fluorides have only one effect on the arc, i.e., increasing the arc energy density. This is due to a global or local increase in the arc temperature or in the arc temperature gradient, depending on the fluoride.4
Experimental
Flux preparation and material conditions
Before flux application and welding, the workpiece was cleaned with acetone and dried. In the present work, different fluxes were used. The first was a commercial flux composed of TiO2, Cr2O3, V2O5, MgF2 and MgCl2. The second flux contains the mixture of three oxides, such as TiO2, Cr2O3 and V2O5, and TiO2, Cr2O3, K2Cr2O7, MgF2 and BaF2 were also studied separately. A planetary crusher was used to grind 15 g of powder (oxides and halides) with 15 mL of ethanol in a stainless steel bowl for 20 min at 360 rev min−1 in order to prepare the activating flux. The flux was deposited on the steel plate before welding by pulverisation using an aerograph. The geometry of the fusion line was produced on austenitic stainless steel 304L rectangular plates (200×50×4 mm). The chemical composition of steel is 0·013C–0·53Si–1·61Mn–0·017P–0·011S–19·67Cr–0·08Mo–9·95Ni–0·005Al–0·072Co–0·11Cu–0·019Ti–0·046V (wt-%).
Welding was conducted using a Fronius Magic Wave 2200 current supply and a Servisoud automatic welding bench for dynamic experiments.
Arc plasma visualisation
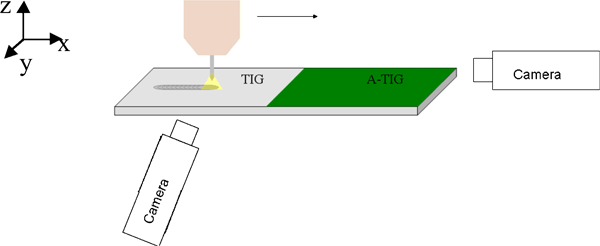
During welding, the workpiece was continuously displaced using a movable table, whereas the plasma torch was fixed. Then, all the optical observation can be performed on a fixed spatial position. The ‘shape’ of the plasma column and the arc constriction phenomena were monitored by a high speed camera FASTCAM-1024PCI HW (Photron Technology) with an interference filter of 469·2 nm central wavelength and 3 nm spectral bandwidth. Recorded signals were dominated by continuum radiation originating from free electrons. The plasma images recorded in this way can give a lot of information on the welding process since the radiation directly follows the current.5 Two different camera positions were used, as shown in Fig. 2, to get face (x direction) or side (in y direction) view of the plasma column, in order to see if the arc constriction occurs in two directions.
Experimental conditions for arc constriction identification
Investigations of plasma by optical emission spectroscopy
Optical visible emission spectroscopy was used to characterise the arc plasma and to determine the arc temperature during welding in TIG and A-TIG with commercial fluxes and MgF2.
During welding, the workpiece was continuously displaced using a movable table. The distance z0 between the contact tip and the workpiece (the metal plate) was fixed, and the investigations were accomplished using the light emitted from different layers z (origin taken on the workpiece) of the plasma.
The investigated plasma region was imaged onto the entrance slit of an Ebert type spectrograph (0·2 nm mm−1 reciprocal dispersion) by a system of flat and concave mirrors and a Dove prism. As the entrance slit of the spectrometer is vertical, the Dove prism rotated the plasma image by 90°, enabling the registration of the plasma layer at the given distance z from the electrodes. Investigations of the light emitted from different layers of the plasma column were accomplished by vertical translation of a set of two mirrors, which causes translation of the optical axis with no angle modification.
The spectra were collected at wavelengths of 405·5 and 706·8 nm over the spectral range of ∼1·6 nm using a gated two-dimensional intensified charge coupled device camera. The spectral resolution of the optical system varied from 0·0044 to 0·0026 nm per pixel, while the spatial resolution was 50 μm vertically (along the axis of the plasma column) and 45 μm horizontally.
Experimental and numerical results
Arc constriction phenomena
To determine the influence of oxides and halides on the arc constriction, a commercial flux constituted of TiO2, Cr2O3, V2O5, MgF2 and MgCl2 was used as well as the mixture of oxides TiO2, V2O5 and MgF2. Different oxides such as TiO2, Cr2O3 and K2Cr2O7 were chosen to study their influence on the physics of the arc. MgF2 and BaF2 were also studied separately.
The arc shapes (face view) monitored during TIG and A-TIG welding for each flux are reported in Fig. 3. We can observe that the arc constriction phenomenon has occurred while passing from TIG to A-TIG for each flux. However, fluxes act differently on the physics of the arc. Oxides or fluorides used separately have an important influence on the arc compared with the two fluxes composed of the mixture of oxides and halides.
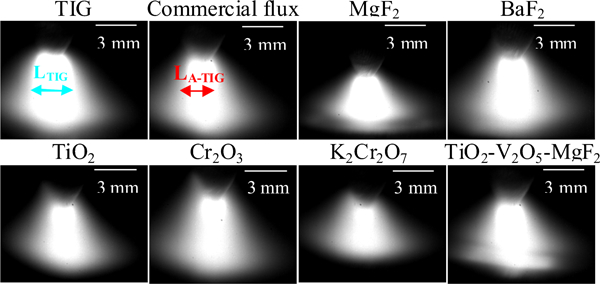
Arc shapes monitored during TIG and A-TIG welding for different fluxes (face view)
The arc constriction phenomenon is different according to the type of oxide or fluoride. When comparing the arc shape during A-TIG welding with the two fluorides, magnesium fluoride decreases the arc length, increasing the penetration depth of the weld beads.
We can see this decrease in the arc length added to the arc constriction for TiO2 and K2Cr2O7. However, the fluxes constituted of Cr2O3 also have an important constriction effect. The results obtained for K2Cr2O7 contradict with the geometry of the weld beads realised in A-TIG with this same flux. Indeed, K2Cr2O7 is not present in commercial fluxes because its activating effect is poor.
The arc shapes (side view) monitored during TIG and A-TIG welding for each flux are reported in Fig. 4. The arc constriction is less important in this case. These observations show that the arc constriction acts only perpendicularly to welding direction. However, the width of the arc is narrower in A-TIG welding, and the decrease in the arc is still present for MgF2 and K2Cr2O7 but also for BaF2.
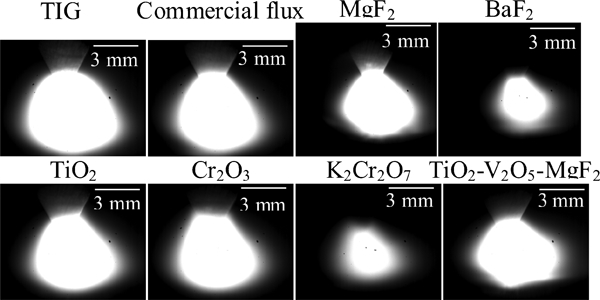
Arc shapes monitored during TIG and A-TIG welding for different fluxes (side view)
To quantify the arc constriction, the ratio between arc width while passing from TIG to A-TIG was calculated for each flux and reported in Fig. 5. The maximum width of the electrical arc in TIG and A-TIG welding was determined by measuring the white region of the photo, and the formula used for the ratio is LATIG/LTIG (Fig. 3). The arc constrictions while passing from TIG to A-TIG for commercial flux and the flux constituted of TiO2–V2O5–MgF2 are respectively 45 and 40%. The percentage of arc constriction during A-TIG welding with titanium oxide or chromium oxide is more important than a mixture of oxides and halides (55% for TiO2 and Cr2O3). We obtain 56% arc constriction with K2Cr2O7, but this percentage does not represent really in totality but also the difficulty of the arc to be established with this flux.
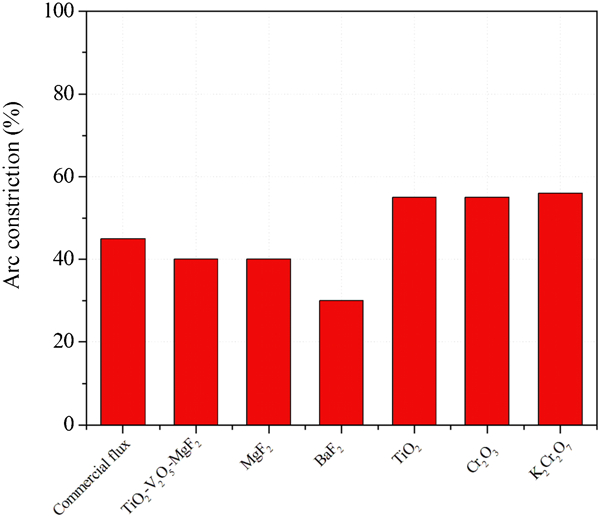
Arc constriction while passing from TIG to A-TIG welding process for different fluxes
The arc constriction while passing from TIG to A-TIG with MgF2 and BaF2 is less important than oxides (40% for MgF2 and 30% for BaF2). However, the addition of magnesium fluoride during A-TIG welding leads to arc constriction and also a decrease in the arc length. This is why the penetration depth of the weld beads realised in A-TIG welding with MgF2 is deeper than the same process with the addition of one oxide, another fluoride or the mixture of them.
Energy density influence
The two-dimensional axial symmetrical model detailed in part I of this paper is used to study the effect of arc constriction on weld bead shapes. In this model, the heat source and electric current are represented respectively by a Gaussian heat source and Gaussian electric current applied on the sample surface (see equations (1) and (2)). In the present work, arc constriction is modelled by decreasing both the heat distribution coefficient r0 and the current distribution coefficient rc, which increase the heat and current densities near the axis
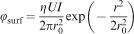
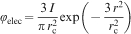
The parameters used for simulations are I = 100 A, U = 10 V and η = 75%. In the simulations, r0 varies from 2·5 and 1·6 mm and rc is from 3 to 1·55 mm with negative and positive Marangoni. Lorentz forces are taken into account or not. It is shown that the weld shapes change significantly with the variation of r0 and depend on the Lorentz forces only for the negative case (Fig. 6a and b). Without Lorentz force, by decreasing the value of the heat distribution coefficient r0 from 2·5 to 1·6 mm, the weld penetration is multiplied by a factor of 2 for the negative case and 4 for the positive case (Fig. 6b). The positive case is thus more sensitive to arc constriction with a significant increase in penetration depth. By taking into account the electromagnetic force, the weld shape of the negative case changes significantly with the value of r0 due to the creation of a second vortex by decreasing r0. With r0 = 2·5 mm and rc = 3 mm, the electromagnetic forces are not sufficiently high to create an inward flow, resulting in a shallow weld pool for the negative case. Hence, the arc constriction has two effects: by increasing the heat density, the surface temperatures of the weld pool will be higher, creating a wider and deeper weld pool, and by increasing the current density, the electromagnetic forces will be larger, resulting in a second vortex that will carry the heat energy towards the centre, causing a deeper weld penetration.

Comparison of weld pool geometry using r0 = 1·6 or 2·5 mm for negative and positive
and a with or b without Lorentz
It is noted that if the surface tension temperature gradient is positive, the electromagnetic force has little influence on the weld pool shape with regards to the variation of r0 and rc. However, it should be noticed that the surface tension temperature gradient is assumed here as a constant (positive or negative). In fact, if active elements such as sulphur are present in the material, the surface tension gradient can be negative at low temperatures but positive at higher temperatures, resulting in complex flow patterns. Wang et al. have shown that, depending upon the sulphur concentration, one, two or three vortexes may be found, caused by the interaction between the electromagnetic force and surface tension.6 These numerical results are in good agreement with experimental results and more particularly on the weld bead shape, which is more penetrated in A-TIG welding, as shown in part I of this paper.
Arc temperature
Optical visible emission spectroscopy is used in TIG and A-TIG welding with commercial flux and MgF2 on austenitic stainless steel 304L. These experiments were carried out for an arc at 80 A and 3 mm of arc length, at different distances z of the workpiece in the plasma column: near the plate, in the middle of the arc and near the cathode.
The recorded spectra are laterally integrated (along the observation direction). The local, radially resolved spectra were obtained assuming the cylindrical symmetry of the plasma column and applying the Abel transformation procedure, as described in Ref. 7. Then, the Abel inverted spectra of emission lines are fitted with the Voigt profiles that are composed of Gaussian and Lorentzian profiles. Under our experimental conditions, the Lorentzian profile was completely dominated by Stark broadening, while the Gaussian profile was essentially generated by instrumental broadening: in our experimental conditions, the Doppler broadening, due to the plasma temperature, is weak and can be neglected. The emission line intensity Inm is calibrated in energy for the given wavelength λmn using a tungsten ribbon lamp.
In the case of our plasma, there is no spectral line of flux elements except TiI. Near the welded material, only FeI spectral lines of metallic vapours were shown. This is why it is impossible to use the method proposed by Sola et al. 8 to determine simultaneously the electron density and the electron temperature without assumptions about the thermodynamic equilibrium of the plasma.7 There is no observation of maximum except the axis of the spectral line of ArI that enabled us to suppose that the temperature does not exceed the norm temperature (15 000 or 16 000 K) in argon plasma at thermodynamic equilibrium. There are little ArII spectral lines, mostly near the cathode, which supposes that the electron temperature does not exceed 18 000 or 20 000 K.
Some previous works have shown that the local thermal equilibrium (LTE) was obtain in plasma, at least at a sufficient distance to the cathode.9,
10 The electronic temperature has been calculated using the Boltzmann plot method, assuming LTE, with argon lines (mainly 415·8 nm ArI, 696·5 nm ArI and 706·8 nm ArI). This method is derived from the Boltzmann equation
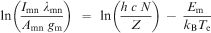
Figure 7 shows the average temperature calculated for different welding conditions (TIG, A-TIG with commercial flux and MgF2).
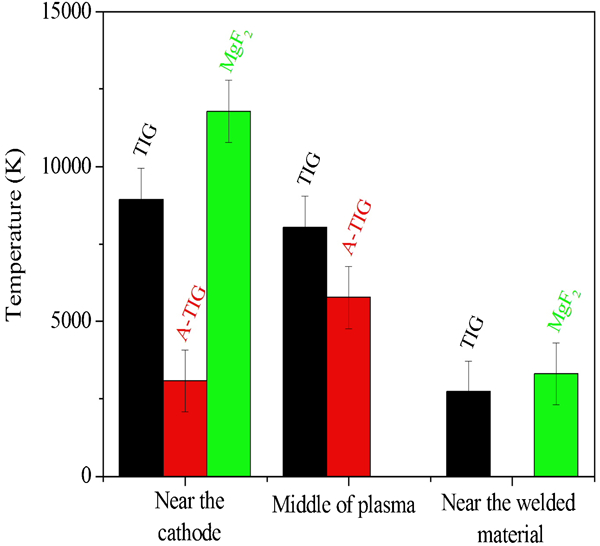
Arc temperature during TIG and A-TIG (commercial flux and MgF2) welding of 304L at 80 A, 3 mm of arc length, 15 cm min−1 of welding speed near cathode, middle of plasma and near welded material
We can observe a decrease in the arc temperature from the cathode (9000 K in TIG) to the welded material (2700 K in TIG). This phenomenon is explained by the spatial repartition of the elements in the arc (in this work, argon). The results do not present an elevation of arc temperature during A-TIG welding with commercial flux at different heights (3065 K near the cathode and 5765 K in the middle of arc). The activating effect of commercial flux comes from the inversion of Marangoni convection in the melting pool and of the arc constriction. Figure 8 presents an elevation of arc temperature during A-TIG welding with MgF2 at different heights of plasma (11 800 K in A-TIG for MgF2 and only 9000 K in TIG near the cathode). This clearly proves that the activating effect of magnesium fluoride comes from an elevation of arc temperature and its constriction combined with a decrease in the arc length.
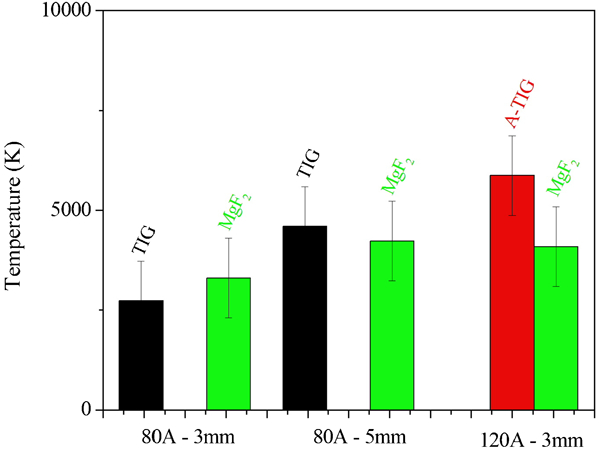
Arc temperature during TIG and A-TIG (commercial flux and MgF2) welding of 304L at 80 A, 3 mm of arc length, 15 cm min−1 of welding speed, at 80 A, 5 mm of arc length, 15 cm min−1 of welding speed and at 120 A, 3 mm of arc length, 15 cm min−1 of welding speed near welded material
In order to study the influence of welding current and arc length on the arc temperature, the experiments were repeated in TIG and A-TIG welding with commercial flux and MgF2 at 80 A and 5 mm of arc length and at 120 A and 3 mm of arc length. The last results obtained at 80 A and 3 mm are used as reference. The average temperatures of plasma near the welded material for each welding condition are reported in Fig. 8. Some researches have shown the relationship between arc tension and arc length. The more that the arc length is higher, the more that the arc tension is elevated. Other researches have estimated an elevation of the arc tension while passing from TIG to A-TIG welding.11– 13
Results from Fig. 8 present an elevation of the arc temperature with an increase in the arc length or an increase in the welding current. Indeed, during TIG welding, the arc temperature increases from 2700 to 4590 K while passing from 3 to 5 mm of arc length and in A-TIG welding with MgF2 from 3300 to 4220 K. We can observe that an increase in welding current leads to an elevation of arc temperature. In A-TIG welding with MgF2, the arc temperature is 3300 K at 80 A and 3 mm of arc length, whereas it is 4080 K at 120 A and 3 mm of arc length. The penetration and width of the weld bead are more important, while the welding current increases because the arc temperature increases too, leading to a surface tension gradient elevation.
Conclusions
This study enabled us to determine two of the main mechanisms of the A-TIG welding process: the arc constriction and the arc temperature elevation. Arc shape visualisation has shown the arc constriction phenomena for different fluxes. The arc constriction is more important for a flux constituted of only one oxide (TiO2, Cr2O3 or K2Cr2O7) compared with commercial flux. To model the arc constriction phenomena, reduced heat and current distribution coefficients were used, resulting in a deeper predicted weld penetration. Numerical results have shown that the weld shapes change significantly with the energy density and depend on the Lorentz forces only with a negative surface tension temperature coefficient
 . Optical visible emission spectroscopy enabled us to approve the hypothesis on the elevation of arc temperature while passing from TIG to A-TIG for MgF2. Several results have shown the influence of welding current and arc length on the arc temperature in TIG and A-TIG welding. At last, we have seen the performance of magnesium fluoride in A-TIG welding coming from the arc constriction combined with a decrease in the arc length and the elevation of arc temperature.