
Abstract
In multipass welding, each successive thermal cycle will introduce local melting, solid state phase transformations, grain growth, grain refinement, recrystallisation and recovery, all of which lead to a complicated stress state. Most stress measurements performed on multipass welded components represent the final residual stress state. Information concerning stress evolution on a pass-by-pass basis is difficult to find. In this investigation, six pass welds were made on high strength quenched and tempered steel sections, and depth resolved strain measurements in two orthogonal directions were carried out after each weld pass using energy dispersive synchrotron X-ray diffraction. The residual stresses were calculated using biaxial Hooke's law. A thermal–metallurgical–mechanical welding model was constructed and validated with temperature and pass-by-pass stress measurements, which improves the reliability of the model. Cross-sectional stress distributions are presented after each pass, revealing the weld stress development in multipass welds.
Keywords
Introduction
During welding, thermal cycling induces alterations in the microstructure and material properties of the weld metal and the surrounding heat affected zone. 1 Moreover, residual stresses are inevitably present as a result of plastic deformation induced by non-homogeneous thermal expansion and contraction, melting, solidification and phase transformations in the solid state.2–4 The welding induced residual stresses can have both a beneficial and a harmful effect on the lifetime of products, depending on the sign, magnitude and distribution with respect to load induced stresses. 5 Typically, tensile residual stresses reduce the fatigue life of components by assisting fatigue crack initiation and growth, while compressive residual stresses increase the fatigue endurance. 6 Multipass welding is generally performed on thick section materials. The first weld pass is often made with a relatively low heat input to avoid burn-through. In subsequent weld passes, higher welding heat inputs are generally employed to maximise productivity. Each successive thermal cycle will introduce additional local remelting, solid state phase transformations, grain growth, grain refinement, recrystallisation and recovery, all of which result in a complicated stress state. 7
Most stress measurements performed on multipass welded components represent the final residual stress state.8–10 Information concerning stress development after each weld pass is difficult to find. In numerical simulations, errors in stress prediction associated with each successive weld pass may accumulate, leading to poor accuracy, particularly after a large number of passes. Even if good agreement is found between numerical solutions and the final residual stress measurements, this does not mean that the finite element model gives an appropriate representation of the stress evolution.
Thermal mechanical tests with appropriate thermal loading and constraint conditions are used to investigate the stress development during multipass welding. Satoh et al. 11 evaluated transient stresses in round bar test specimens subjected to thermal cycles typically occurring in the heat affected zone of a weld. In these tests, the localised heating induced a non-uniform temperature distribution over the gauge length and stress gradients due to plastic deformation can be expected along the sample length. Shirzadi and Bhadeshia 12 modified the thermal–mechanical ‘Satoh’ tests by bonding two pieces of non-transforming nickel superalloys to the end of the test materials, which ensured a homogeneous temperature and stress within the tested material. Gao et al. 13 made a further improvement to represent the weld boundary conditions more closely by allowing free dilatation in the heating stage of the thermal cycle, while in the cooling stage the sample was fully constrained. However, these tests are only representative of the top and bottom surfaces of a multipass welded plate with known time–temperature profiles. Furthermore, the mechanical boundary conditions are defined as either free dilatation or fully constrained, while in real welding situations, the constraints are more gradually generated during solidification. These tests can only give an indication of the stress development during multipass welding at specific positions. Pass-by-pass stress measurements are valuable for the development of numerical simulations, providing data to validate the calculated stress distribution after each weld pass. This will lead to more accurate and reliable predictions of multipass weld residual stress fields.
Experiment arrangement
Welding
A 16 mm thick quenched and tempered structural high strength steel with a yield stress of 830 MPa (S690QL1; Fe–0·16C–0·2Si–0·87Mn–0·33Cr–0·21Mo, wt-%; EN 10025-6-2004+A1) 14 was used in this study. Six welded specimens were prepared ranging from 1 to 6 weld passes. K-type thermocouples were discharge welded 3, 10, 30 and 50 mm from weld centreline on the bottom surface to measure transient temperature profiles. Welds were made on V grooved plates by means of gas metal arc welding as shown in Fig. 1a. The position of the welding torch was in the centre of the V groove during the first pass, but was repositioned for each subsequent weld pass. Details of the welding conditions can be found elsewhere. 15 During welding, the workpiece was clamped, and the clamps were released when the plates had completely cooled down to room temperature.
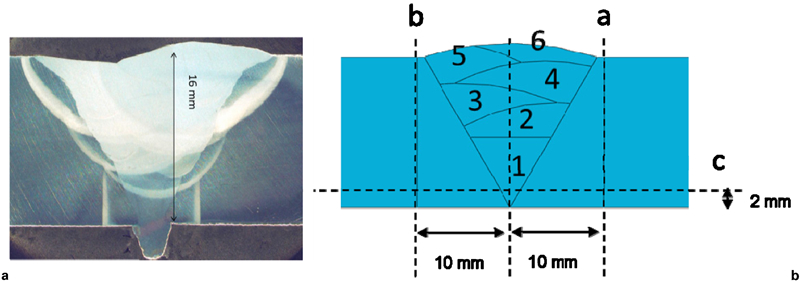
a cross-section of six pass weld and b schematic illustration of bead placement where ‘a’, ‘b’ and ‘c’ indicate the lines along which the strain measurements were conducted
Strain measurement
Strain measurements in two orthogonal directions were carried out using energy dispersive synchrotron X-ray diffraction at the ID15 beamline at the European Synchrotron Radiation Facility. A white beam of 0·1×0·1 mm was used. Two liquid nitrogen cooled germanium single crystal detectors were placed at 2θ positions of approximately 5°. In this configuration, a gauge length of 2 mm was obtained. The exposure time for each position was 150 s. A pseudo-Voigt approximation was applied to find the peak energy of the diffraction patterns. From Bragg's law, for a fixed diffraction angle, the energy is inversely proportional to the lattice d spacing.
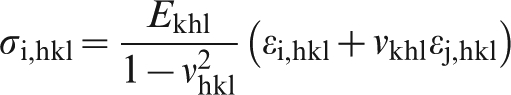
The strains were calculated from the shift in the local d spacing with respect to the stress free d0 spacing of four bcc planes ([200], [211], [220], [310]). The d0 spacing was obtained from a stress free sample with a thickness of 2 mm, which was electrodischarge machined from the middle of the six pass welded plate. The planar stresses were calculated from the biaxial Hooke's law
Modelling arrangement
A sequentially coupled thermal–metallurgical–mechanical model was constructed. The thermal model was used to analyse the conversion from an external thermal load to the temperature distribution in the workpiece. The temperature field (spatial temperature distribution as a function of time) was then imported into the metallurgical–mechanical model for the stress analysis.
The essential part of the thermal analysis is to correctly define the heat source and heat losses. The heat source (i.e. the arc) generates a heat flux entering the workpiece, which is transported by isotropic heat conduction according to Fourier's law. 18 The heat losses from the workpiece are governed by heat conduction, convection and radiation at the surfaces. This heat balance is presented schematically in Fig. 2.
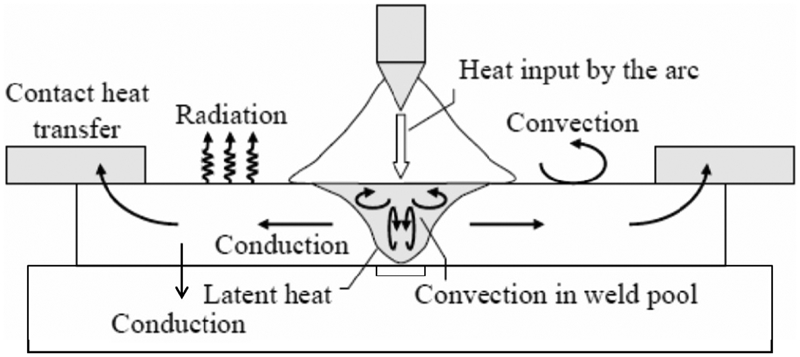
Heat balance of workpiece during welding
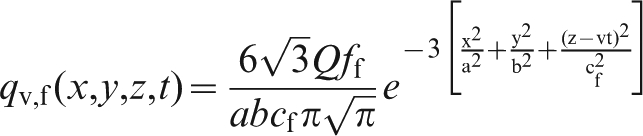
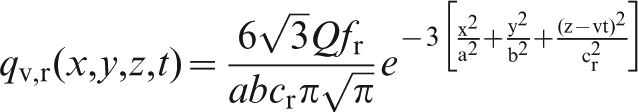
Goldak's19, 20 double ellipsoid heat flux distribution representing the welding heat source is applied in this study. The heat fluxes, qv,f(x,y,z,t) and qv,r(x,y,z,t) (W m−3), describe the spatial heat flux distribution as a function of time t (s) in the front and rear section of the heat source respectively and can be expressed as
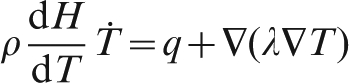
The energy balance over the workpiece according isotropic heat conduction gives
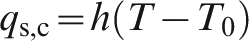
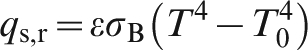
The heat loss
22
by surface conduction and convection qs,c (W m−2) can be defined as
A two-dimensional (2D) shell heat transfer model was constructed representing a cross-sectional plane in the middle of the welded plate, where steady state welding conditions were assumed. A four node linear heat transfer quadrilateral (DC2D4) 23 (commercial code Abaqus) was defined for the element type with linear geometrical order. The mesh size in the weld centre is 1×1×1 mm, whereas near the edges of the plate the size is 8×8×1 mm, see Fig. 3a. A model change technique was used to represent the deposition of filler metal for the each weld pass. The initial temperature of the workpiece was defined as room temperature. The three-dimensional double ellipsoid heat source (equations (2) and (3)) passes the cross-sectional plane. The heat is transported within the plane by conduction (equation (4)). Heat losses were modelled with a surface film and by radiation (equations (5) and (6)). Thermal material properties, such as conductivity, specific heat capacity and density as a function of temperature, were assigned to the model (see Fig. 3b).
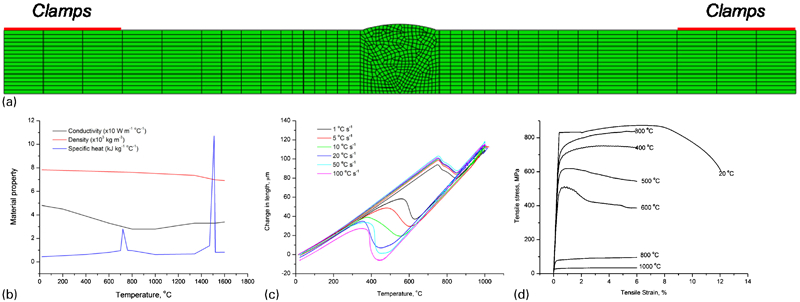
a model mesh, b temperature dependent thermal properties, c dilatation during thermal cycling with different cooling rates, d flow curves 13 of S690QL1
A 2D shell generalised plane strain model 15 was used for stress analysis, which involves two parallel bonding planes that can move with respect to each other. One reference node was introduced and fully constrained. The thickness of the reference node is defined as the length of the workpiece (300 mm). The selected element type is CPEG4R 23 with element reduced integration. Mechanical boundary conditions were modelled by constraining certain nodes. Underneath the positions of the clamps, the vertical displacement is constrained; two bottom corners were also constrained to prevent horizontal and vertical displacement. These constraints are removed after unclamping.
Equivalent plastic strain was reset to zero for the region that reached a temperature higher than the solidius temperature. Volume changes due to the solid state phase transformations at different cooling rates obtained from free dilatation tests (see Fig. 3c), were implemented. Elasto-plastic deformation is modelled based on tensile testing at elevated temperature. Temperature dependent mechanical properties, such as thermal expansion coefficient, Young's modulus and plasticity, shown in Fig. 3d, were assigned to the elements. SI units (kg, m, s) are used in the models.
Results
Temperature measurements and thermal model validation
The dotted lines in Fig. 4 show the transient temperatures during the six thermal cycles measured on the bottom surface of the plate equidistant from the start and end of the welds at a sampling rate of 1 Hz. The numerical results at the same positions are included as solid lines. The peak and interpass temperatures of the experimental measurements and the numerical simulations at these four positions are in good agreement, indicating that the heat transfer analysis is appropriate. The discrepancy between experimental and numerical results at a distance of 50 mm from the weld centreline is within 50°C, which will not affect the stress prediction to a large extent.
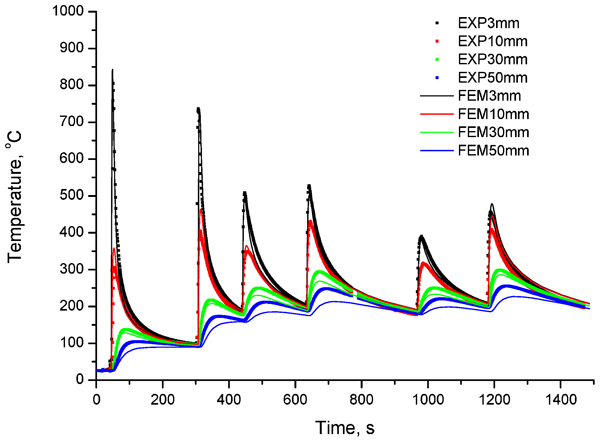
Experimental and numerical temperature cycles of six pass weld at four positions from weld centreline on bottom surface
Strain measurements by synchrotron radiation
Transverse strains (i.e. perpendicular to the welding seam) are measured at 10 mm from the weld centreline along line ‘a’, as indicated in Fig. 1b. Strain as a function of the distance from the bottom surface after successive weld passes is presented in Fig. 5. The first weld pass is deposited in the centre of the groove and fills the groove up to 7 mm from the bottom surface. The strain along line ‘a’ close to the bottom surface is positive. A decreasing tendency of strain is observed from the bottom to the top surface. For the second pass the heat source is repositioned to the top right hand side of the first pass, i.e. the heat source is closer to line ‘a’ and the material is asymmetrically deposited, extending to 10 mm from the bottom surface. The strain close to the bottom surface is smaller than that in the previous step, while an increasing tendency of the strain is observed from 4 to 10 mm from the bottom surface due to the deposition of the second weld layer. The third pass is made on the top left hand side of the second pass, and the heat source is repositioned further from line ‘a’. The strain level along line ‘a’ becomes more positive. After the fourth pass, the deposited material fills the groove up to 14 mm from the bottom surface on the right hand side of the weld groove. The strain becomes more negative at the top surface. When the weld nears completion after the fifth pass, the measured strain is less negative at the top surface. A similar trend can be seen when the final pass is made. Figure 6 shows a comparison of measured transverse strains along line ‘a’ and ‘b’ after successive weld passes. Line ‘b’ is located 10 mm from the weld centreline on the opposite side of the weld. The first pass is symmetrically deposited and the measured strains along line ‘a’ and ‘b’ are similar. The repositioning of the heat source dictates which side of the groove experiences a higher strain. This confirms the trends describe before, indicating that the position of the heat source and the degree to which the groove is filled affect the strain levels. The last weld pass covers the entire weld groove. A smooth weld toe is formed, which leads to a reduction of strain at the top surface.
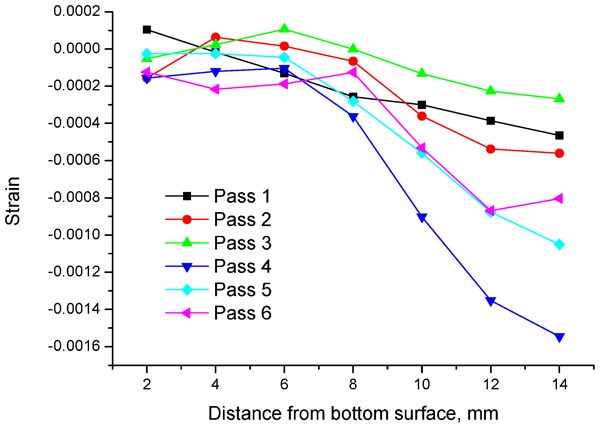
Measured transverse weld strain as function of distance to bottom surface at 10 mm from weld centreline along line ‘a’ after weld pass 1 to 6

Comparison of measured transverse strain along line ‘a’ and ‘b’ after weld pass 1 to 6
Pass-by-pass stress validation
Line ‘c’ is located 2 mm from the bottom surface perpendicular to the weld seam. The transverse stresses along line ‘c’ after successive weld passes are plotted in Fig. 7. The dots indicate the experimental measurements and the solid lines indicate the simulated results. In the first weld pass, the shrinkage of the weld metal is counteracted by the constraints from the base material, which leads to tensile stresses in the fusion zone. At a distance of 5 mm from the weld centreline, the stresses become compressive. At a distance of 10 mm from the weld centreline, both the model and experiments show a maximum tensile stress. Up to 20 mm from the weld centreline, a decreasing tendency is observed. From 20 mm, the predicted stress remains unchanged to the edge of the specimen, while the measured stress gradually decreases. In successive weld passes, similar phenomena are found; however, asymmetrical stress distributions are observed due to the repositioning of the heat source. Overall, the model has a reasonable accuracy when predicting the stress build-up.
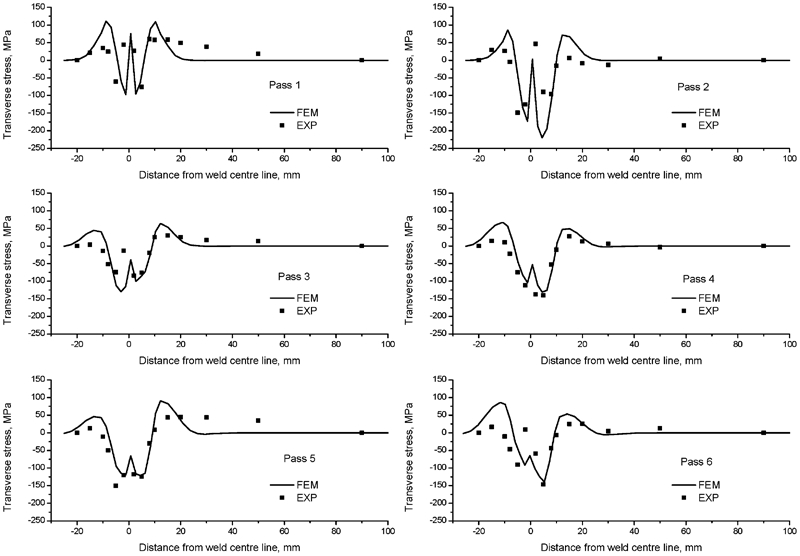
Transverse stress validation at 2 mm from bottom surface perpendicular to weld seam after weld pass 1 to 6
Figure 8 shows the measured and predicted transverse stress distributions of the six pass weld. The results are compared over a rectangular grid of 40×12 mm. The predicted stress level close to the bottom surface shows a good agreement with the experimental results. In the middle of the weld, the predicted maximum tensile stress is underestimated by 100 MPa. This deviation may be generated from the d0 measurement. Some residual stresses may still remain at this region in the stress free sample; d0 can be underestimated, which in turn leads to a shift of the stress.
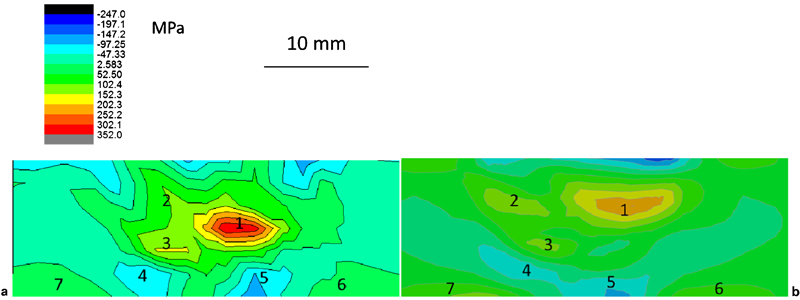
Transverse stress maps over weld cross-section
The stress distributions over the measured and simulated cross-section show a strong resemblance. The tensile region present under the last weld bead in the middle of the weld predicted by the model, can also be observed in the experimental measurements (region 1). The less tensile regions 2 and 3 generated due to the third and the fifth weld passes are also found in the measured results. In regions 4 and 5, close to the weld root, concentrated compressive stresses are observed, while in regions 6 and 7, tensile stresses are present both in the measured and simulated results.
Discussion
Fatigue problems of welded components normally arise under transverse loading. Transverse tensile stresses within the workpiece are critical for crack initiation and propagation. Therefore, the focus in this work is on the transverse stress distribution. A better understanding of the stress build-up and redistribution in the weld specimen is invaluable for improving multipass welding techniques.
The simulated transverse stress distributions after each weld pass with and without clamping are shown in Fig. 9. It can be seen that during the fabrication of a six pass weld, the tensile and compressive regions shift and unclamping also has a redistributing effect on the stresses.
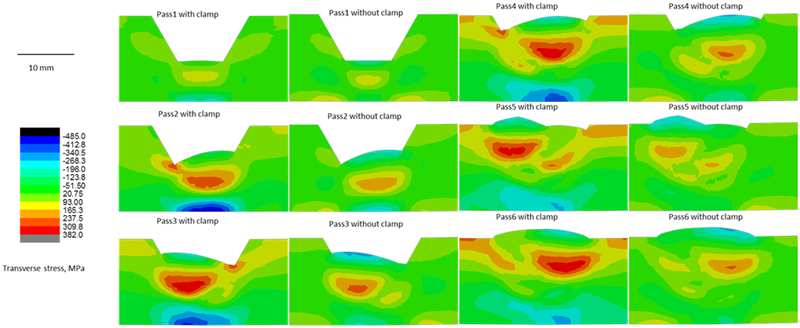
Transverse stress map development from 1 to 6 pass with and without clamps
During the first weld pass, the filler material is symmetrically deposited in the weld groove, while the workpiece is constrained by the clamping device. Tensile stresses are generated in the weld bead counteracting the transverse shrinkage. Due to the V shape of the deposited weld bead, the upper part of the weld has a larger contraction than the lower part, which leads to a compressive region in the root area. At the top surface of the weld bead, the material has more freedom during cooling, and thus a maximum tensile stress is present below the weld bead surface. Tensile stresses concentrate at the groove weld bead interface due to geometrical effects. After unclamping, the elastic stresses within the workpiece are partially released, which leads to a distortion of the workpiece and redistribution of stresses. Near the top surface of the weld bead the stress becomes compressive. The previously present tensile zone becomes smaller in size and shifts towards the bottom surface. Due to the distortion at the bottom surface, two tensile regions are generated to maintain stress equilibrium.
The heat source is repositioned after each weld pass. Additional heat is introduced in the subsequent passes, partially remelting the previous weld bead. The remaining solid heats up but has a constraining effect on the workpiece. The compression close to the weld root will build up as the contraction due to subsequent passes is opposed by the previously deposited material. With an increasing number of passes, the level of the compressive stress reduces as the heat source moves upward and the area supporting the shrinkage becomes larger. With each deposited pass, the tensile zone moves upward and is concentrated underneath the location of the heat source. After completion of the weld, the stresses at the weld toe are reduced as the transition of weld metal to base metal becomes smoother, and geometrical effects become smaller.
Some limitations of this work should be noticed. Experimentally it is difficult to measure the in situ stress during welding in the synchrotron X-ray beam. The solution addressed here is a compromise, where ex situ stresses are measured after the completion of each pass. Six welded samples with different number of passes were prepared in advance. Therefore, the stress development mentioned in this work is not on the same plate, but on six plates with the same welding arrangement (automated welding set-up with the same welding parameters). As the investigation of stress development is aimed at a six pass welded section, the penetration of the beam flux is limited by the sample thickness. The workpiece attached to the backing plate and clamps cannot be measured in transmission mode; the stresses were therefore measured in the unclamped condition.
To compare with the measured stress in the unclamped condition, the predicted stress fields at each interpass temperature were stored. In an additional analysis step, the evolution of these stress fields during further cooling to the room temperature followed by unclamping was calculated. To study the stress development for subsequent passes, the analysis was restarted at the interpass temperature.
Fluid flow is not considered; the heat redistribution is incorporated in the elliptical heat flux model of Goldak. The equivalent plastic strain of an element is reset to zero when the temperature exceeds the solidus temperature, ensuring that no stresses are built up in the liquid metal.
The effects of solid state phase transformations in the quenched and tempered base metal on the stress development are modelled based on free dilatation tests. If the peak temperature of an element remains lower than the Ac1 temperature, the thermal expansion and contraction follows the dilatation curve of tempered martensite. If the peak temperature of an element exceeds the Ac3 temperature, the volumetric change of the phase transformation is included, while during cooling, thermal contraction follows the dilatation path of austenite. Depending on the cooling rate bainite, martensite or a mixture of these phases will be formed. The starting point of the transformation is determined from the dilatation curves. It should be mentioned that the dilatation curves are measured for a single peak temperature of 1000°C. In a real weld, the variation in peak temperature is between Ac3 and the liquidus, affecting the grain size and thus the transformation behaviour. In a relatively small region of a weld, the peak temperature is in the intercritical region (less than 1 mm), where tempered martensite and austenite co-exist. In the model, elements in the intercritical region follow the dilatation path of the heating cycle during cooling, i.e. the austenite transforms directly into tempered martensite. This implies that the volumetric change due to the phase transformation is released at a high temperature, which can induce a minor error. The mechanical material properties assigned in the model might have a larger effect on the calculated stress state. Tensile tests of the quenched and tempered base metal were carried out at elevated temperatures, and these properties were also applied to the model in the cooling stage. However, during the cooling cycle, the austenitic phase is metastable up to the martensite start temperature, whereas in the model, properties of tempered martensite are still applied.
Materials data improvements can be made including
dilatation tests at several peak temperatures in the intercritical region with different cooling rates
tensile tests after cooling austenite to a specific temperature.
Conclusion
Pass-by-pass stress measurements were carried out for six pass welds and a sequentially coupled thermal–metallurgical–mechanical model was constructed to investigate the stress evolution in multipass welds.
The 2D shell thermal model is able to predict the time–temperature profiles with good accuracy. Stress developments after each weld pass were measured by synchrotron X-ray diffraction. The predicted transverse stresses using the 2D shell generalised plane strain model are qualitatively validated by the experimental results. A pass-by-pass stress comparison with the experimental results increases the reliability of the model. The measured results provide valuable data for validating numerical models of multipass welds. Cross-sectional stress evolution of a six pass weld is discussed on a pass-by-pass basis leading to a better understanding of the stress development during multipass welding. Compressive stresses close to the root mainly build up in the first three weld passes, after which a decreasing tendency is observed as the heat source moves up and the area opposing shrinkage of each successive passes becomes larger. The completion of the weld leads to a stress reduction at the weld toes. A concentrated tensile zone due to contraction is present in the weld bead below the surface, and this zone is relocated on a pass-by-pass basis due to the asymmetrical deposition of the beads.