
Abstract
Implementation of new materials in automotive body-in-white requires through knowledge of their metallurgical response to welding process thermal cycle. This two-part paper aims at understanding the physical and mechanical metallurgy of stainless steels, as interesting candidates for automotive application, during resistance spot welding. The second part addresses the phase transformations in the heat affected zone of three types of stainless steels including austenitic, ferritic and duplex steels. Failure modes and mechanical properties of stainless steel resistance spot welds are discussed. The peak load and energy absorption of stainless steel resistance spot welds are compared with advanced high strength steels.
Keywords
Introduction
Demand for high strength steel sheets having excellent ductility has been increasing in the automotive industry in order to improve the fuel efficiency and occupant's safety and reduce the car body weight.1, 2 Owing to the combination of excellent strength and formability, stainless steels offer the potential for improvement in vehicle crash performance without increase in weight.3, 4
Resistance spot weldability of automotive alloys is one of the key factors governing their application in the automotive industry. Vehicle crashworthiness, which is defined as the capability of a car structure to provide adequate protection to its passengers against injuries in the event of a crash, largely depends on the integrity and the mechanical performance of the spot welds.1, 5–7 The energy absorption capability of the spot welds, which is an important parameter in vehicle crashworthiness, is controlled by weld physical attributes [especially fusion zone (FZ) size and electrode indentation size] and weld metallurgical attributes [microstructure of the base metal (BM), FZ and heat affected zone (HAZ)].4–10
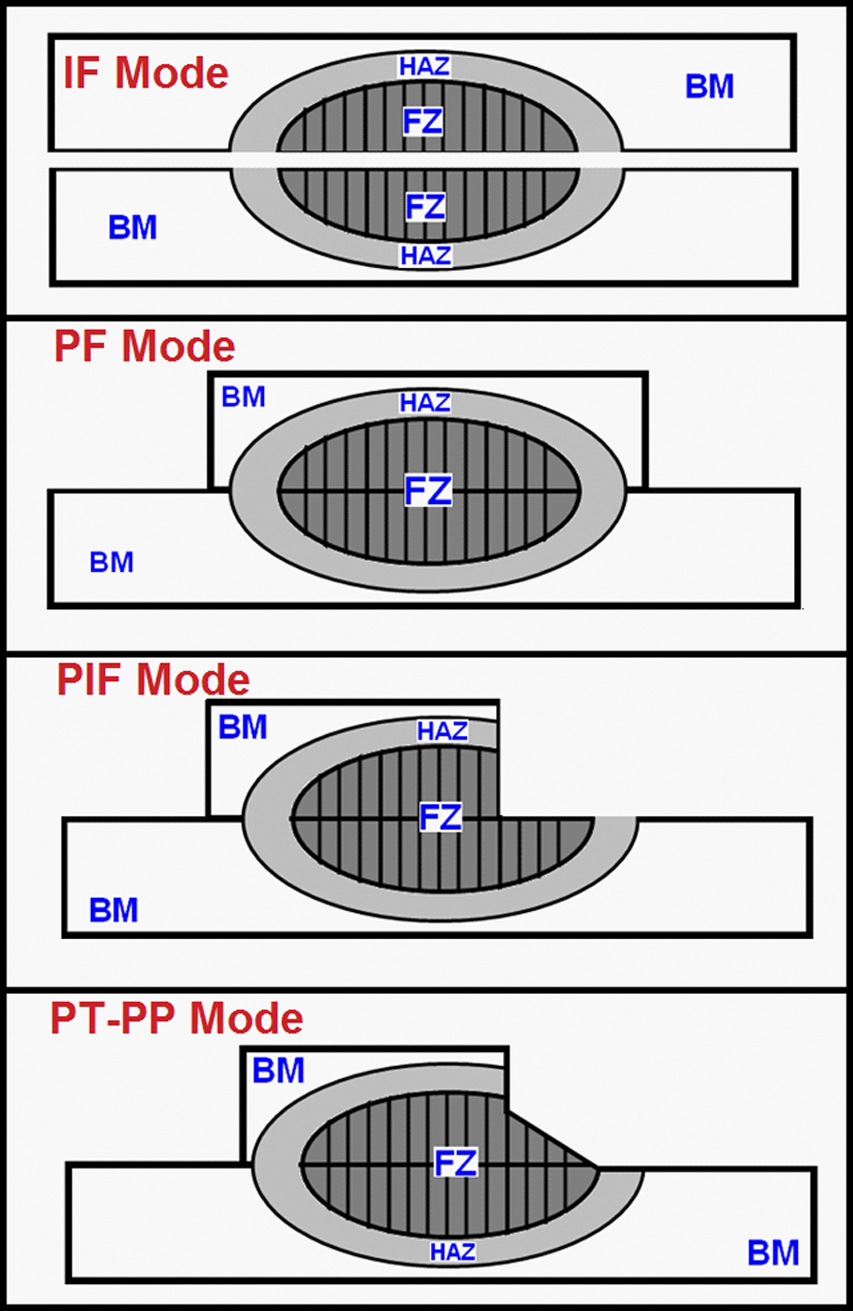
The failure mode of spot welds (i.e. the fracture path of spot welds during mechanical loading) is a qualitative measure of weld performance. Figure 1 shows the schematic of major failure modes of resistance spot welds. Generally, spot welds fail at four different modes (Fig. 1):1, 10–17
interfacial failure mode in which fracture propagates through the FZ pullout failure (PF) mode in which failure occurs via withdrawal of the weld nugget from one sheet; in this mode, fracture may initiate in the BM, HAZ or HAZ/FZ depending on the metallurgical and geometrical characteristics of the weld zone and the loading conditions partial interfacial failure mode in which the fracture first propagates in the FZ and is then redirected towards the thickness direction partial thickness–partial pullout (PT-PP) mode in which fracture initiates in a manner similar to PF mode; however, some part of mating sheet thickness is removed by a slant crack through the FZ during final crack propagation around the circumference of the weld nugget. Schematic of various failure modes during mechanical testing of resistance spot welds
The microstructural evolution of convectional and advanced high strength steels (e.g. martensite formation in FZ and HAZ and martensite tempering in HAZ) have been studied in reasonable details.5–13 However, the welding metallurgy of stainless steels during RSW is yet to be addressed. There are limited works on the resistance spot weldability of stainless steels.15–17, 25 Part I of this work 26 addressed the solidification and post-solidification phase transformations in the FZ of three types of stainless steels, including austenitic, ferritic and duplex steels. Part II is focused on the phase transformations in the HAZ and mechanical properties of stainless steels spot welds. Peak load and energy absorption of stainless steels are compared to mechanical properties of advanced high strength steel resistance spot welds.
Experimental
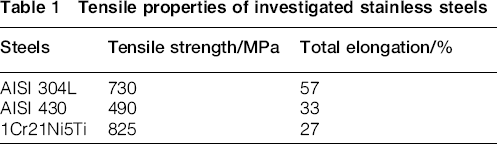
Three different types of stainless steels were used as the BMs, including AISI 304L austenitic stainless steel (ASS), AISI 430 ferritic stainless steel (FSS) and 1Cr21Ni5Ti duplex stainless steel (DSS). The mechanical properties of the sheets used in this study are given in Table 1. The sheet thickness for all steels is ∼1.2 mm.
Tensile properties of investigated stainless steels
Resistance spot welding was performed using a 120 kVA ac pedestal type RSW machine operating at 50 Hz controlled by a programmable logic controller. Welding was conducted using a 45° truncated cone resistance welding manufacturing alliance class 2 electrode with 8 mm face diameter. The welding schedule is shown in Fig. 2 a.
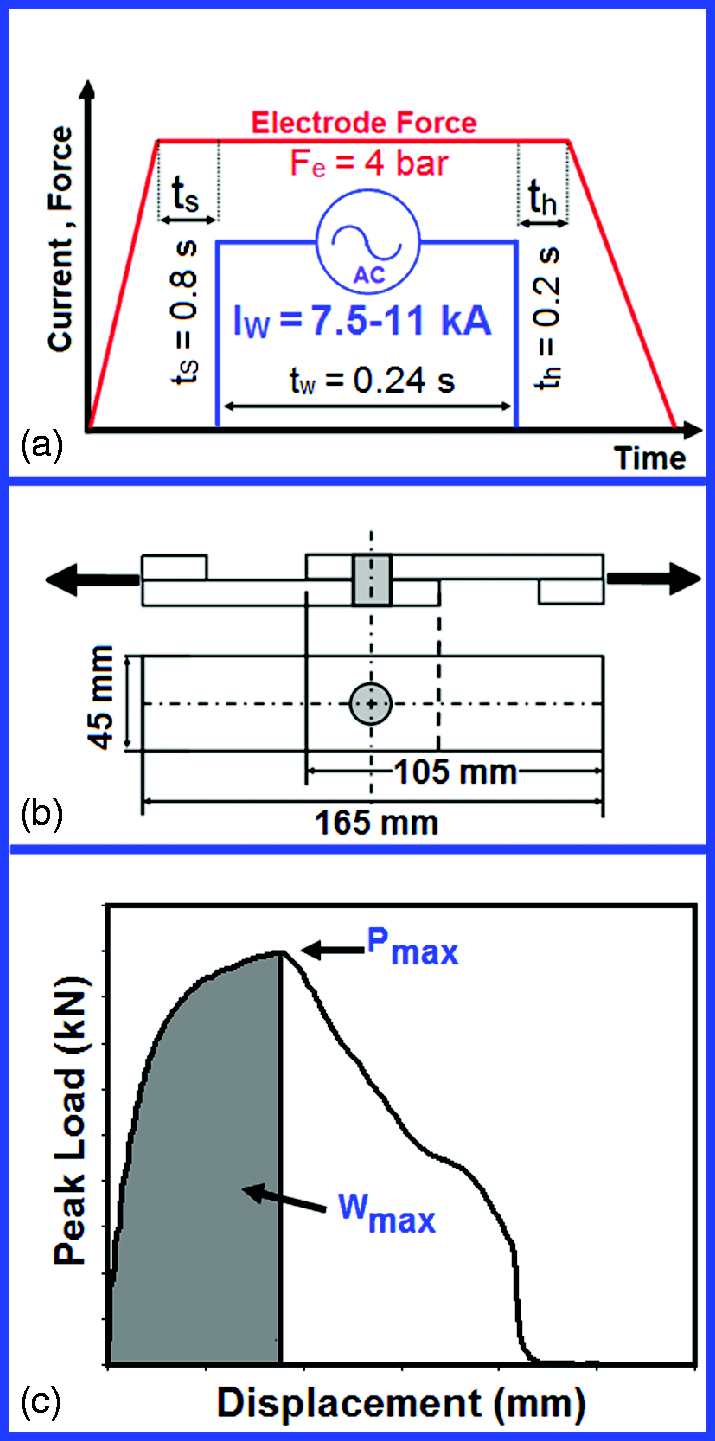
a welding schedule tS, squeeze time tW welding time, th holding time and IW welding current, b tensile shear specimen dimensions and c typical load–displacement curve along with extracted parameters Pmax peak load and Wmax energy absorption
Samples for metallographic examination were prepared using standard metallography procedure. Optical microscopy was used to examine the microstructures of the joints. Marble etchant (10 g CuSO4, 50 mL HCl and 50 mL H2O) was used for macrostructural examination of the joints. Kalling's no. 1 reagent (33 mL H2O, 1.5 g CuCl2, 33 mL HCl and 33 mL C2H5OH), oxalic acid etchant (10 g oxalic acid and 100 mL H2O) and electrolytic KOH etchant (56 g KOH and 100 mL H2O) were used for examination of HAZ microstructure of FSS, ASS and DSS welds respectively. Vickers microhardness test was performed using an indenter load of 100 g for a period of 20 s.
The quasi-static tensile shear test samples were prepared according to ANSI/AWS/SAE/D8.9-97 standard. 27 Fig. 2b shows dimensions of the tensile shear test sample. Since the tensile shear specimen is asymmetrical, two shims having the same thickness were added at the grip sections of the specimen to ensure the alignment and to reduce the sheet bending and nugget rotation phenomenon. The tensile shear tests were performed at a crosshead of 2 mm min1 with an Instron universal testing machine. Peak load and energy absorption of the joints were extracted from the load–displacement curve (Fig. 2c). Failure modes of spot welds were determined by observing the weld fracture surfaces. The morphology of the fracture surfaces was examined by SEM.
Results and discussion
Microstructural evolution of HAZ
Heat affected zone of ASSs
Figure 3 a shows the BM microstructure of investigated AISI 304L ASS indicating austenitic grains and annealing twins. According to Fig. 3b, a very narrow (∼50 μm) HAZ was observed. The narrow HAZ is a function of low thermal diffusivity and thermal conductivity of the ASS as well as high heat intensity of RSW process. According to Fig. 3c, there is a reduction in HAZ hardness compared to the BM. The HAZ hardness in ASSs is dictated by grain growth, recrystallisation, δ-ferrite formation and Cr rich carbide precipitation. 28 Since the initial ASS BM was in annealed condition, recrystallisation is not possible. Moreover, due to rapid heating rate of RSW, the γ → δ transformation has less time to occur. Furthermore, Cr carbide precipitation in low C AISI 304L is not possible. Therefore, the slight loss of hardness in HAZ can be attributed to the grain growth in austenite phase. As can be seen in Fig. 3b, some grain growth is evident in the HAZ; however, it is not dramatic. It is interesting to note that the degree of HAZ softening was changed from 10 to 25% of the BM. The minimum hardness of the HAZ was decreased from 205 to 175 HV with increasing welding current from 7.5 to 11 kA.
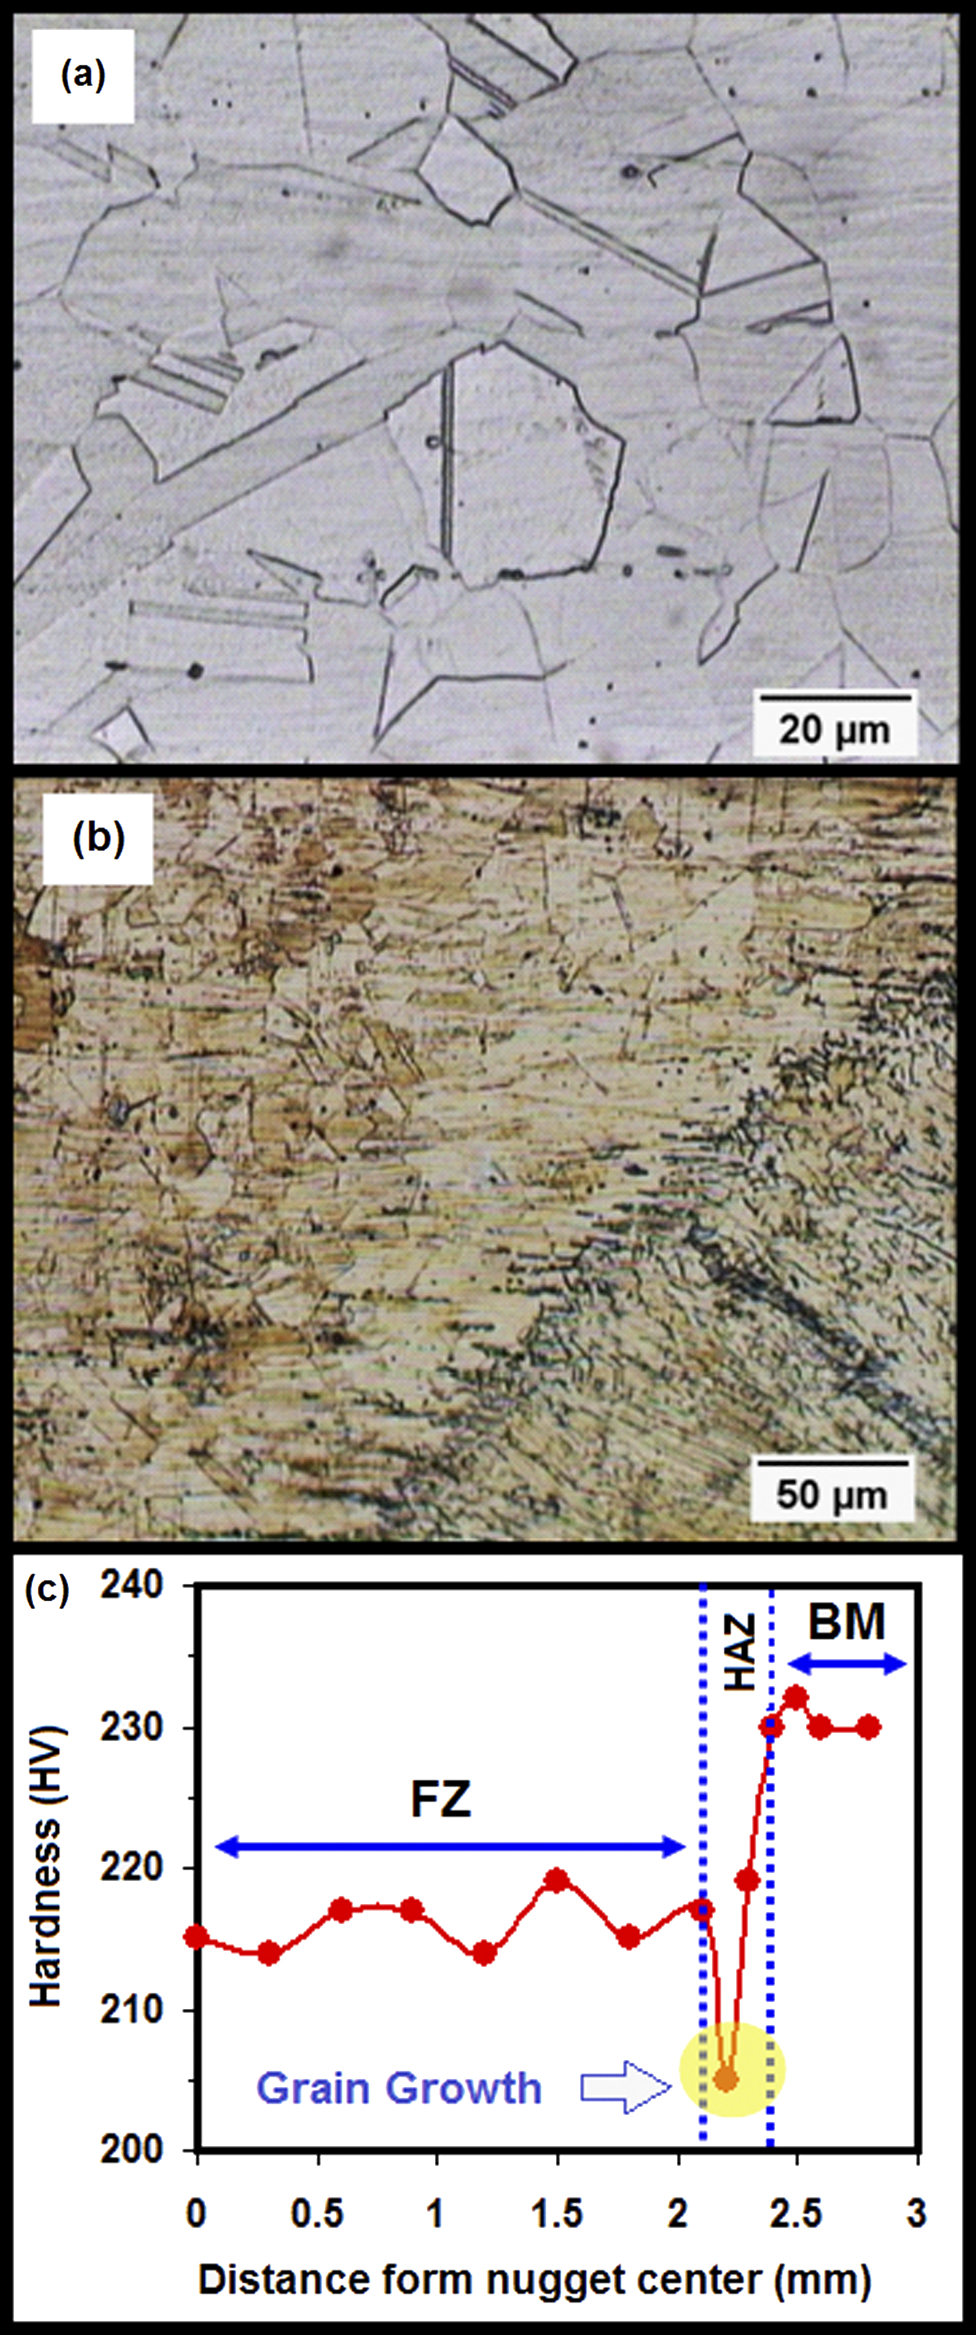
a microstructure of base metal; b grain growth in HAZ; c hardness profile across weld
Heat affected zone of FSS
Figure 4 a shows the microstructure of the AISI 430 BM indicating a fully ferritic microstructure along with carbides, which are evenly distributed throughout the matrix. Phase transformations in HAZ of AISI 430 steel can be explained with the help of Fe–Cr–C pseudobinary diagram at 17%Cr (Fig. 4b).
29
Fig. 4c shows the microstructure gradient in the HAZ of the FSS side. According to the temperature distribution, HAZ can be divided to two distinct metallurgical transformation zones, namely high (HTHAZ) and low temperature HAZ (LTHAZ). The phase transformations in these zones are detailed, as follows:
High temperature HAZ: based on the pseudobinary diagram (Fig. 4b), in this region, BM microstructure transforms to fully δ-ferrite microstructure at the elevated temperature. Since the dissolution temperature of Cr rich carbide (Cr23C6) for the investigated steel is ∼1000°C (Fig. 4b), the carbide particles in the BM are completely dissolved increasing the carbon content of δ-ferrite. Upon cooling, a ferritic microstructure is retained, and due to very low solubility of carbon in δ-ferrite at room temperature, extensive reprecipitation of the carbides occurs (Fig. 4d). The absence of high temperature austenite phase in HTHAZ has two consequences:
The austenite at the grain boundaries at elevated temperature can inhibit ferrite grain growth by pinning the grain boundaries.
28
Therefore, ferrite grain growth at this region can be quite dramatic, as it is evident from Fig. 4d. It is interesting to note that the grain growth is more pronounced for AISI 430 compared with that of AISI 304L HAZ. Any austenite that may have formed at elevated temperature will transform to martensite during the cooling cycle. Therefore, due to the absence of the high temperature austenite, an almost martensite free microstructure is formed in HTHAZ during cooling (Fig. 4d). Low temperature HAZ: based on the pseudobinary diagram (Fig. 4b), in this region, some austenite is formed during heating. The amount of austenite at the grain boundaries of δ-ferrite strongly depends on the carbon content of the alloys and the peak temperature. The equilibrium volume fraction of austenite in δ+γ region is greater than its value in δ+γ + C1 region. Nevertheless, due to low carbon content of the investigated AISI 430 steel (i.e. 0.05 wt-%), a very limited amount of austenite is formed in LTHAZ. The transformation of austenite to martensite depends on the austenite stability. According to Kung and Rayment,
30
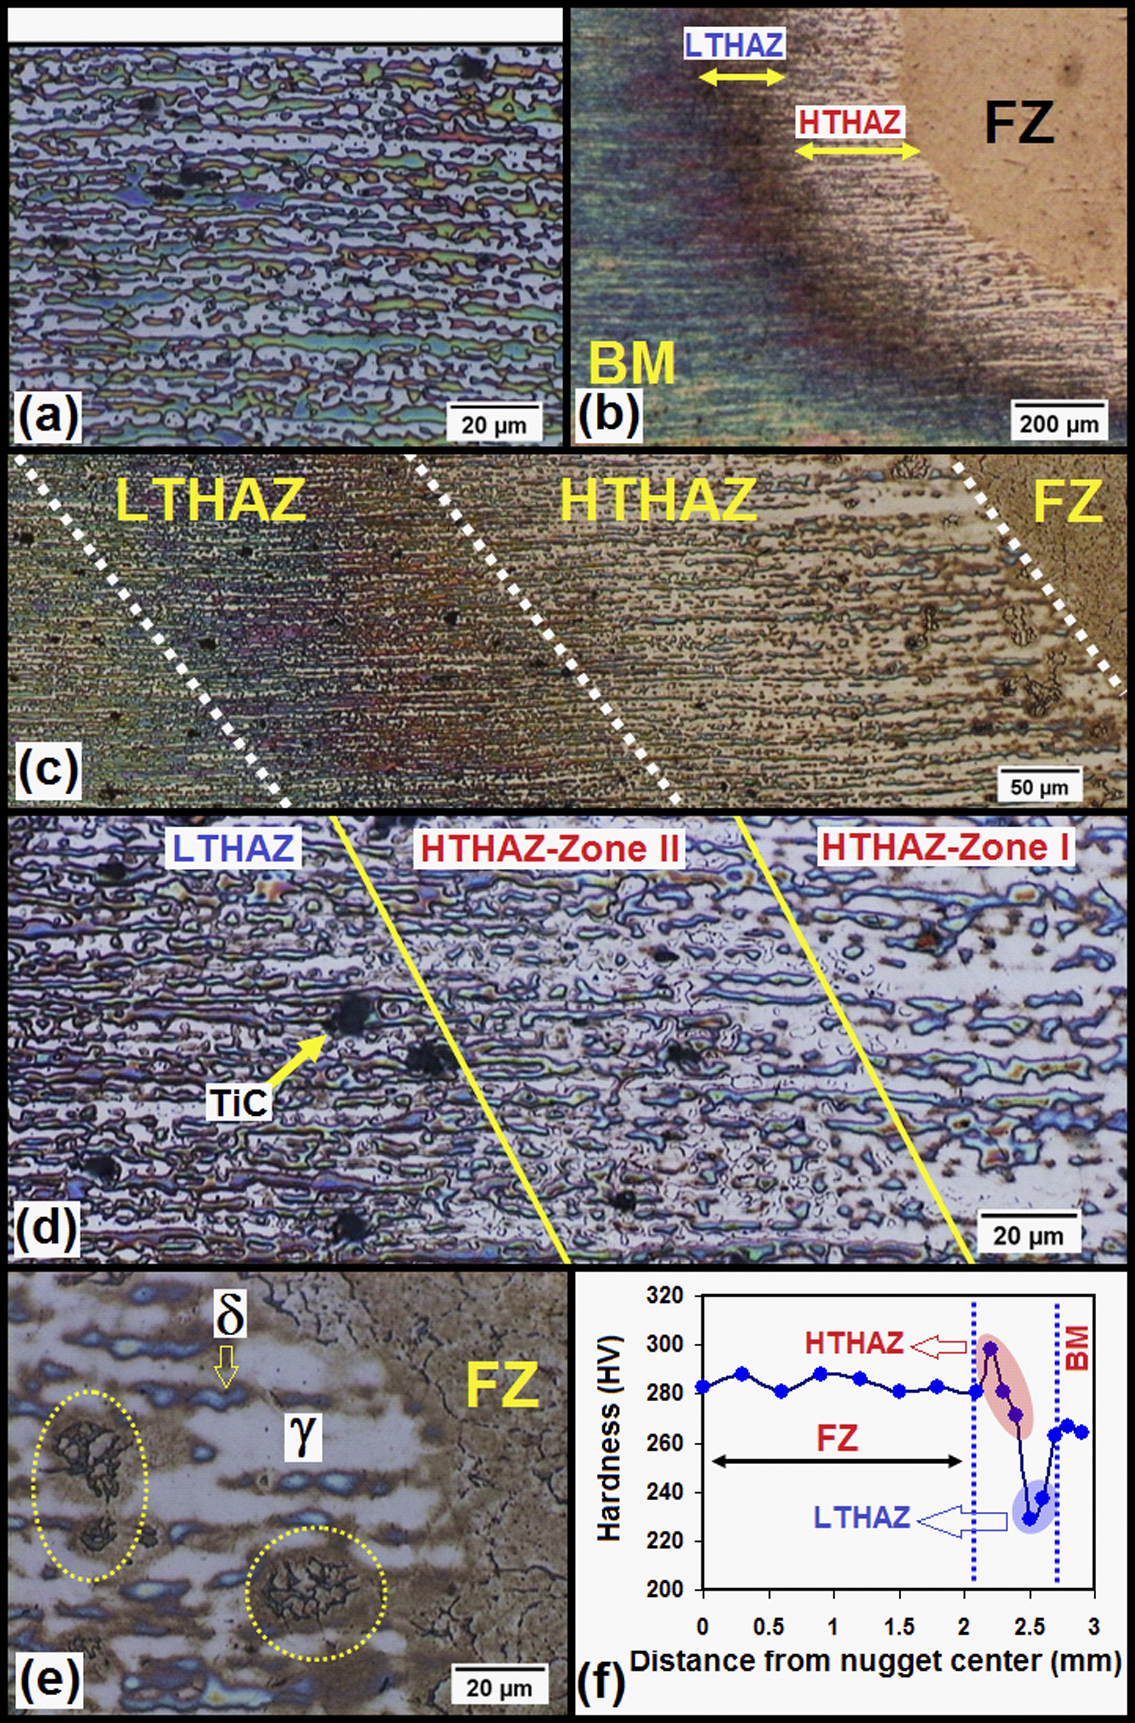
the martensite start temperature Ms (°C) can be predicated by following equation: a microstructure of base metal; b Fe–Cr–C phase diagram at 17 wt-%Cr; c microstructure gradient in HAZ; d large ferrite grains with extensive precipitates in HTHAZ; e martensite formation at ferrite grain boundaries in LTHAZ, arrows indicate martensite in ferrite grain boundaries; f hardness profile across weld
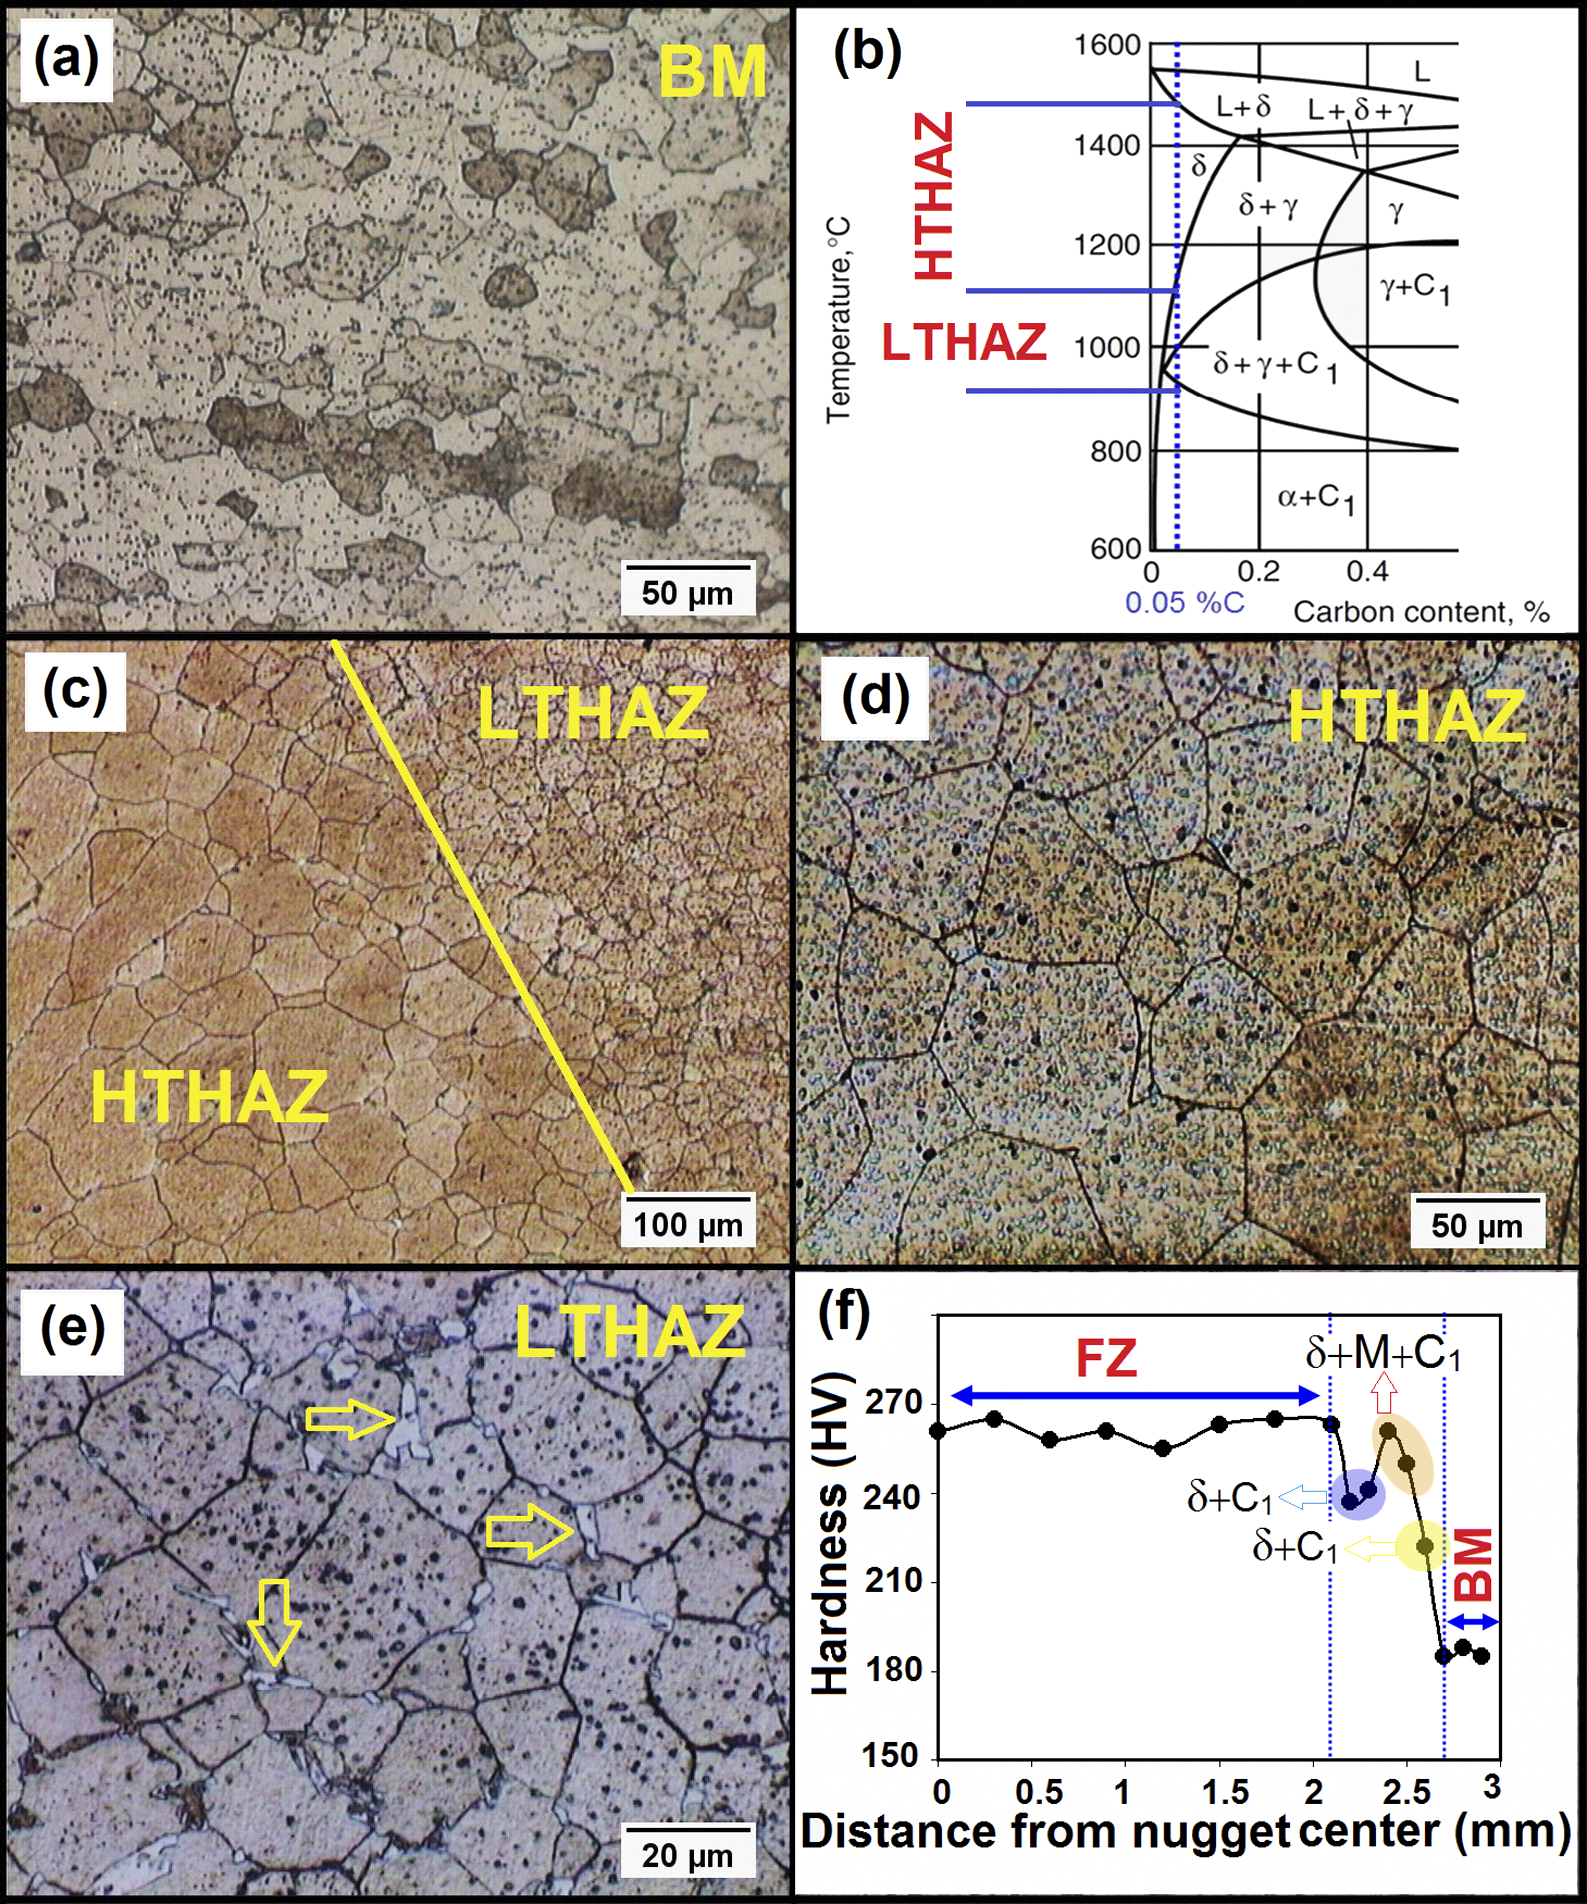
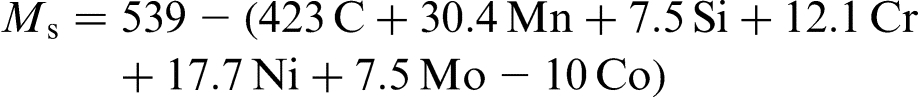
Figure 4f shows a typical hardness profile of FSS welds. The hardness of HAZ of FSS is influenced by ferrite grain size, carbide precipitation and martensite formation. The hardness of the HAZ in FSS is higher than that of the BM. Despite large grain size of ferrite, extensive carbide precipitation in HTHAZ produces a harder HTHAZ compared to the BM. The higher hardness of the LTHAZ compared to the HTHAZ is due to martensite formation in ferrite grain boundaries and its finer ferrite grain size. It is interesting to note that increasing welding current have no significant effect on the hardness characteristics of the AISI 430 HAZ.
Heat affected zone of DSS
Figure 5 a shows the optical micrograph of DSS BM indicating approximately balanced austenite and ferrite phases with some precipitates. According to the SEM energy dispersive spectroscopy analysis (Fig. 7b in Part I), 26 the dark particles are Ti rich carbides. The presence of Ti plays key role in phase balance of the BM. Titanium ties up carbon in the form of TiC to minimise the high potent of carbon in the austenite phase promotion and achieve a microstructure consisting of nominally 50% ferrite and 50% austenite in equilibrium condition. As it is discussed in the following, the presence of TiC in the BM significantly affects the phase transformation in the HAZ, as compared to Ti free DSSs grades (e.g. 2205).
a microstructure of base metal; b, c microstructure gradient in HAZ; d detailed microstructure of zones I and II of HTHAZ and LTHAZ; e liquidation pool in HTHAZ close to fusion zone; f hardness profile across weldment
Figure 5b shows the microstructure gradient in the HAZ of DSS welds. The HAZ width is very narrow (∼500 μm) due to low thermal conductivity of DSS, which produces high thermal gradient beside the FZ. According to Fig. 5c, the main metallurgical phenomenon in the HAZ is the deviation from balanced δ/γ ratio. Considering the phase balance, the HAZ can be divided into two distinct metallurgical transformation zones, as follows:
high temperature HAZ: this region exhibited a δ/γ volume fraction ratio < 1 (i.e. the volume fraction of austenite phase is >50%); the closer to the fusion boundary, the higher the volume fraction of austenite; the volume fraction of austenite phase varies between 78% (at FZ boundary) to 55% (at the end of this zone). low temperature HAZ: this region exhibited a δ/γ volume fraction ratio higher than 1 (i.e. the volume fraction of austenite phase is >50%); as approaching to the BM, volume fraction of ferrite phase changed from ∼68 to 50%.
It is interesting to note that the HAZ phase transformation of the investigated duplex steel is in contrast to the HAZ microstructure evolution of a standard DSS (Ti free grades) in which the HAZ has high δ/γ ratio beside the fusion boundary, and this ratio decreases by getting closer to the BM.
28
However, in the present study, the dominant phase next to the fusion line is austenite. This disagreement can be attributed to the presence of TiC in the initial microstructure of the BM.
The HAZ microstructure evolutions of the investigated BM (i.e. Ti bearing DSS) can be explained with the aid of weld thermal cycle, as shown in Fig. 6. According to Fig. 6, the microstructure evolution of the HAZ is governed by three phenomena: TiC dissolution upon heating, austenite–ferrite transformation upon heating and ferrite–austenite transformation on cooling. Considering these three factors, the phase transformation in HTHAZ and LTHAZ can be explained as follows:
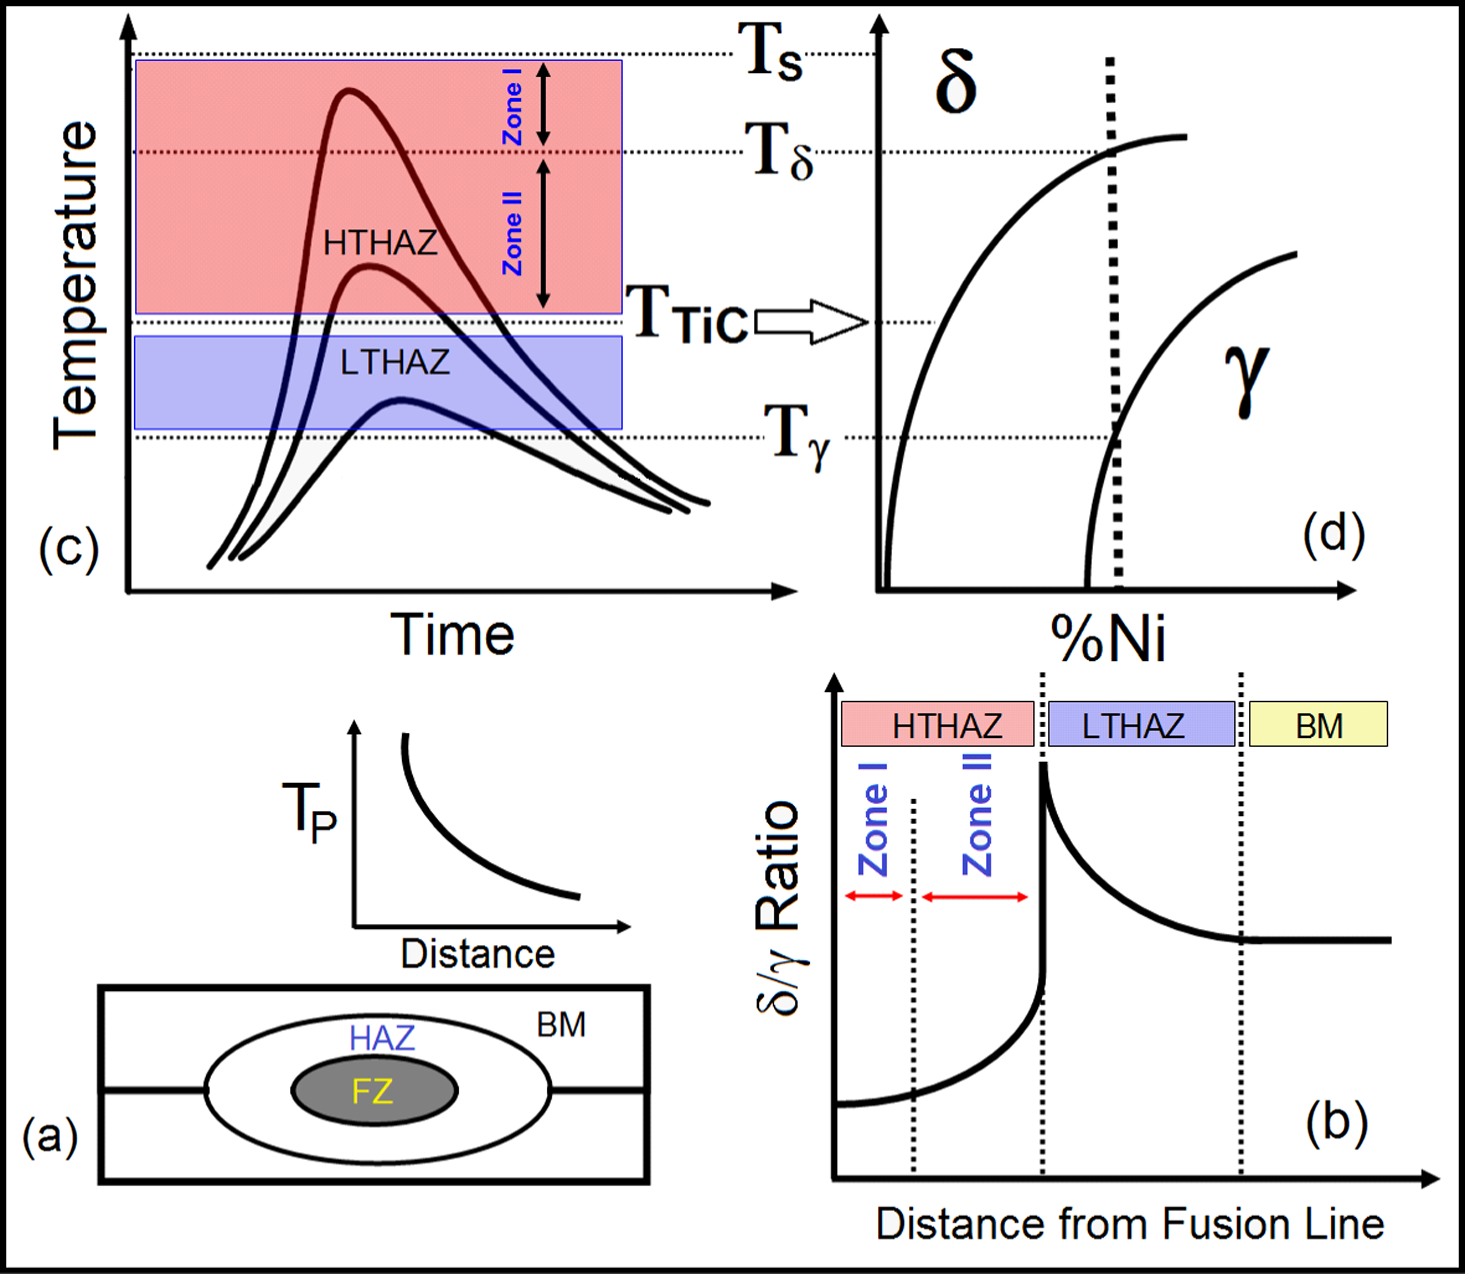
a peak temperature destribution in HAZ; b δ/γ phase ratio in HTHAZ and LTHAZ; c thermal cycle; d phase diagram
First, in HTHAZ, the material experiences a peak temperature between solvus temperature of TiC particles TTiC and solidus temperature of the BM TS (Fig. 6). The solidus of the DSS is ∼1450°C. 28 The solvus temperature of TiC is ∼1300°C, when its carbon content is ∼0.1 wt-%. 29 High temperature HAZ can be divided into two subzones: zone I, where the peak temperatures are between solidus temperature of the BM TS and δ-ferrite solvus temperature Tδ, and zone II, where the peak temperatures are between TTiC and Tδ.
Upon heating, in zone I, the TiC particles are dissolved. Despite the fact that the peak temperatures are higher than TTiC, due to rapid heating during RSW, TiC particles do not have enough time to dissolve completely in the matrix because solid state diffusion is slow. According to Fig. 5c, TiC particles are largely dissolved; however, some residual fine TiC particles are still present in the microstructure. In HTHAZ zone I, the material experiences complete transformation of γ → δ (complete ferritisation). The final phase balance is determined during δ → γ transformation in which the kinetics of the reaction depends on the chemical composition of the δ-ferrite. Dissolution of TiC in the matrix increases the carbon content of the δ-ferrite. Owing to the rapid cooling rate of the RSW process, the reprecipitation of TiC during cooling is prohibited. Carbon is a strong austenite stabiliser; 28 therefore, the presence of high carbon content significantly promotes the austenite formation upon cooling via nucleation and growth mechanism. This explains low δ/γ ratio at zone I of HTHAZ.
In HTHAZ zone II, due to partial transformation of γ to δ-ferrite, the reformation of austenite is dominated by the growth from existing austenite grains. Figure 5c and d shows the microstructure of HTHAZ zone II. There are boundaries in the austenite phase indicating that the primary austenite grains have not completely decomposed to δ-ferrite during heating and have grown upon cooling. It should be noted that dissolution of TiC also plays an important role in the promotion of austenite formation during cooling. However, due to lower peak temperatures, and the shorter dwell time above the effective temperature for TiC dissolution (see Fig. 6), the generation of free carbon atoms is reduced compared to zone I.
Second, in the LTHAZ, the material experiences a peak temperature between austenite solvus temperature Tγ and solvus temperature of TiC particles TTiC. Therefore, the material experiences partial dissolution of δ-ferrite. As can be seen in Fig. 5c and d, TiC particles are stable in this zone. Therefore, the chemical composition of δ-ferrite does not modify. In this condition, the rapid cooling of RSW process suppresses the δ → γ transformation and the volume fraction of δ-ferrite phase increases in this zone, as compared to the equilibrium state of the BM. As approaching the BM, the experienced cooling rates are decreased reducing the δ/γ ratio.
It is interesting to note that liquation occurred at HTHAZ close to the FZ. As can be seen in Fig. 5e, some solidified liquid weld pools are evident. It is believed that the liquation occurred because residual TiC reacts with δ-ferrite matrix at high temperature (i.e. constitutional liquation of TiC occurs).
Figure 5f shows a typical hardness profile of DSS resistance spot welds. The hardness of the HTHAZ is higher than that of the BM, while the hardness of the LTHAZ is lower than that of the BM. The HAZ hardness of the DSS spot welds is determined by the δ/γ ratio and the individual hardness of ferrite and austenite. In the present study, it is believed that the dissolution of TiC in HTHAZ increases the carbon concentration in the solution, which can strengthen both δ and γ via solid solution mechanism. The LTHAZ exhibited softening compared with the BM. It is reported that the ferrite is slightly harder than the austenite phase in wrought DSSs.31–33 However, the effect of thermal cycle on the dislocation density and thermal stresses generated during cooling due to difference in thermal expansion coefficient needs to be considered to explain the hardness variation of LTHAZ. Detailed microchemical and micromechanical (e.g. nanoindentation) studies are required to provide more insight regarding softening in LTHAZ.
Effect of welding current on weld nugget growth
Fusion zone size is the governing factor in determining the mechanical response and the fracture path of spot welds during mechanical loading.1, 9–15 Fusion zone size is controlled by heat generation and heat dissipation, which in turn are governed by the welding parameters and physical properties of the BM. 1 Figure 7 shows the effect of the welding current on the FZ size. Increasing welding current increases the FZ size due to enhanced heat generation. As can be seen, steel type affects the weld nugget growth. The minimum welding current required for the development of a weld with given nugget size decreased in the order of FSS, ASS and DSS welds. Generally, the higher electrical resistivity and lower thermal conductivity coupled with the lower melting temperatures of ASS and DSS stainless steels compared with FSS (see Table 1 of Part I) 26 contribute to the lower currents, which are necessary for the development of a weld nugget with a specific size.
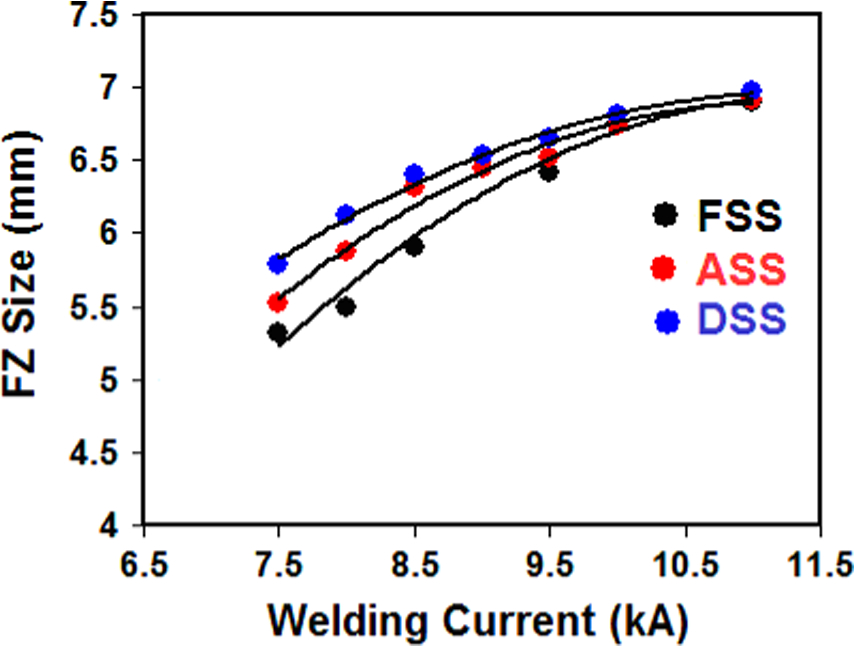
Effect of welding current on FZ size for FSS, ASS and DSS resistance spot welds
Failure mode of stainless steel resistance spot welds
After the tensile shear testing, the fracture surface of the welds was examined, and the failure mode of each joint was determined. The results are summarised, as follows.
First, all ASS welds failed in pullout or double PF mode (Fig. 8 a). According to Fig. 8b and c, PF location is at the FZ/HAZ interface. This can be attributed to the HAZ softening induced by grain growth (Fig. 3c), which can provide a preferential path for localised plastic deformation during the tensile shear test. According to Fig. 8d, the fracture surface is characterised by deep dimple indicating a ductile fracture. The elongated shape of the dimples is due to large nugget rotation during loading.
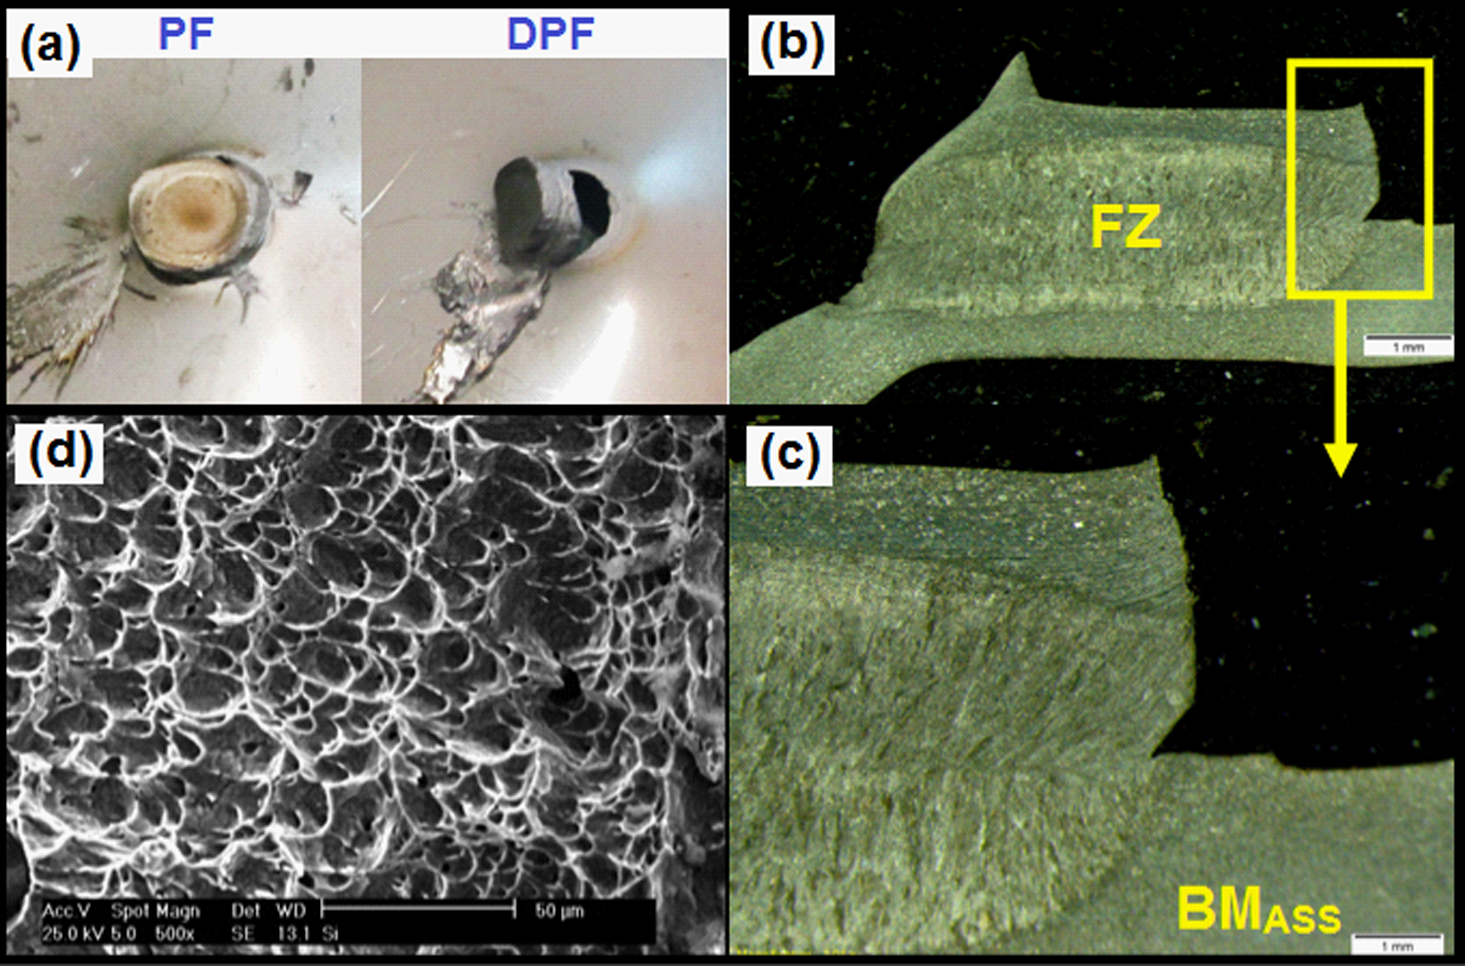
a typical failure mode including pullout failure (PF) and double pullout failure (DPF); b, c macrograph of fracture surface showing failure location during tensile shear testing; d SEM fracture surface morphology
Second, all FSS welds failed in double PF mode (Fig. 9 a). According to Fig. 9b, PF location is at the BM. This can be attributed to the low hardness of the BM rather than HAZ and FZ (Fig. 4f). The dimple type morphology of the fracture surface suggests that the fracture occurred under large plastic deformation.
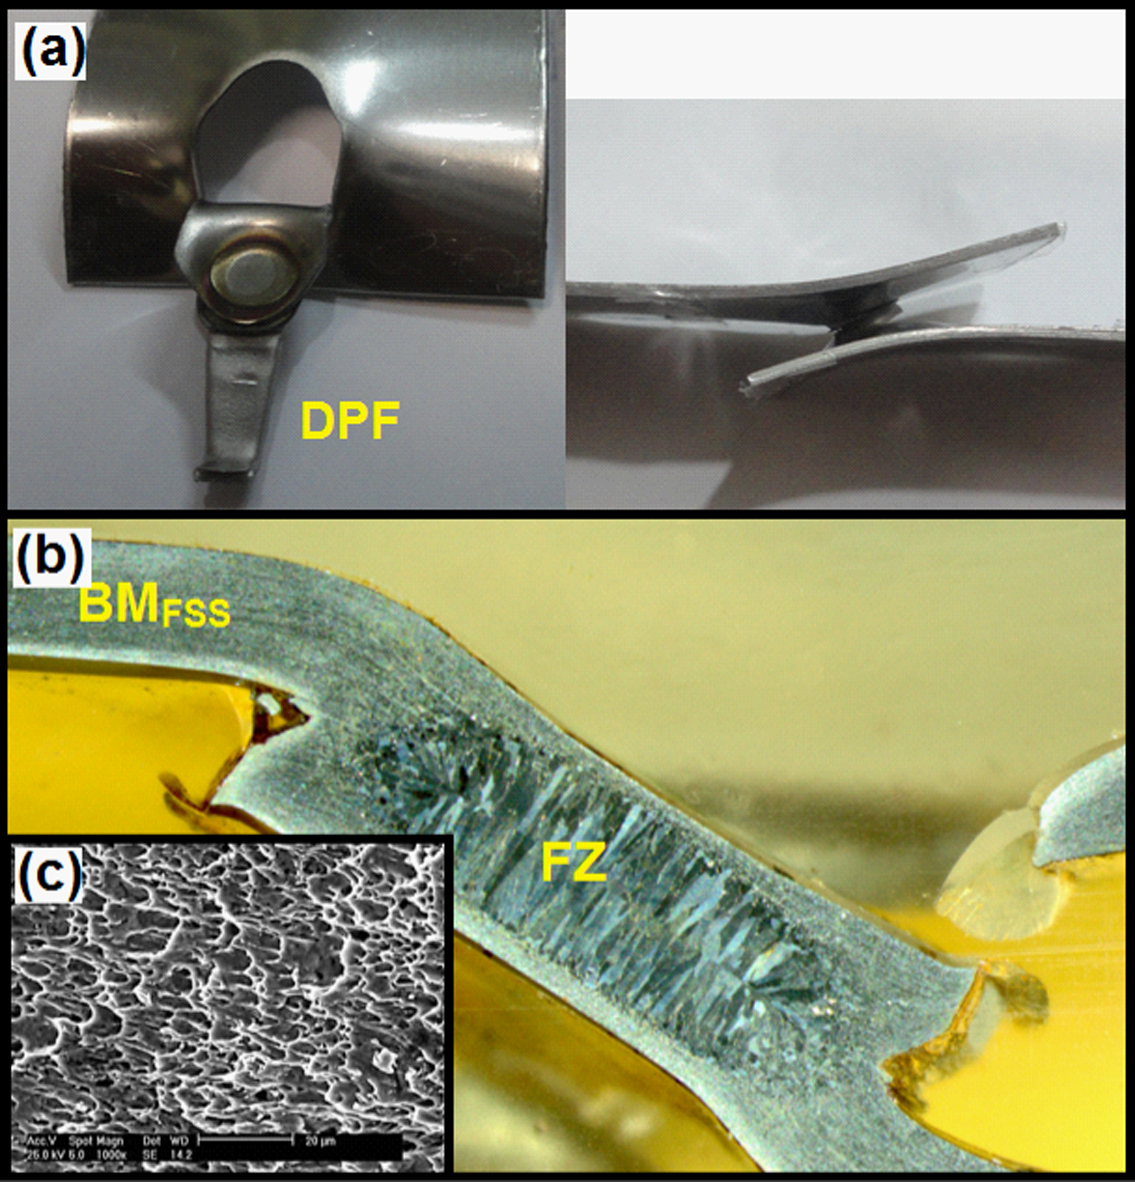
a typical double pullout failure mode (DPF); b macrograph of fracture surface showing failure location during tensile shear testing; c SEM fracture surface morphology
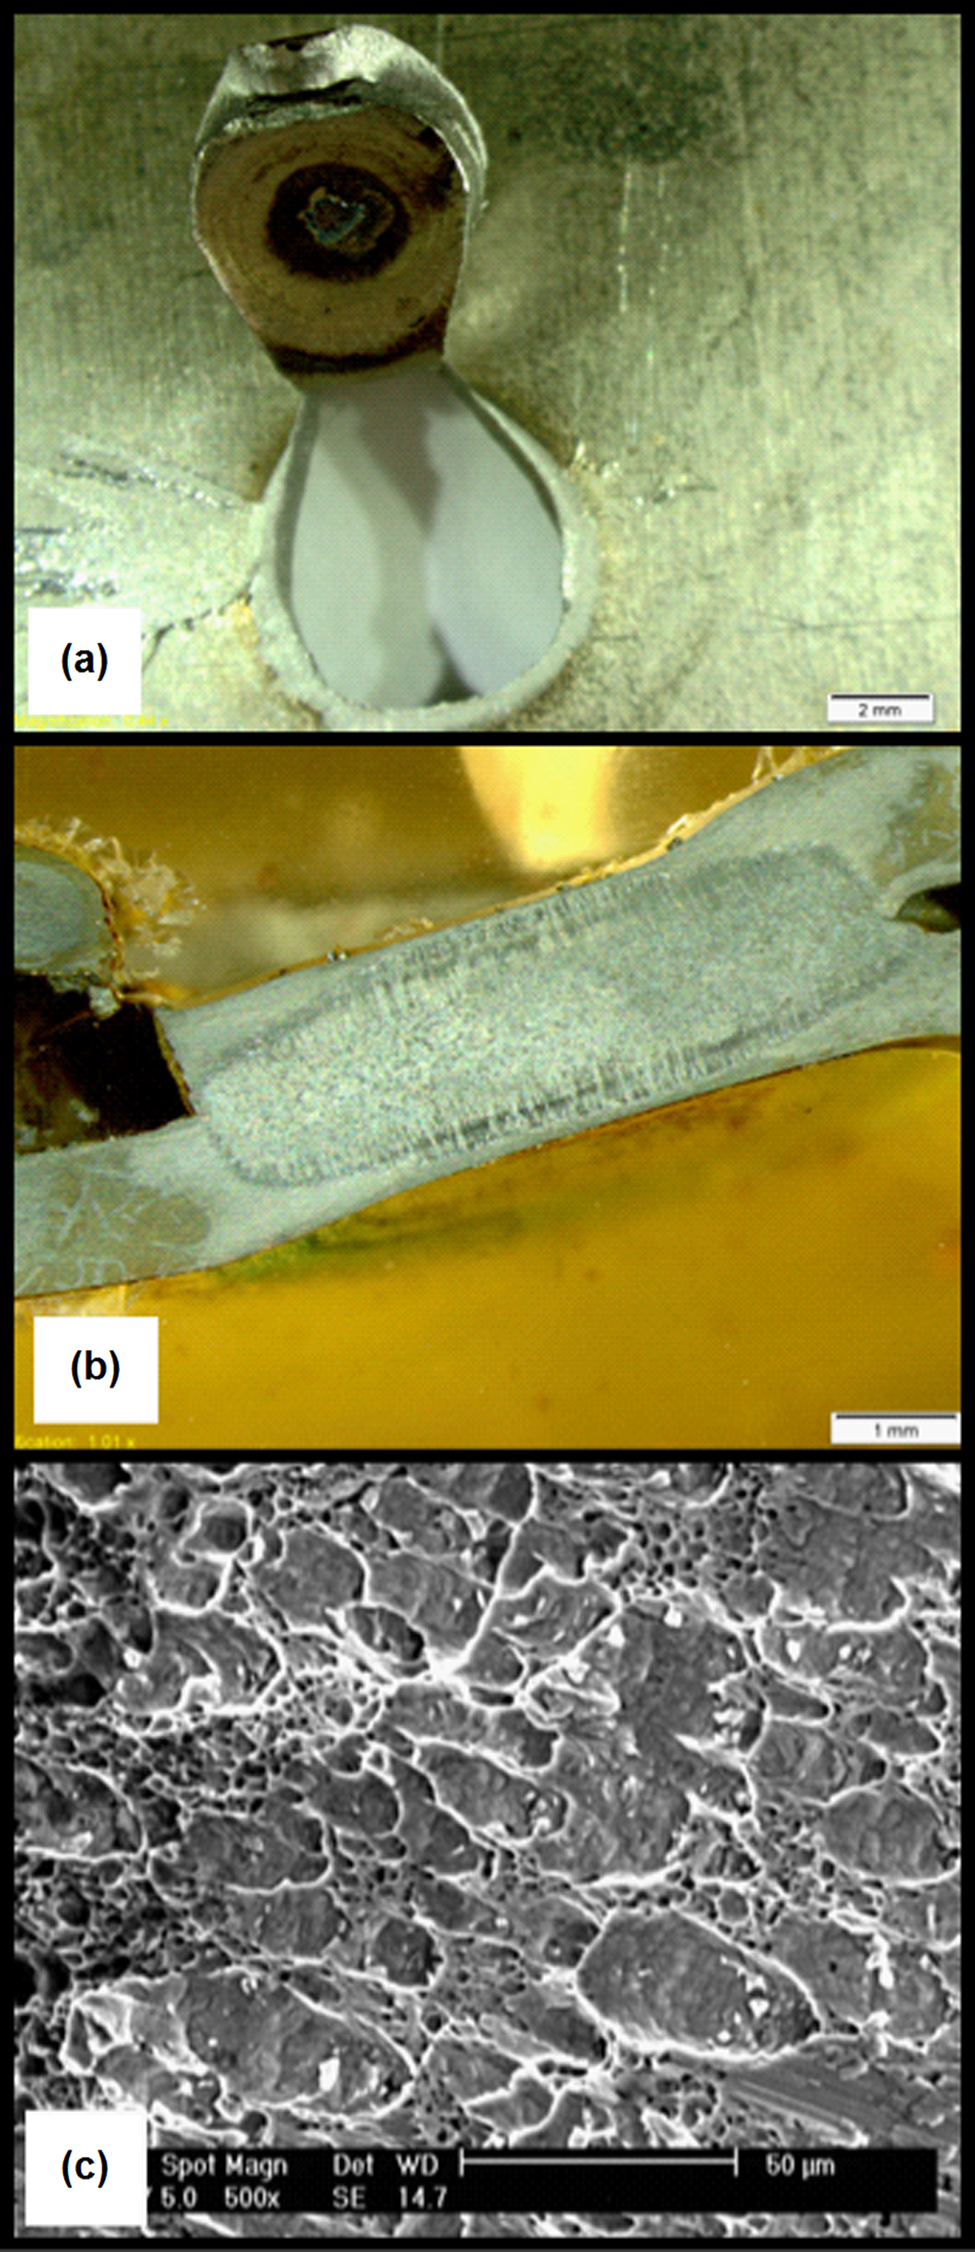
Third, two failure modes were observed in DSS welds: partial thickness–partial pullout mode (Fig. 10 a) and PF mode (Fig. 11 a). The transition in failure mode from PT-PP to PF was observed when the welding current increased beyond 9.5 kA. Figure 10b shows a typical macrograph of the weld failed at the PT-PP mode. Figure 10c shows the microstructure of fracture initiation site. According to Fig. 10b and c, in the PT-PP mode, first, the crack initiated from LTHAZ, where there is a softening compared with the BM; then during crack propagation around the circumference of the weld nugget, the crack path redirected through the FZ as slant crack resulting in some part of mating sheet thickness being removed upon final separation. By increasing welding current to 10 kA, failure mode was changed to pullout mode. Figure 11b shows a typical macrograph of DSS welds that failed at PF mode. Similar to the PT-PP mode, the PF is initiated from LTHAZ. According to Fig. 11c, the fracture surface is characterised by bimodal dimples indicating fracture from a two-phase area.
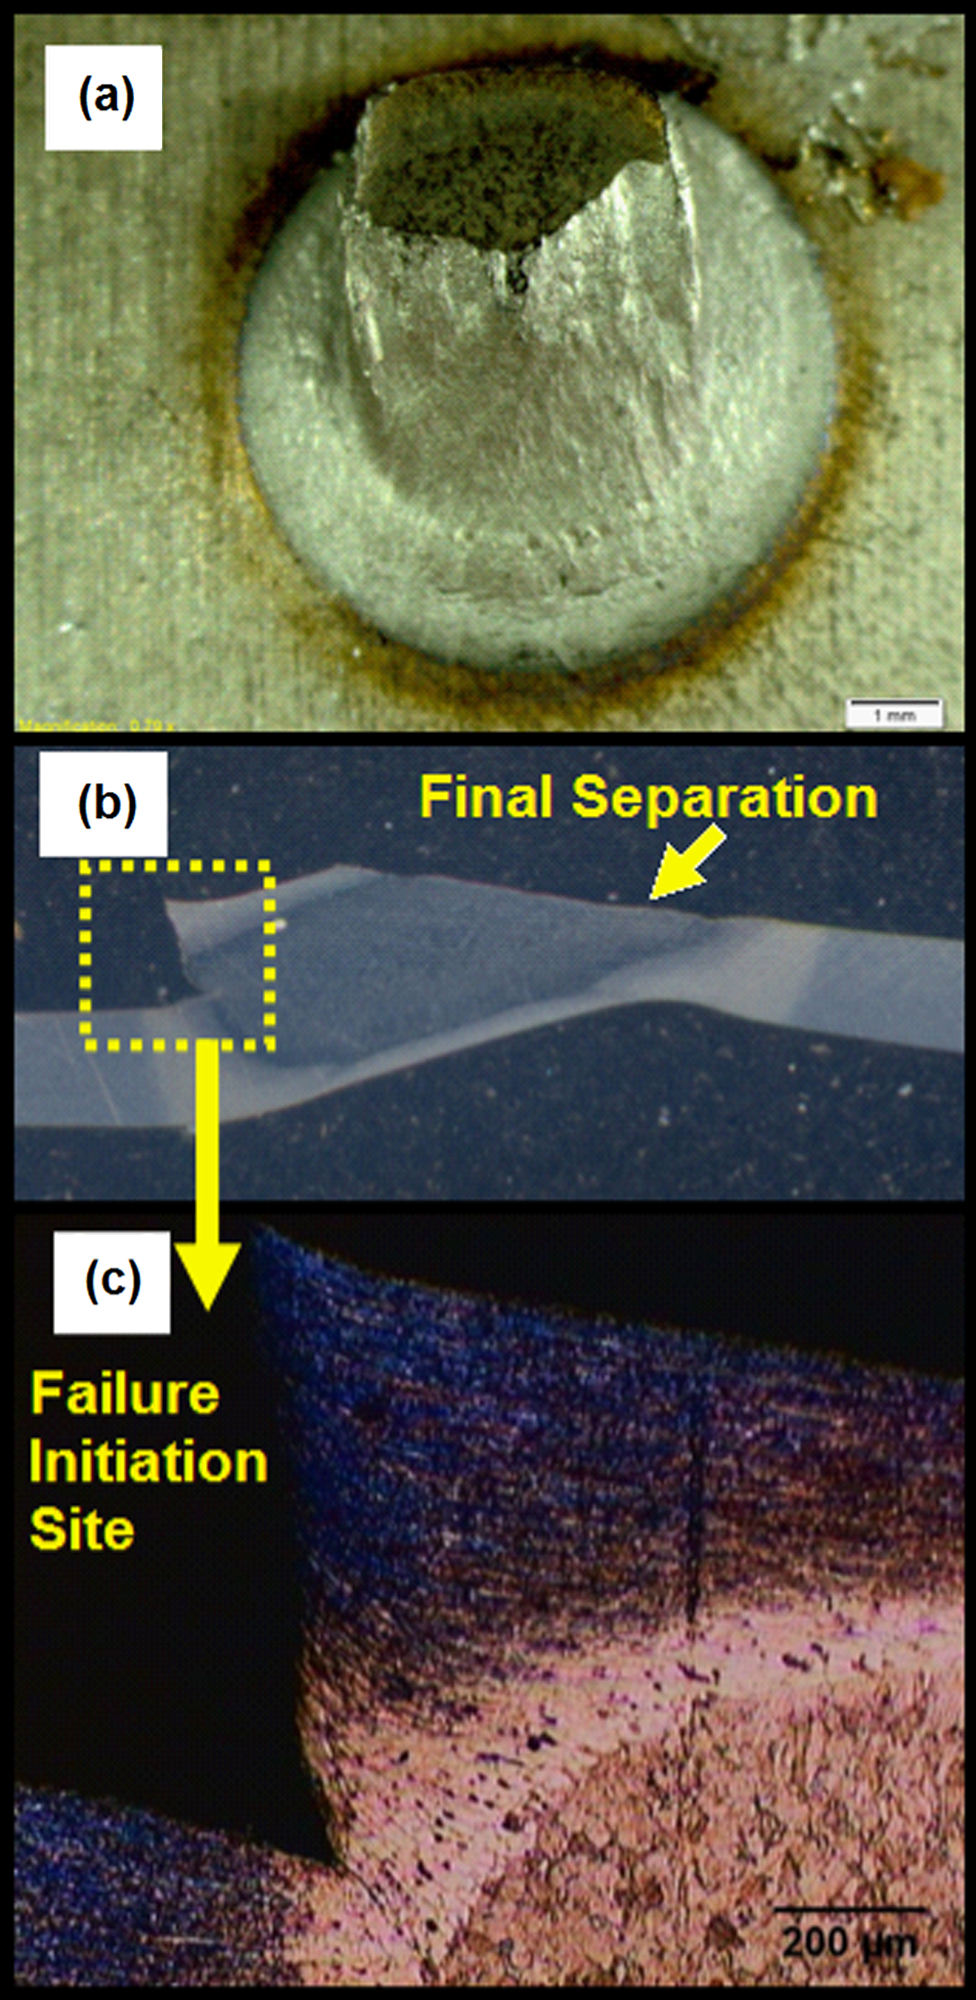
a typical fracture surface; b macrograph of fracture cross-section; c detailed microstructure of failure initiation site
a typical double pullout failure mode (DPF); b macrograph of fracture cross-section showing failure location during tensile shear testing; c SEM fracture surface morphology
It is interesting to note that no interfacial failure mode was observed during the tensile shear testing of ASSs, FSSs and DSSs welds.
Mechanical behaviour
Figure 12 shows the effect of FZ size on the peak load and energy absorption of stainless steels resistance spot welds. As can be seen, there is a direct correlation between FZ size and mechanical performance of the spot welds for all stainless steel types. For ASS, FSS and DSS welds that failed at PF mode, increasing FZ size, which increases the overall bonding area, reduces the tensile stresses imposed on the nugget circumference. This increases the resistance of the weld against through thickness localised plastic deformation leading to failure at higher loads and energies. For DSS welds that failed at PT-PP mode, increasing FZ size reduces the degree of nugget fracture of the weld. This contributes to the improved mechanical properties.
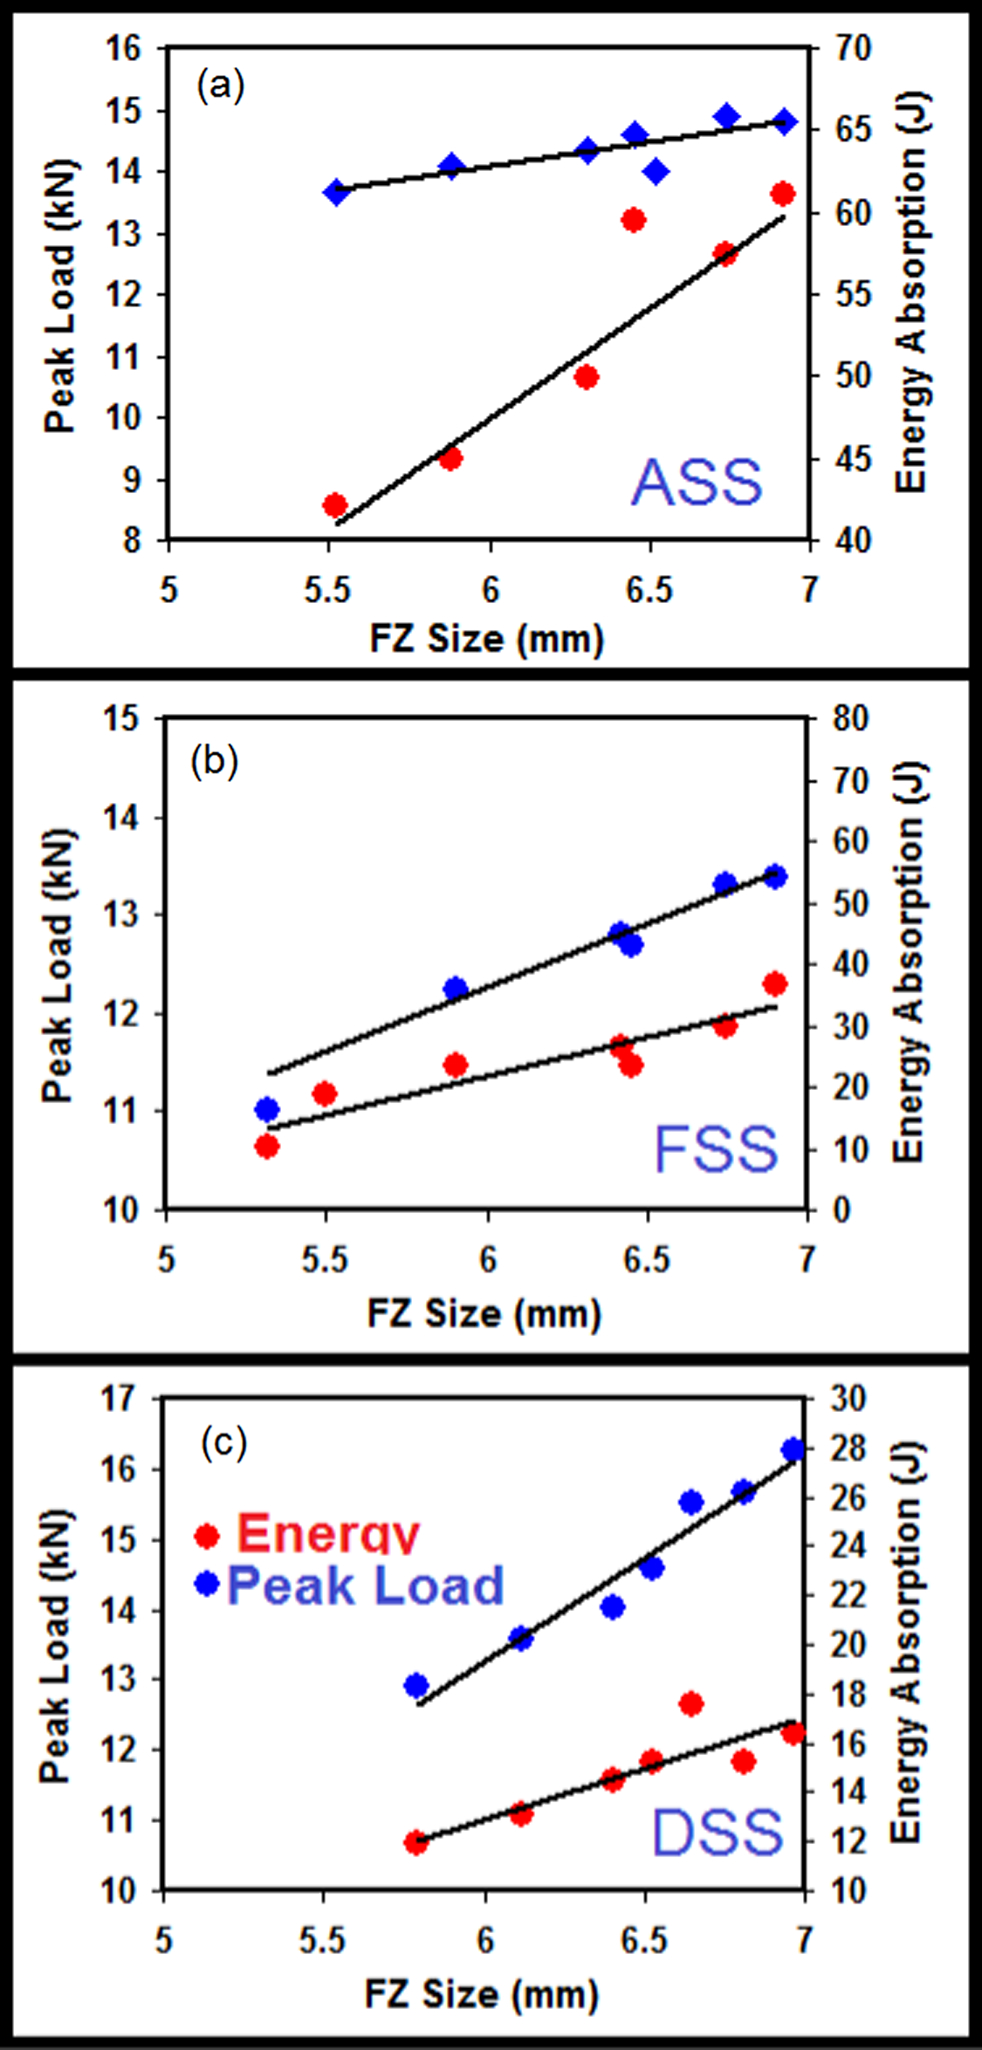
a ASS; b FSS; c DSS
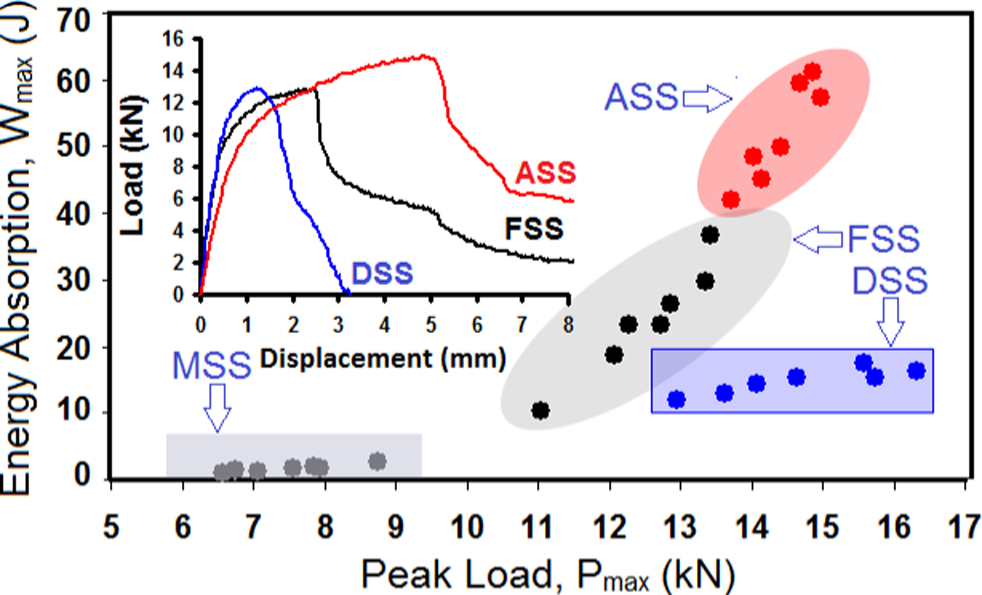
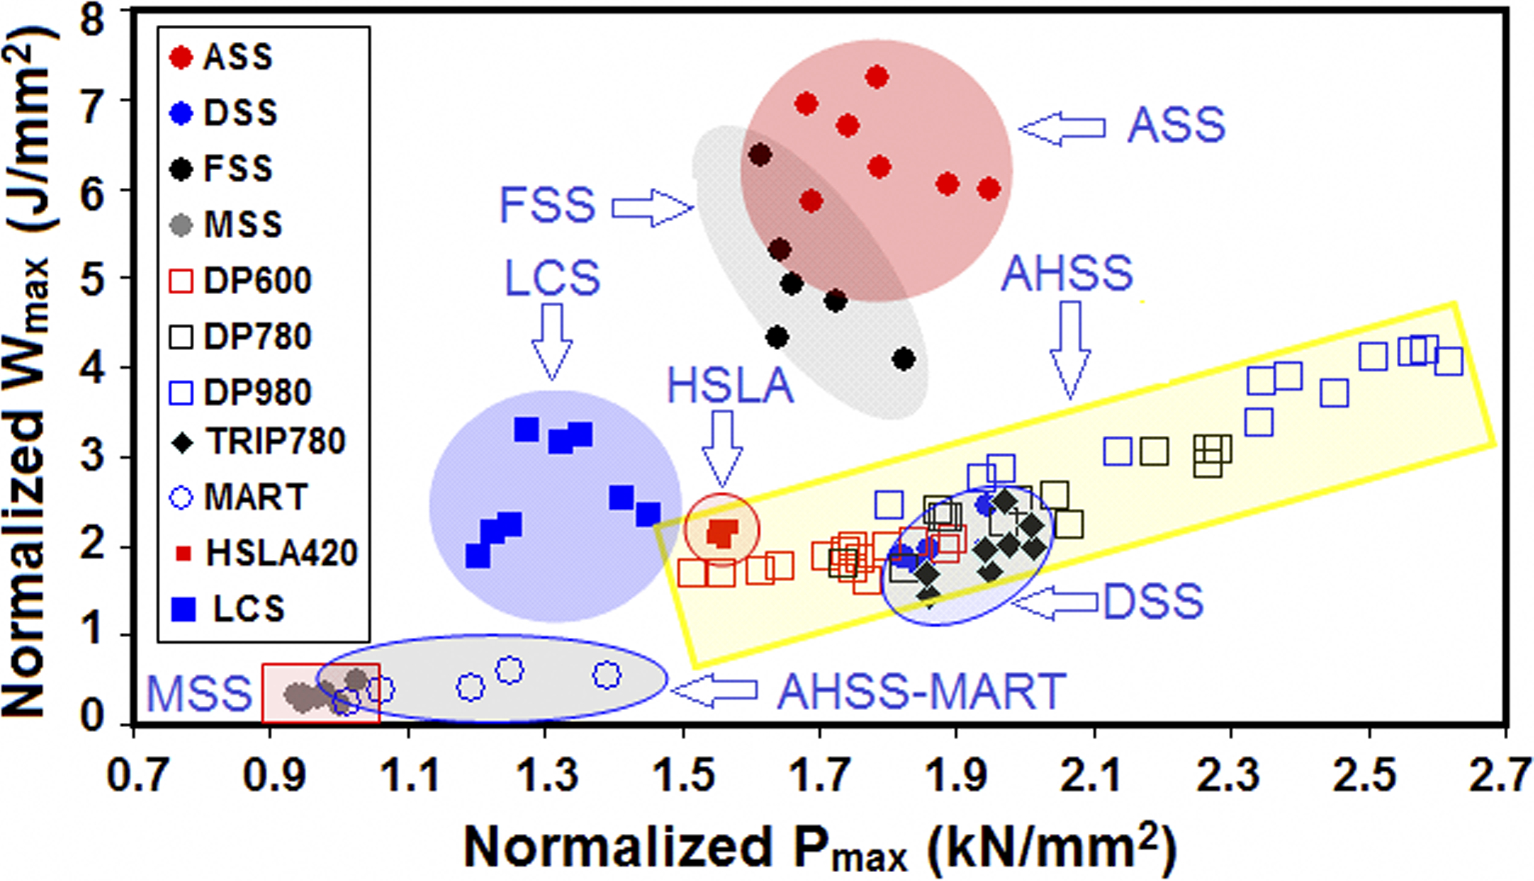
Figure 13 shows the energy capability versus load bearing capacity of stainless steels RSWs. The mechanical properties of a martensitic stainless steel from a previous work
17
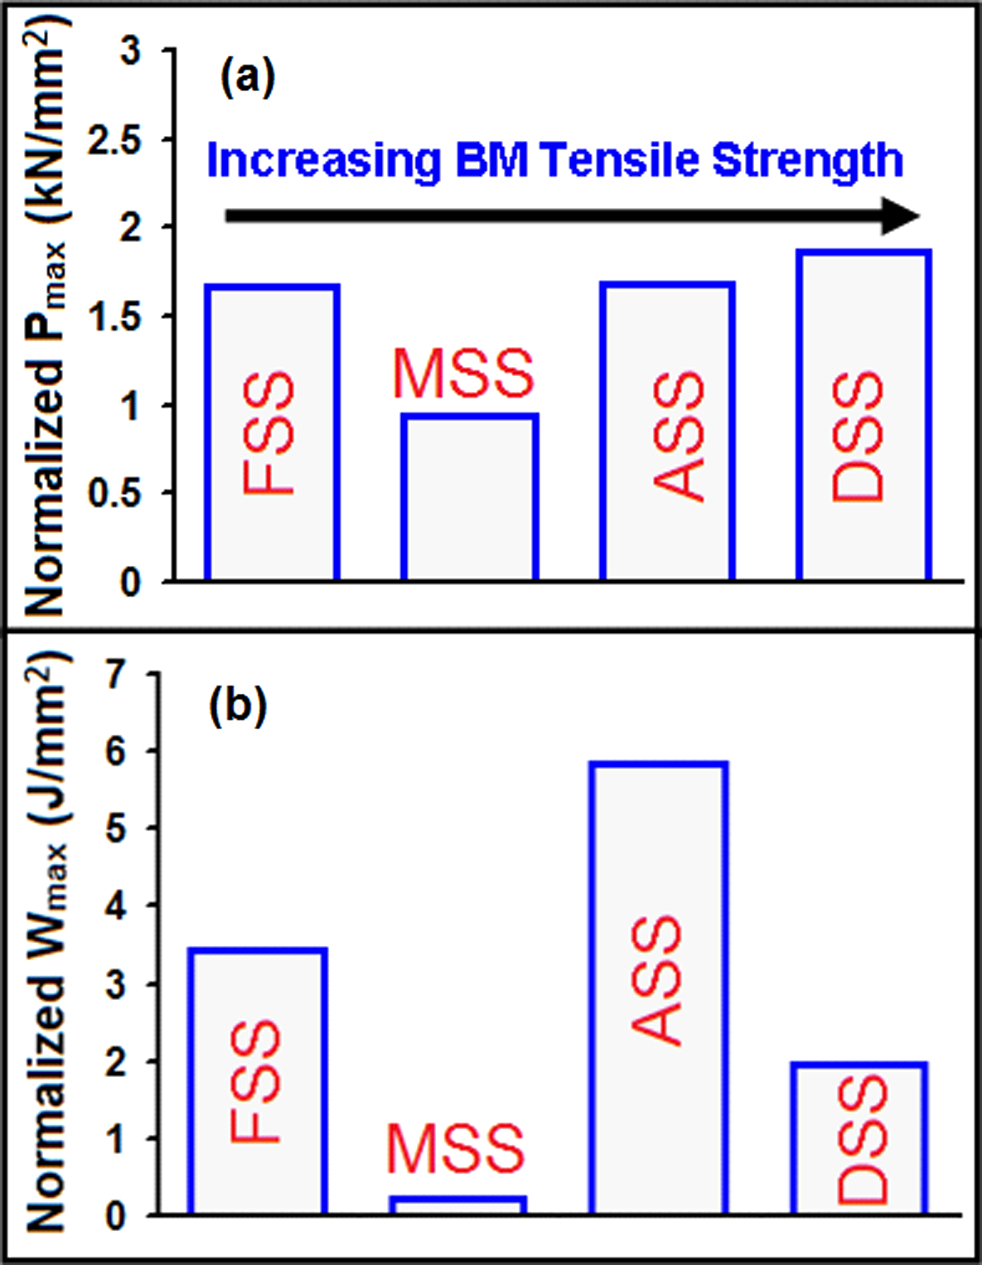
is also included. The inset of Fig. 13 shows the load–displacement characteristics of stainless steels. As can be seen, the ASS welds and MSS welds exhibited best and worst mechanical properties in terms of peak load and energy absorption respectively. To provide a better basis for comparison, the mechanical properties of welds with FZ size of 6t0.5 (i.e. ∼6.5 mm) are compared (Fig. 14). To account for the small differences in the FZ sizes and sheet thicknesses, the values of the peak load and failure energy were normalised by dividing the product of sheet thickness and FZ size. The following points can be extracted from Fig. 14:
as can be seen, there are no correlations between weld mechanical performance and tensile strength of the BMs. the weak mechanical properties of MSS welds can be attributed to high hardness of the FZ and HAZ, which encourages the cleavage failure at low load and low energy17. duplex stainless steel welds exhibited the highest peak load due to its highest PF location hardness; the hardness of LTHAZ of DSS is higher than both FSS base tensile strength and minimum HAZ hardness of ASS welds; despite the higher tensile strength of the ASS welds, their peak loads are comparable to ASS due to HAZ softening in the HAZ of ASS. austenitic stainless steel welds exhibited the highest energy absorption due to high strain hardening coefficient of the austenitic types; the deep dimples on the fracture surface of ASS welds indicate a ductile failure accompanied with large plastic deformation; despite the peak load of the DSS welds is higher than that of FSS welds, energy absorption of the former is lower than the latter. Energy absorptipn versus peak load of resistance spot welds of different types of stainless steels: inset shows load–displacement curves for ASS, FSS and DSS welds made at welding current of 9.5 kA; shape of tail of curves indicates that ASS and FSS failed at double pullout mode and DSS welds failed at partial thickness–partial pullout mode; data for martenistic stainless steel are from Ref. 17 a normalised peak load and b normalised energy absorptipn of resistance spot welds of different types of stainless steels; target FZ size is 6t0.5; data for martenistic stainless steel are from Ref. 17
To reach a more complete understanding of the mechanical performance of stainless steels resistance spot welds, it is necessary to further assess the failure mode and mechanical properties of the joints during fatigue and impact condition under various loading modes (i.e. tensile shear, cross-tension and peel loading).
Conclusions
Understanding phase transformations during RSW of stainless steels is a key in understanding of mechanical behaviour of the weldment. In this paper, the microstructure evolution mechanism of the HAZ of the stainless steels of austenitic, ferritic and DSSs during RSW are examined and analysed. The following conclusions can be drawn from this work:
The ASS exhibited grain growth in HAZ producing a soft region compared to the BM which served as a preferred fracture path during PF of the welds. The grain growth and martensite formation were main metallurgical features of the HAZ of FSS. The HTHAZ exhibited almost martensite free ferritic microstructure with excessive grain coarsening due to the absence of the elevated temperature austenite to pin the grain boundaries. The LTHAZ, which exhibited the highest hardness in the HAZ of FSS, shows ferrite–martensite dual phase microstructure with limited grain growth. The BM remained the softest region in the weldment, which served as a preferred fracture path during PF of the welds. The ferrite/austenite unbalance was the main feature of the HAZ of the DSS. It was affected by both the presence of TiC in the initial microstructure of DSS and rapid cooling rate of RSW process. In the HTHAZ, which exhibited the highest hardness in the weldment, the dissolution of TiC increases the carbon content of the δ-ferrite and hence promotes the austenite reformation during δ → γ transformation. In LTHAZ, which exhibited some degree of softening, rapid cooling rate suppresses the solid state ferrite–austenite transformation during cooling producing high δ/γ ratio. For all investigated steels, the FZ size at sheet/sheet interface is the key macrostructural feature controlling the load bearing capacity and energy absorption capability of spot welds. It was shown that there is no correlation between tensile strength of the BM and mechanical properties of the welds. The hardness characteristics and failure mode of the welds affect the mechanical properties of the joints.