
Abstract
The corrosion inhibition of A3 steel by an imidazoline derivative in 2%NaCl solution (pH 4·0-6·9) was investigated using weight loss method, potentiodynamic polarisation, electrochemical impedance spectroscopy and scanning electron microscopy (SEM) observations. It is suggested that the imidazoline derivative acts as an anodic type inhibitor, suppressing the charge transfer process by adsorption on the steel surface. The inhibition efficiency (IE) at pH 4·9 increases with the imidazoline derivative concentration in the range of 50-250 mg L−1. Meanwhile, the IE for A3 steel in neutral solution is better than that in acidic solution. During a long time immersion, the IE increases first with the increasing immersion time. Although it decreases a little with further time extension, good inhibition performances are observed.
Introduction
Low carbon steel is widely applied as the constructional material in many industries due to its excellent mechanical properties and low cost. As some of the important fields of application are acid pickling, industrial cleaning, acid descaling, oil and gas production and transportation systems, the main problem of applying low carbon steel is its corrosion in acidic solutions. It was reported that the majority of the oil and gas pipeline failures result from their corrosion,1,2 causing significant economic loss.3 – 6
Several methods are present for corrosion prevention. The use of chemical inhibitors has been acknowledged as the most economical and practical method for combating corrosion.7,8 The inhibitor molecule retards the corrosion rate by acting at the metal/corrosive medium interface. In the past few years, the inhibition of low carbon steel corrosion in acid solutions by various types of organic inhibitors has attracted more attention. Nitrogen based organic surfactants, such as imidazolines and its derivatives, have been used successfully as inhibitor in combating the corrosion of low carbon steel because of their advantages, such as high inhibition efficiency (IE), low toxicity and easy production.9 – 16 Despite their extensive use, the inhibition mechanism of imidazoline derivatives in acid solution remains poorly understood.
In this case, an imidazoline derivative was synthesised. The effectiveness of the imidazoline derivative for A3 steel (a low carbon steel) against corrosion in acid 2·0%NaCl solution was characterised through weight loss method, polarisation curve and electrochemical impedance spectroscopy (EIS). The adsorption of the imidazoline derivative on the A3 steel surface was observed by a K-Alpha 1063 X-ray photoelectron spectroscope (XPS; Thermo Fisher Scientific, UK), and its inhibition mechanism was analysed. Meanwhile, the IE at different pH values was studied.
Experimental
Materials and medium
The test material for this study was as received A3 steel. For the tests, the sample surfaces were abraded with a series of silicon carbide papers, rinsed with double distilled water, cleansed with ethanol and then air dried with blower. The imidazoline derivative used as inhibitor was synthesised according to the following step. Some xylenes, of which the volume was 30% of the total reagent volume, were mixed with 0·1 mol oleic acid and 0·12 mol diethylenetriamine. The reaction mixtures were stirred and heated at temperature of ∼160°C for 4-5 h and at 230°C for 4-6 h; then, the remaining xylene was removed through vacuum distillation at 120°C. After the temperature was lowered to room temperature, the imidazoline intermediate was obtained. Then, the imidazoline intermediate was mixed with 12·6 g quaternisation reagent benzyl chloride, and the reaction temperature was controlled at 130-140°C for 4 h. The imidazoline derivative with tan colour was synthesised after the temperature was lowered to room temperature. Its structure is shown in Fig. 1. The test medium was 2%NaCl solution (wt-%) containing the imidazoline derivative with different concentrations; HCl or NaHCO3 was added to adjust its pH in the range of 4·0-6·9.
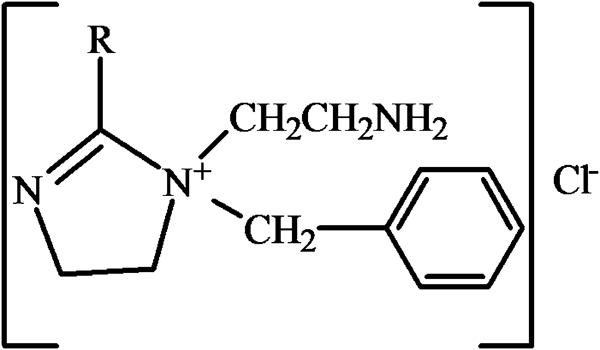
Molecular structure of imidazoline derivative
All the experiments were carried out at 293±1 K. For each experimental condition, two to three measurements were performed to estimate the repeatability. The repeatability was quite good, and the changes observed in the results reflect the influences of various parameters beyond the experimental error.
Corrosion weight loss measurement
Weight loss measurements were carried out using A3 steel specimens with surface area of 13·0 cm2. After 192 h (8 days) of immersion in 2·0%NaCl solution without and with inhibitors, the specimens were cleaned in descaling liquid, rinsed with double distilled water and then air dried with blower. Then, their weights were measured. The corrosion rates V and IE, derived from the weight loss method, were calculated using equations (1) and (2)11
Electrochemical measurement
The electrochemical measurements were performed using a CHI660C Electrochemical Workstation. The A3 steel specimen with an exposing surface area of 1 cm2 was used as working electrode, a platinum foil served as counter electrode and a saturated calomel electrode (SCE) with a Luggin capillary served as reference electrode respectively. All the measured potentials were referred to the SCE. After 45 min immersion in 2·0%NaCl solution with and without inhibitor, the polarisation curves and EIS of the A3 steel specimen were measured respectively. The polarisation curves were recorded at a scanning rate of 1 mV s−1. The EIS was measured in the frequency range from 100 kHz to 10 mHz with a perturbation amplitude of 5 mV at the open circuit potential and fitted through a Z-view program.
Surface analysis
After immersion in 2·0%NaCl solution with and without inhibitors, the corrosion rust was removed, and the corrosion morphologies were observed using a Quanta-200 SEM. The adsorption of the inhibitor on the steel surface was detected through XPS. The samples were immersed in the test solutions for 14 h and then taken out and dried with cool air for XPS measurement. The XPS detection was carried out with a K-Alpha 1063 spectrometer (Thermo Fisher Scientific, UK) using Al Kα radiation as excitation sources. A take off angle of 45° from the surface was employed. All the analyses were performed at a pressure lower than 1×10⁻⁸ torr.
Results and discussion
Corrosion resistance dependence on inhibitor concentration
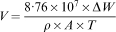
The surface morphologies of the A3 steel specimens after 72 h of immersion in 2%NaCl solution (pH 4·9) in the absence and presence of inhibitors are presented in Fig. 2. The sample in the absence of inhibitor (Fig. 2a) is strongly attacked, and the rough surface is featured with general corrosion and lots of pits. In the presence of inhibitors (Fig. 2b and c), the specimen surfaces are well protected, smaller and less pits are observed and scratches on the surface induced by the emery paper are almost the same as those on the freshly polished surface. It seems that the pit density is decreased with the inhibitor concentration.
a without inhibitor; b with 100 mg L−1 inhibitor; c with 150 mg L−1 inhibitor
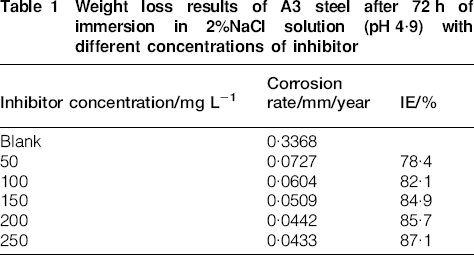
The corrosion rate (mm/year) and IE evaluated according to the weight loss method after 72 h of immersion in 2%NaCl solution (pH 4·9) with various inhibitor concentrations are summarised in Table 1. As a small amount of inhibitor (50 mg L−1) is added, the corrosion rate of A3 steel is greatly decreased, and the IE increases with increasing inhibitor concentration. All the inhibition efficiencies have high values at each concentration, indicating a good inhibition performance for A3 steel corrosion in 2%NaCl solution. The maximum value of IE reaches 87·1% at the inhibitor concentration of 250 mg L−1.
Weight loss results of A3 steel after 72 h of immersion in 2%NaCl solution (pH 4·9) with different concentrations of inhibitor
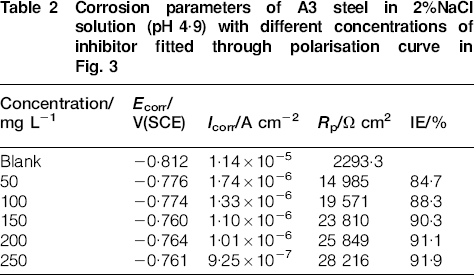
The IE is also evaluated through electrochemical methods. The polarisation curves of A3 steel in 2%NaCl solution (pH 4·9) with different inhibitor concentrations are shown in Fig. 3. The fitted corrosion parameters such as corrosion potential E corr, polarisation resistance R p and corrosion current density I corr are listed in Table 2. From the fitted values of I corr, the IEs for the corrosion of A3 steel are calculated according to the following equation
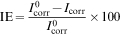
 and I corr are the uninhibited and inhibited corrosion current densities respectively. The calculated IE is also presented in Table 2. It can be seen that the corrosion current density I corr decreases greatly as the inhibitor is added into the NaCl solution, and the current density decreases with increasing inhibitor concentration. The IE calculated from I corr therefore increases with the inhibitor concentration. The IE value at each concentration is extremely high and reaches 91·9% at the highest inhibitor concentration of 250 mg L−1.
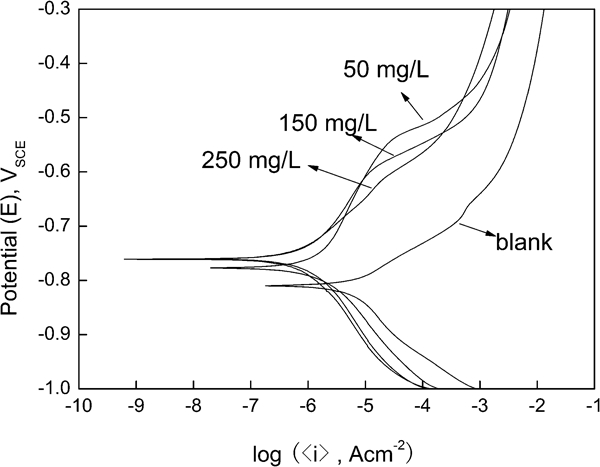
Polarisation curves of A3 steel in 2%NaCl solution (pH 4·9) with different concentrations of inhibitor
Corrosion parameters of A3 steel in 2%NaCl solution (pH 4·9) with different concentrations of inhibitor fitted through polarisation curve in Fig. 3
On introduction of the inhibitor, three distinct features are observed in the polarisation curves (Fig. 3). First, the corrosion potential moves to a little more positive region, and the shift is dependent on the inhibitor concentration. The positive shift in the corrosion potential indicates that the inhibitor for this system is probably due to the active site blocking effect.17 Second, both cathodic and anodic current densities are decreased over a wide potential range, indicating that both the anodic process and the cathodic process are hindered. However, the anodic suppression plays a dominant role in this process, and the corrosion process in the presence of the inhibitor is under anodic control. It confirms that the imidazoline derivative acts as an anodic type corrosion inhibitor. Further, all the cathodic Tafel curves are almost parallel with each other, which indicates that the cathodic reduction mechanism is not affected by the presence of the inhibitor, and the corrosion processes are controlled just by restraining the rates of the reactions.
Figure 4 shows the typical Nyquist plots of A3 steel after 45 min of immersion in 2%NaCl solution (pH 4·9) with different inhibitor concentrations. The impedance response of A3 steel is significantly changed after the addition of inhibitor. Without inhibitor, there appear a capacitive arc in the high frequency range and an inductive loop in the low frequency range respectively. The appearance of the inductive loop in the low frequency range is attributed to the adsorption of an intermediate product during the corrosion reaction. This is consistent with the proposed involvement of adsorbed intermediates in the anodic dissolution of iron in acidic solution by Bockris et al.18 After the addition of the inhibitor, the inductive loop disappears, and the capacitive arc diameter increases with the inhibitor concentration, which indicates that the charge transfer resistance increases.
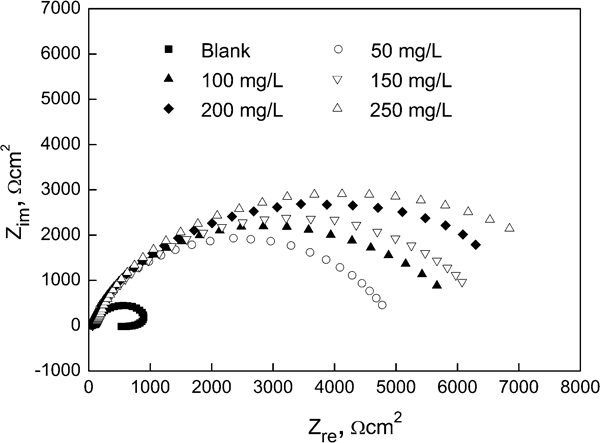
Nyquist diagrams of A3 steel in 2%NaCl solution (pH 4·9) with different concentrations of inhibitor
The impedance data could be interpreted using the equivalent circuit shown in Fig. 5. R s is the solution resistance, R ct is the charge transfer resistance and R f is the resistance of the film formed on the A3 steel surface. The constant phase element CPE2 is composed of the film capacitance C f and the deviation parameter n 2, and the capacitance C f is mainly due to the dielectric nature of the surface film (corrosion products and/or inhibitor film). The CPE1 is composed of the double layer capacitance C dl and the deviation parameter n 1. The CPE is defined in impedance representation as Z(ω) = Z 0(jω)−n, where Z 0 is the CPE constant, ω is the angular frequency (in rad s−1), j 2 = −1 is the imaginary number and n is the deviation parameter.19
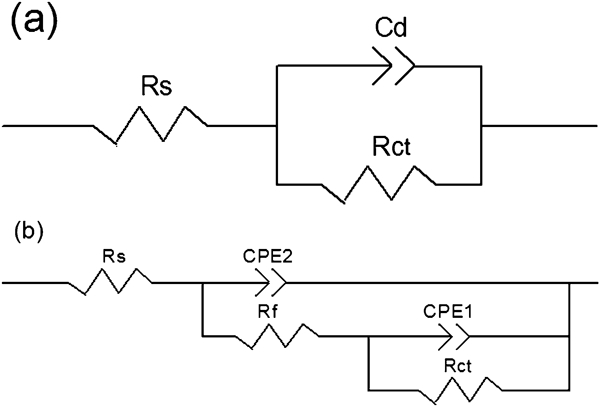
a without inhibitor; b with inhibitor
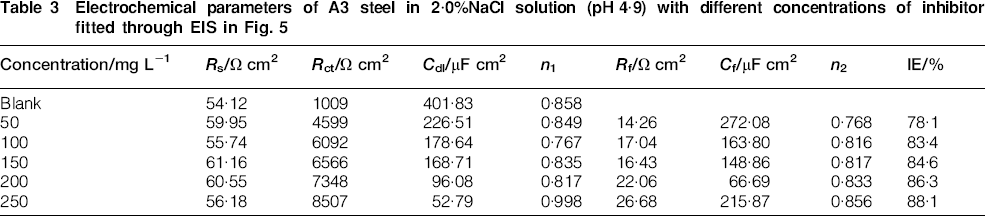
The electrochemical parameters fitted from the impedance data are given in Table 3. The film resistance R f is increased with the inhibitor concentration, whereas C f exhibits a decreasing tendency in the presence of the inhibitor. According to the Helmholtz model, C is expressed as C = (ϵ 0 ϵ/d)A, where d is the thickness of the protective film, A is the electrode surface area, ϵ 0 is the vacuum permittivity and ϵ is the local dielectric constant. 20 20,21 The decrease in C f can be interpreted as either the decrease in the adsorption film area or the increase in the protective film thickness. This therefore implies that a protective adsorption film of the imidazoline derivative is well formed on the steel/solution interface, and its thickness is gradually increased. Meanwhile, the addition of imidazoline derivative increases R ct, and this effect seems to be enhanced by increasing the inhibitor concentration, while C dl tends to decrease. It reveals that the charge transfer process, which is the control step of the corrosion, is effectively inhibited by the addition of the inhibitor.
Electrochemical parameters of A3 steel in 2·0%NaCl solution (pH 4·9) with different concentrations of inhibitor fitted through EIS in Fig. 5
The IE can be calculated from the fitted EIS parameters according to following equation (4)
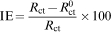
 and R ct are the fitted charge transfer resistance values without and with inhibitor respectively. The IE calculated from R ct also increases with the inhibitor concentration and reaches the maximum 88·1% at the highest inhibitor concentration of 250 mg L−1 (Table 3). The IE trend obtained from the EIS measurements (Table 3) is in agreement with those obtained from the polarisation measurements and weight loss method.
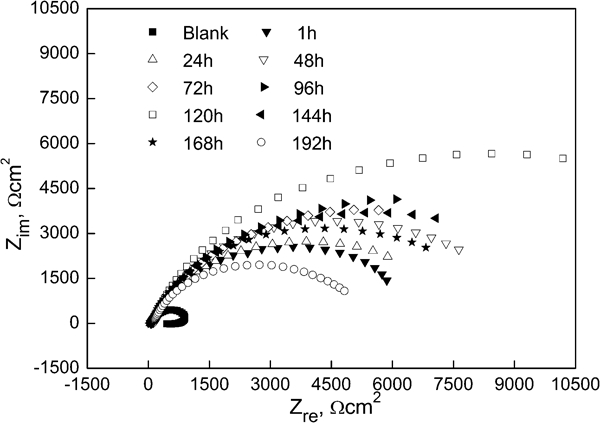
After 14 h of immersion in the 2%NaCl solution (pH 4·9) in the absence and presence of the inhibitor, the XPS spectra of the samples are shown in Fig. 6a, which can provide more detailed information about the adsorption of the inhibitor. It shows evidence of the presence of C, N, O and Fe, and the O and C contents display the highest amount, while the signals of N and Fe are detected with small intensities. The peaks of C and N are present because these elements are the basis of the inhibitor structure (Fig. 1). It is clear that the binding energies of the detected elements are scarcely changed at various inhibitor concentrations, so the sample immersed in the solution with 150 mg L−1 inhibitor is used for high resolution XPS analysis (Fig. 6b–e). The binding energies are corrected for charge effects by referencing the C1s to the peak at 284·93 eV. Fe 2p peak is composed of two peaks (Fe2p1/2 at 720·70 eV and Fe2p3/2 at 706·99 eV). The Fe2p3/2 peak at 706·99 eV is attributed to Fe of Fe2O3, which means a certain degree of Fe oxidation.22 It is inevitable for Fe to be oxidised during the process of preparing the specimen due to its activity. The O1s peak at 530·56 eV is assigned to the oxide on the electrode surface. The presence of N1s peak at 399·3 eV provides evidence that the inhibitor is really adsorbed on the A3 steel surface. The corresponding binding energies and atom per cent are listed in Table 4. The binding energies of N1s at various inhibitor concentrations are all ∼400·0 eV, which is higher than the N1s in the pure imidazoline molecule.22,23 While, the binding energies of Fe2p3/2 at various inhibitor concentrations are lower than that of the blank sample. Hence, it could be deduced that chemical coordination occurs between the N atom in the inhibitor and the Fe atom on the A3 steel surface, and the inhibitor molecules are chemically adsorbed on the sample surface, forming a protective film to inhibit the sample from corrosion.
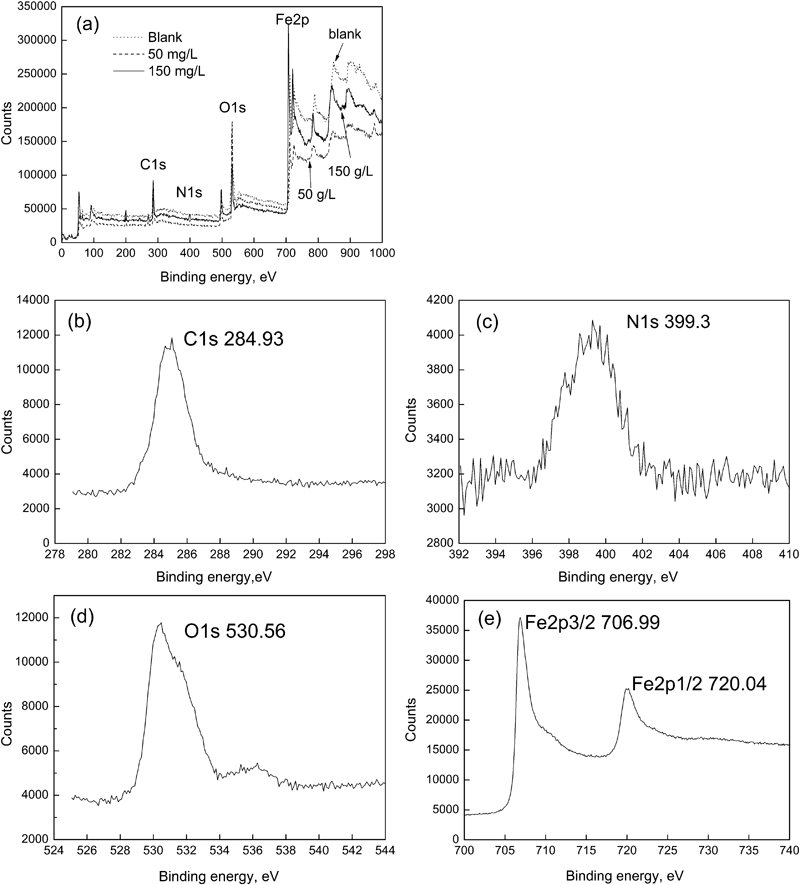
a wide scan XPS at various inhibitor concentrations; b–e high resolution XPS spectra of detected elements in presence of 150 mg L−1 inhibitor
X-ray photoelectron spectroscopy analysis (at-%) and binding energy (eV) of sample surface after 14 h of immersion in 2%NaCl solution (pH 4·9) containing various concentrations of inhibitor
Inhibition efficiency at different exposure times
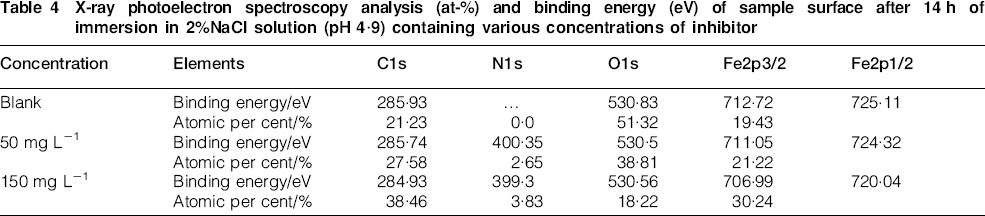
The IE of the imidazoline derivative for A3 steel in 2%NaCl solution (pH 4·9) is studied by EIS measurements throughout 8 days. Some Nyquist plots at different exposure times in the presence of 150 mg L−1 inhibitor are shown in Fig. 7. The impedance parameters during the 8 days of immersion fitted according to the equivalent circuit (in Fig. 5) are shown in Table 5. Within 120 h of exposure, C dl and C f (film capacitance) decrease, and R ct and R f (film resistance) increase with time. Accordingly, the IE calculated according to equation (4) increases with time. The maximum IE is up to 93·8% at 120 h. The change in R ct, R f, C dl and C f values is caused by the gradual replacement of water molecules by the adsorption of organic molecules on the steel surface, reducing the extent of dissolution.24 The decrease in C dl and C f results from a decrease in local dielectric constant and/or an increase in the thickness of the electrical double layer, signifying that the imidazoline derivative molecule acts by adsorption at the solution/steel interface.25 The deviation parameter n also presents an increasing trend with time, which corroborates the decrease in the surface inhomogeneity due to the adsorption over the sample surface.
Nyquist diagrams of A3 steel immersed in 2%NaCl solution (pH 4·9) without and with 150 mg L−1 inhibitor for different times
Electrochemical parameters of A3 steel in 2%NaCl solution (pH 4·9) with 150 mg L−1 inhibitor during 8 days of immersion fitted through EIS in Fig. 7
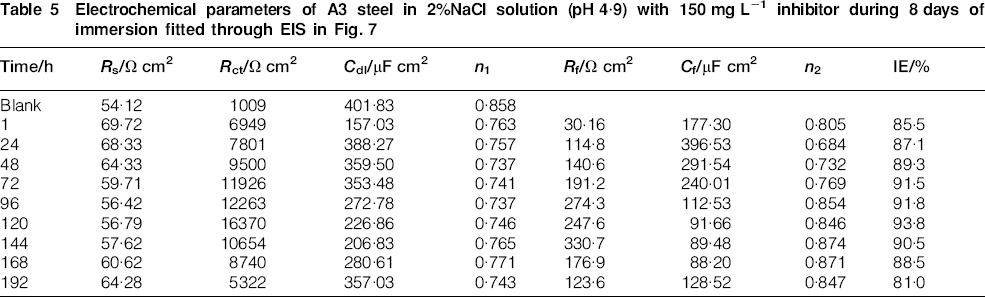
Beyond 120 h, R f and R ct show a slight decreasing tendency with time. It reveals that the inhibition performance of the imidazoline derivative reaches a maximum value as the adsorption comes to the saturated amount, which is the critical state, and the inhibitor molecules begin to desorb due to the excessive adsorption. Consequently, the IE begins to decrease. However, the C f and C dl values, especially the C dl values in the presence of the 150 mg L−1 inhibitor at 192 h of immersion, still remain quite low compared with those in the absence of the inhibitor. Meanwhile, the values of R f and R ct are significantly higher than those in the blank solution. The IE at 192 h is still as high as 81·0%. The imidazoline derivative exhibits good inhibition performance for A3 steel corrosion throughout the 8 days of exposure in the 2%NaCl solution.
Inhibition efficiency at different pH values
The IE at different pH values in the presence of 150 mg L−1 inhibitor is investigated through weight loss, polarisation curve and EIS measurements. The corrosion rate and IE in the pH range of 4·0-6·9 according to weight loss are summarised in Table 6. The corrosion rate at each pH in the solution with inhibitor is much lower than that in the blank solution, and the IE increases with pH.
Weight loss results of A3 steel after 72 h of immersion in 2%NaCl solution containing 150 mg L−1 inhibitor in pH range of 4·0-6·9
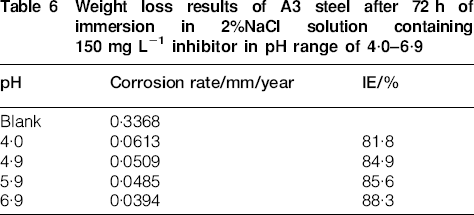
Figure 8 shows the polarisation curves of A3 steel at different pH values in the presence of inhibitors after 45 min of exposure. In the studied pH range, each polarisation curve without the inhibitor is very close to each other, and the anodic polarisation curves are almost unchanged; only one curve is therefore used as the blank for comparison. As inhibitor is added into the solution, the anodic and cathodic polarisation curves move to lower current densities. The charge transfer process is inhibited effectively by the protective adsorption film of the inhibitor on the steel surface.
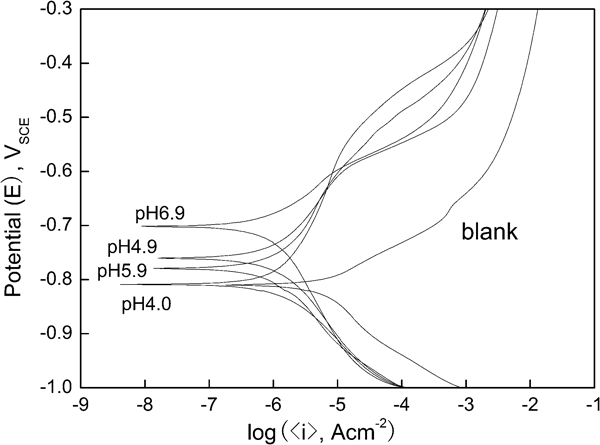
Polarisation curves of A3 steel after 45 min of immersion in 2%NaCl solution containing 150 mg L−1 inhibitor in pH range of 4·0-6·9
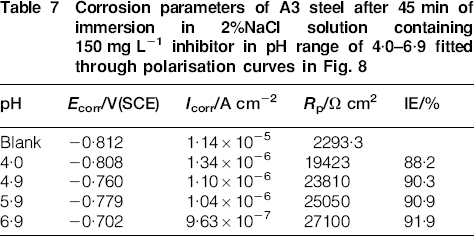
Table 7 shows the corrosion parameters fitted through the polarisation curves in the pH range of 4-6·9. The corrosion current density I corr decreases greatly in the presence of the inhibitor compared to that in the absence of inhibitor, and the imidazoline derivative shows good inhibition performance for A3 steel corrosion in the 2%NaCl solution. Meanwhile, the corrosion current density decreases with increasing pH value; the IE calculated according to equation (3) is therefore positive correlated with increasing pH level, and the maximum value reaches 91·9% at the highest pH level of 6·9. This pH dependence indicates that in the presence of inhibitor, the corrosion resistance of steel under neutral conditions is much better than that under acidic conditions.
Corrosion parameters of A3 steel after 45 min of immersion in 2%NaCl solution containing 150 mg L−1 inhibitor in pH range of 4·0-6·9 fitted through polarisation curves in Fig. 8
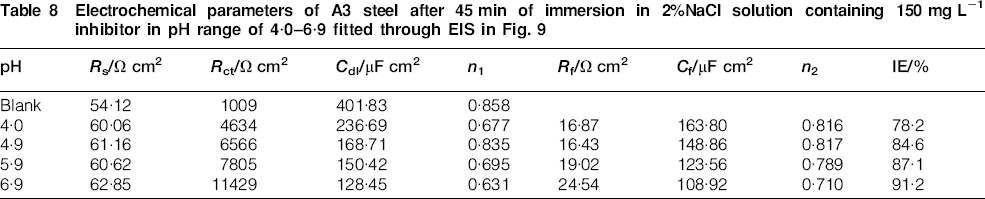
The Nyquist plots of A3 steel in 2%NaCl solutions in the presence of 150 mg L−1 inhibitor at different pH values are shown in Fig. 9. The impedance spectra in the presence of inhibitor exhibit several depressed capacitive arcs, and the arc diameter increases obviously with the pH value. It indicates that the corrosion resistance is enhanced significantly at higher pH. According to the equivalent circuit in Fig. 5, the impedance spectra are fitted, and the electrochemical parameters are given in Table 8. Moreover, only one of the spectra without inhibitor is used as the blank for comparison. As shown in Table 8, in the studied pH range, the addition of inhibitor increases R ct significantly and R ct increases with pH, while C dl decreases remarkably. Meanwhile, R f increases with pH, and C f tends to decrease. The same as the weight loss and polarisation results, the IE according to equation (4) increases obviously with increasing pH value, and the maximum value reaches 91·2% at pH 6·9. Though there is little difference of the inhibition efficiencies between the weight loss results and the electrochemical experiment results, the general orders of the efficiencies obtained from the three methods are in good agreement.
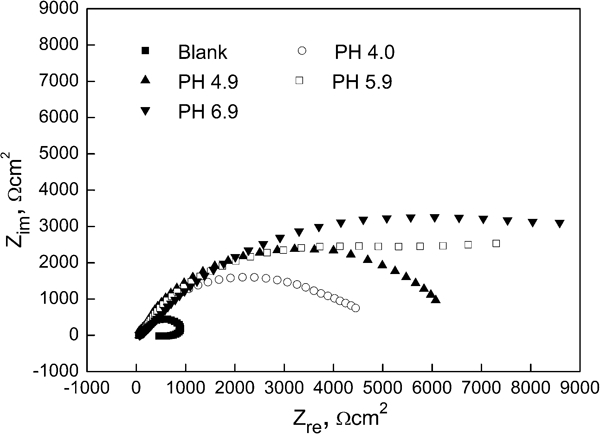
Nyquist diagrams of A3 steel after 45 min of immersion in 2%NaCl solution containing 150 mg L−1 inhibitor in pH range of 4·0-6·9
Electrochemical parameters of A3 steel after 45 min of immersion in 2%NaCl solution containing 150 mg L−1 inhibitor in pH range of 4·0-6·9 fitted through EIS in Fig. 9
The IE dependence is caused by different chemisorption behaviours at different pH values. The chemisorption of inhibitor molecules acting on the metal surface involves the following two successive steps: the electrostatic diffusion to metal surface induced by charged heteroatoms, and the chemical interaction between the benzene ring –C = N– and the vacant hybrid orbital of metal surface atoms.26 In the aqueous neutral media, imidazoline derivative molecules exist in the form of anion species. Since the metal surface is more positively charged with respect to the potential of zero charge,25,27 the inhibitor anions are adsorbed easily on the metal surface, form interconnecting bridges between the metal atoms and the organic cations and therefore facilitate the cation adsorption. However, the chemisorption could be negatively influenced by electrostatic repulsion in aqueous acidic media, where the imidazoline derivative molecules exist either as neutral species or in the form of cation species. The corrosion resistance and therefore the IE increase with pH.
Conclusions
The studied imidazoline derivative acts as an anodic type corrosion inhibitor for steel. With increasing concentration, the corrosion inhibition increases.
During the early stage of immersion, the inhibition performance first increases with time within 120 h due to the adsorption of imidazoline derivative. Then, the IE reaches the maximum value and tends to decrease slightly. However, at the end of immersion, the compound still remains good IE.
In the pH range of 4·0-6·9, the imidazoline derivative shows good inhibition performance for the corrosion of steel, and the corrosion resistance at higher pH is higher than that at lower pH. The imidazoline derivative is proved to be a credible inhibitor for the corrosion of steel at different pH values.
The inhibitive effect of the inhibitor is due to the formation of a chemisorbed film on the metallic surface caused by the formation of coordination bonds between the heteroatom in the inhibitor molecule and the Fe on the metallic surface, as it was demonstrated by XPS analysis of the tested surfaces.