
Abstract
A first quantitative description of the mechanical failure of surface scales was given by U. R. Evens in 1937. This approach can still form the basis for today's understanding, but the important role of physical defects is hidden in the energy term for the adhesional work to be overcome for scale failure. In the present paper, an extended approach is described that is based primarily on defect growth kinetics during high temperature exposure and relates the critical strain to scale failure to physical defect size via a ‘fingerprint’ parameter η. If η has been determined once for an oxide/metal system by metallography and mechanical four-point bending tests, critical oxide failure strains can be assessed simply by metallographic determination of defect sizes without additional mechanical testing. This seems to be of particular interest for the assessment of scale strain tolerance on service exposed components, e.g. in power stations. So far, the extended concept has been confirmed for Ni and Ti oxide scales; further work is currently in progress.
Introduction
The oxidation or corrosion resistance of metallic materials at high temperatures is determined by the integrity of the protective oxide scales formed under operation conditions by the reaction between oxygen from the operation environment and the respective elements of the metallic alloy.1 In this sense, oxide scales play the role of a diffusion barrier or passivating layer preventing the attack of harmful species on the metal.2 During operation, different types of mechanical stresses may be superimposed on the high temperature corrosion process and by this have a significant impact on the high temperature corrosion situation. Oxide scales even at higher temperatures, e.g. under operation conditions, are brittle materials that show only a very limited strain tolerance to failure,1 i.e. the operational stresses or strains that may result from temperature changes, gravity, centrifugal forces, pressure, etc. may easily exceed the critical limits for failure and therefore lead to cracking or spalling of the oxide scales. Figure 1 shows several examples for oxide scale failure that may result either in a loss of the protective effect or in the accumulation of spall at spots of the technical equipment where blockage can occur or the heat transfer capacity can be decreased. All of these effects are usually unwanted and should, therefore, be avoided. For this reason, a number of investigations have been performed, and models have been developed to describe the mechanical limits of such oxide scales.1
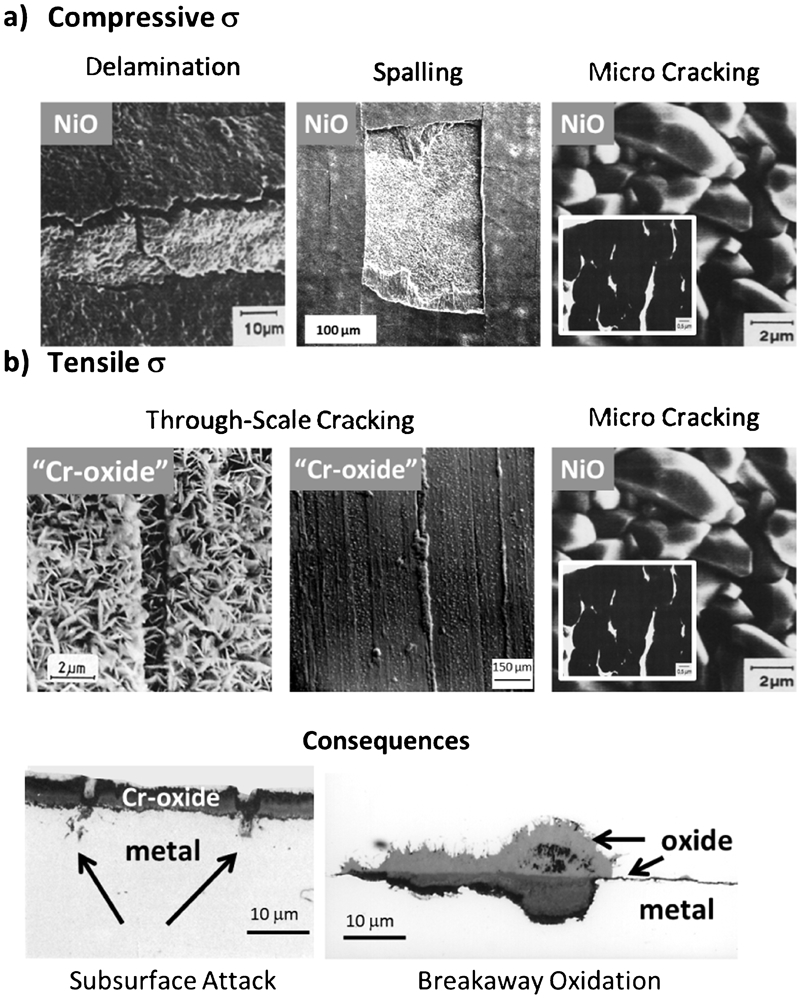
Examples of typical types of oxide scale failure and its consequences (SEM top view and metallographic cross-sections)
U. R. Evans’ approach
The first to explicitly discuss the situation of mechanical oxide scale failure was U. R. Evans in 1937 in his book ‘Metallic Corrosion Passivity and Protection’.3 In the chapter ‘Breakdown of an Oxide Film,’ he writes that ‘it may excite surprise that the tendency to crack and peel increases with thickness, but an explanation can be suggested. The compressional stresses already mentioned are pent up in the oxide film, which may be compared to a compressed spring; if the film should peel locally, this energy would be released. But to produce peeling, work must be performed to overcome the adhesional forces between metal and oxide’. Based on this assessment, he provides the following equation in the book ‘An Introduction to Metallic Corrosion,’4 which appeared in the year 1948

Follow-up work to U.R. Evans’ approach
Extensive work to describe the failure of steam grown oxide scales on steels in conventional power plants has been performed at the Central Electricity Research Laboratory in Leatherhead, UK in the 1970s, and this work was summarised in the EPRI report no. FP 686.5 The work followed the considerations of U. R. Evans and the main failure criterion was that if the elastically stored energy exceeds the energy needed to create two new surfaces, then scale failure will occur. Since the amount of elastically stored energy depends on strain and on the volume in which it is stored, i.e. the thickness of the oxide scale in which the energy is contained, a critical scale thickness can be derived at which failure will occur. Thus, in EPRI report no. FP 686, an oxide scale failure diagram was plotted based on this criterion, where the critical strain to the different types of scale failure depends on the oxide scale thickness (Fig. 2). Later on, similar concepts and diagrams have been developed by a number of other authors (see, e.g. Refs. 6-8).
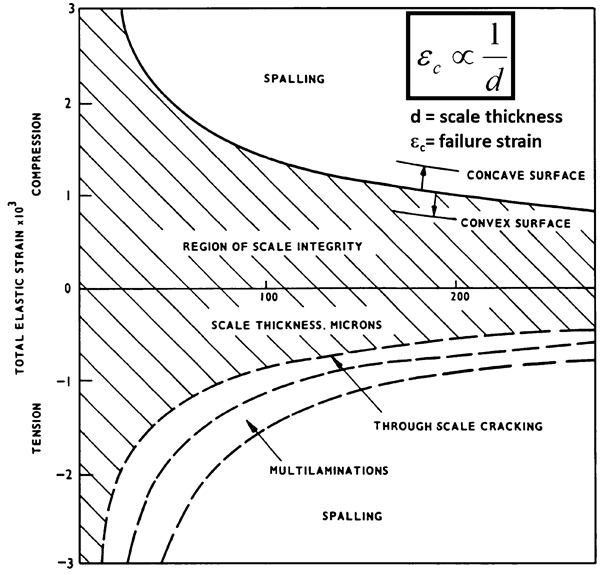
Oxide scale failure diagram developed in EPRI report no. FP6865 where critical strain to scale failure ϵ c is plotted versus oxide scale thickness d for different failure modes under tensile and compressive stresses
Generally, such oxide scale failure diagrams have the intriguing characteristics that strain limits can be defined below which, no scale failure will occur and all the subsequent negative effects of scale failure can, thus, be avoided. The other possibility is to plot the operational strain amplitudes into these diagrams and compare these values with the critical strains to scale failure. In such a case, the operation time until scale failure can be determined from this diagram. These diagrams can in a certain sense be compared with the thermodynamic stability diagrams that are used to predict protective and non-protective situations in high temperature corrosion from a chemical point of view, Fig. 3.
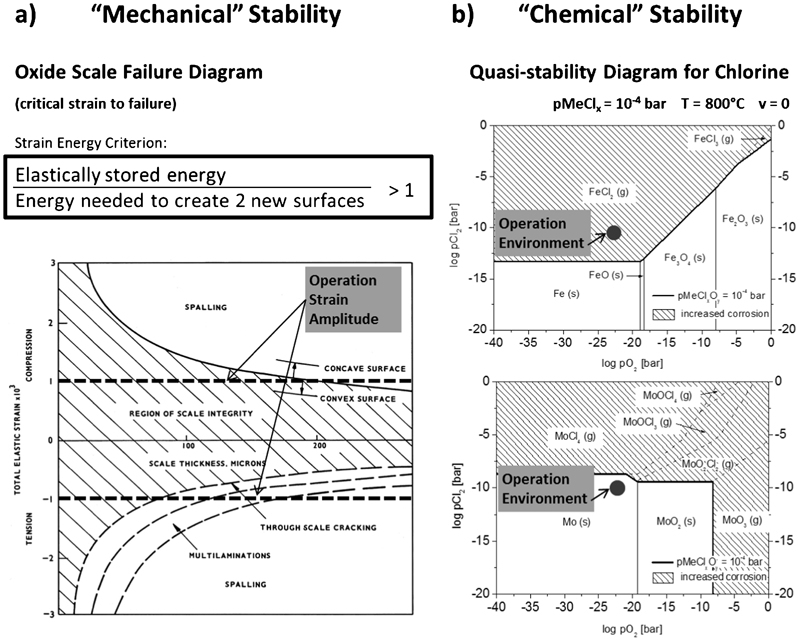
Analogies between a mechanical scale failure diagram and b thermodynamic phase stability diagram. In both diagrams the operation conditions can be entered and an assessment can be performed whether a protective or non-protective situation can be expected (diagrams from Refs. 5 and 9). In a the hatched area corresponds to mechanical stability of the oxide scale, in b the white areas represent chemical stability of the metals
There are a number of reports on experimental investigations where indeed the scale thickness determines the critical strain or critical temperature drop to scale failure, e.g. Refs. 10-12, and where the strain values seem to follow an equation similar to the one developed by U. R. Evans and later on modified in the FP 686 report or other publications. However, also, examples can be found where thick scales are still adherent on the same material while thin scales have already detached or cracked, e.g. Ref. 13. Such an example is given, e.g. in Fig. 4. Already, U. R. Evans in his book quotes some ‘recent’ work on chromium plating that emphasises the role of ‘first isolated pores which tend to become continuously less important as the thickness of the layer is increased’ and ‘a network of cracks which are absent in thin films and are present in thick areas’. In particular, in thick oxide scales, most often pores or microcracks are present as can be seen e.g. in Figs. 4 and 5. Thus, the question arises whether these pores were included in the original approach of U. R. Evans and in the equation that had later been used in its modified form also by other researchers.
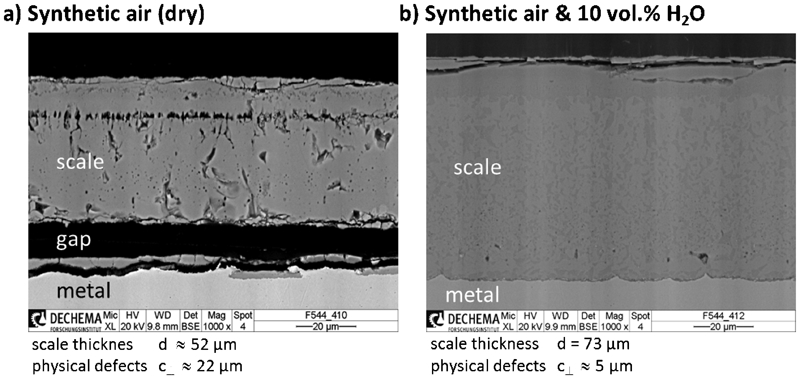
Oxide scales on Fe99·5 after 16 h isothermal oxidation at 650°C in a dry air and b air+10% water vapour: thicker scale is still adherent, while thinner scale has detached
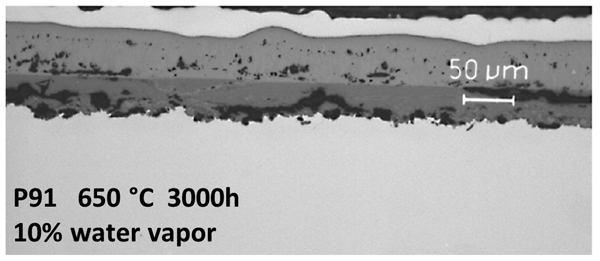
Pores in oxide scale formed on steel P91 after 3000 h in air+10% water vapour at 650°C (Ref. 14)
Role of physical defects in oxide/metal system
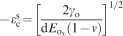
A frequently used equation in the literature describing strain to scale failure is the following
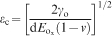
 is Young's modulus of the oxide and ν is the Poisson's ratio. This equation is a modified version of U. R. Evans’ original equation for a critical scale thickness and has, e.g. been used to establish the scale failure diagram in Ref. 5.
Concluding from work in Ref. 5 and the original work of U. R. Evans, a factor can be introduced in the energy terms that takes into account a decrease in the energy γ o needed for the formation of two new surfaces if pores or other physical defects are present in the plane of failure.
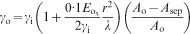
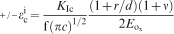
The easiest way to take into account the physical defects is to modify the energy term γ o by a geometrical term that regards the separated area in the plane of failure, see equation (3)15
In the literature, commonly γ o in equation (2) is regarded as constant over exposure/oxidation time, i.e. the role of physical defects according to equation (3) is neglected. Therefore, it seems to be interesting to assess the impact of equation (4) on the critical strain to failure, i.e. the impact of physical defects via a decrease in the adhesive energy γ o in equation (2). In other words, γ o itself would depend on exposure time and scale thickness respectively.
In Fig. 6, the critical strain values without and with assuming an influence of physical defects have been plotted based on physical defect data taken from Fig. 5 for ‘calibration’ and energy/mechanical data from Ref. 7. These were a scale thickness of 120 μm, with an average physical defect diameter of 120 μm. It was assumed that on an area of 500×500 μm, ∼20 physical defects are present (see micrograph in Fig. 5). A proportionality between scale thickness and average defect diameter was assumed as 2c = d.
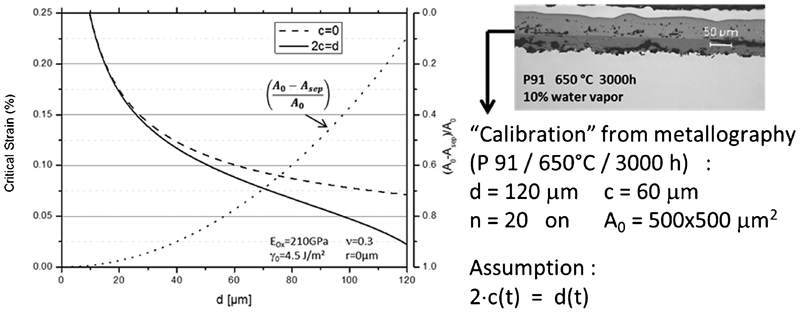
Plot critical strain ϵ c versus scale thickness d using equations (2)–(4) for cases without influence of pores or other physical defects (c = 0) and with physical defects according to equation (4) (2c = d) based on ‘calibration’ data from Fig. 5 and Ref. 7
The interface roughness r 2/λ was taken as close to zero for simplicity so that the second parentheses term in equation (3) can be approximated as 1. Increased interface roughness would increase the constant term in the first parentheses but would not influence the term given by equation (4).
The data used for ‘calibration’ are also given in Fig. 6. As this figure shows, there is not much of an influence of the defects at low scale thickness values, but with increasing thickness, the role of the non-adherent area and, thus, of the defects starts to dominate over the role of scale thickness. For the specific situation of Fig. 5, the defects would reduce the tolerable strain to less than half of what would be predicted by looking at the influence of scale thickness only.
Extended strategy
This observation proposes an extended strategy that includes the role of the physical defects. Such a strategy has been described in Ref. 15, where also fracture mechanics tools are used for the description of the parameters determining the strain to failure. In this reference, it was again the aim to develop a universal oxide scale failure diagram that is easy to apply for the quantitative assessment of the strain tolerance of oxide scales. A significant difference is, however, that a multilevel approach was developed that includes all relevant parameters influencing the mechanical properties of the scales and due to this aspect can serve as a fingerprint of oxide metal systems. This approach first categorises all the different types of oxide scale failure as given in Fig. 7. As the next step, the equations are compiled that can be used to describe the different failure mechanisms and at the same time allow the introduction of high impact parameters and low impact parameters:
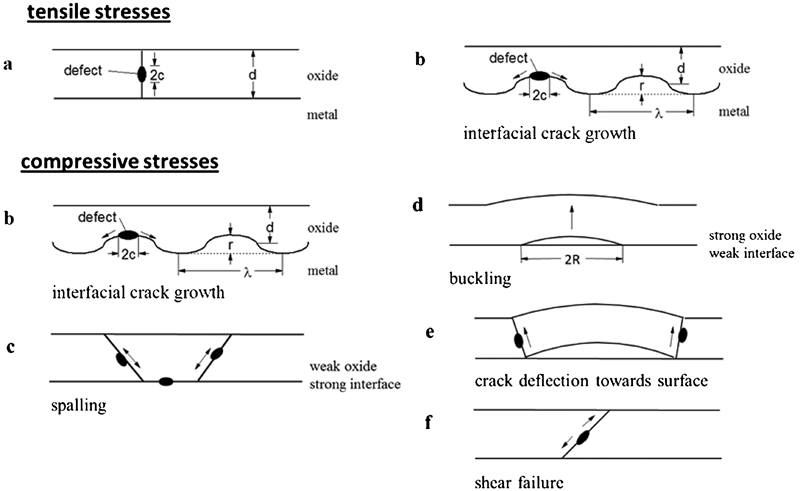
Schematic categorising scale failure15
through scale cracking (tensile)

interfacial crack growth (tensile and compressive)
spalling (compressive)

High impact parameters are c, d, r/d, γ 0 and (A o−A sep)/A o in these equations, while the remaining parameters have low impact character.
As a third step in Ref. 14, the η–ω approach was introduced. In this approach, the low impact parameters are contained in the parameter η, while the high impact parameters are represented by ω. The different equations and how they enter ω and η are given in Ref. 15. Using this η–ω approach, one can plot a similar graph as that given e.g. in EPRI report no. FP 686 (Fig. 2), with the only difference that instead of the scale thickness d, the high impact parameter ω is used. This high impact parameter would contain all changes that influence the critical strain to failure during operation. A more detailed analysis of all the equations and the parameters used in this approach in Ref. 15 shows that actually the highest impact has to be expected by the physical defect size c, e.g. by pores or microcracks. In this analysis, the scale thickness d turns out to play a minor role, which would be confirmed by Fig. 6, at least for higher scale thickness values d.
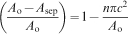
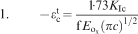
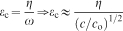
As a conclusion, one could now go the step from the original U. R. Evans approach over the η–ω approach to the η–c approach, where ω has been replaced by the normalised physical defect size c divided by c o (see equation (11))
Potential of the η–c concept
First results for experimental validation of extended strategy
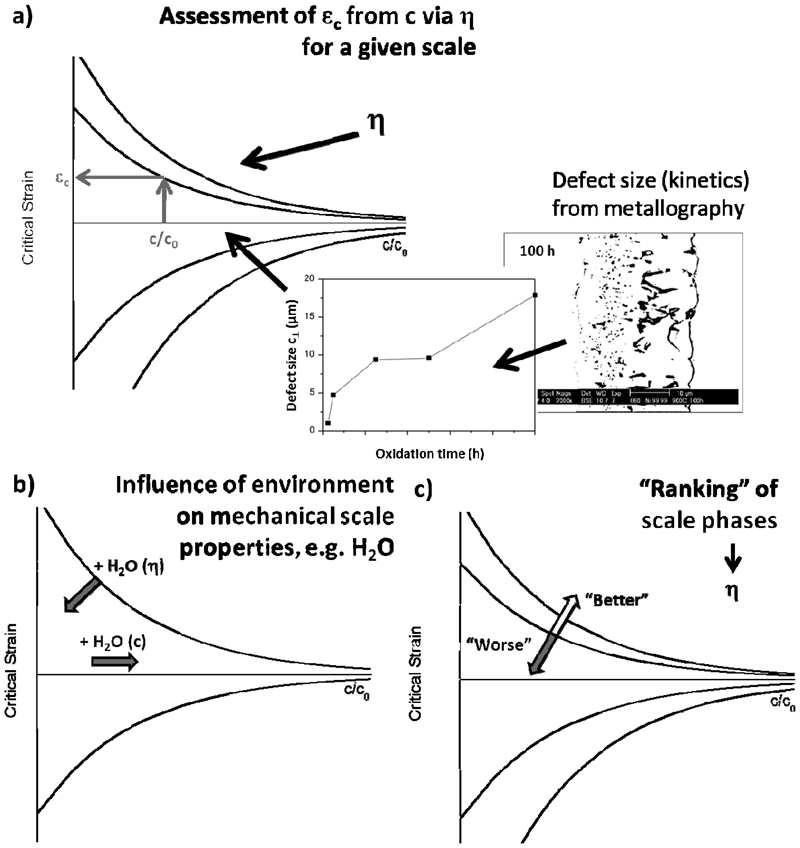
In order to make use of this approach, it is absolutely necessary to create an experimental data basis. This can be performed by combining two types of experimental investigations. The first is metallographic investigations of oxide scales after different exposure times and different exposure conditions where the size of the physical defects is determined and plotted versus exposure history (see Fig. 8a). The second is that for all these exposure conditions and times, four-point bending tests in conjunction with acoustic emission measurements have to be performed where the critical strains are determined for each defect situation. This is shown schematically in Fig. 9. Now when all these data have been quantified, the value for η can be determined that is characteristic for such an oxide/metal system (see Fig. 9).
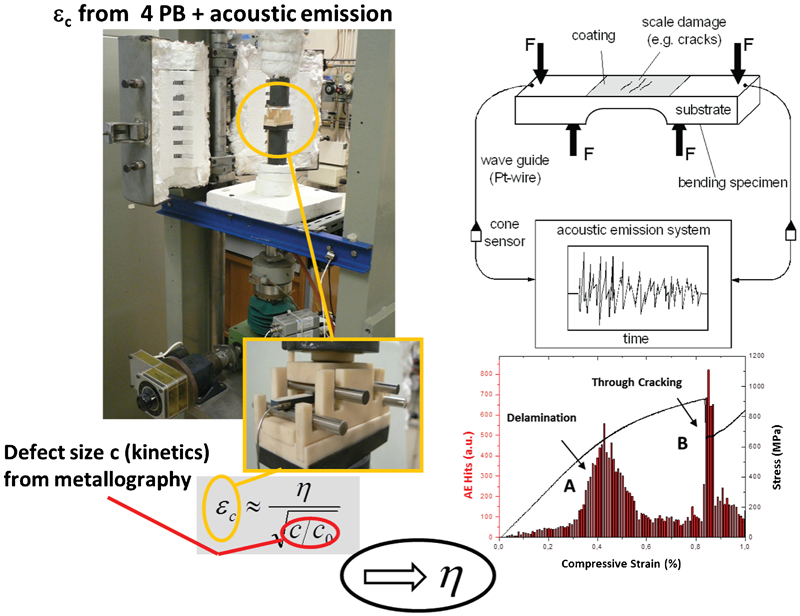
Schematic of experimental procedure to determine critical strain to scale failure in four-point bending tests using acoustic emission recording as function of applied strain
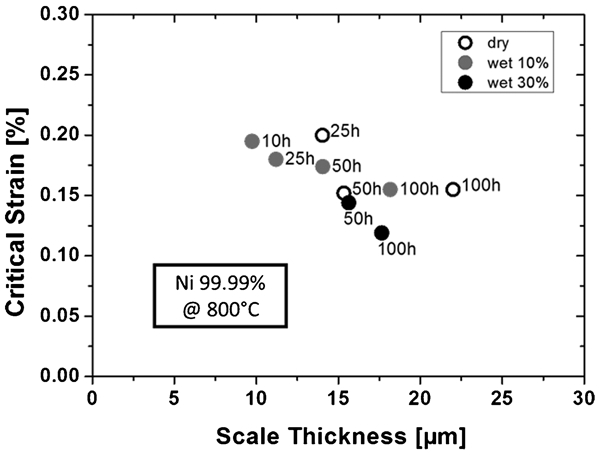
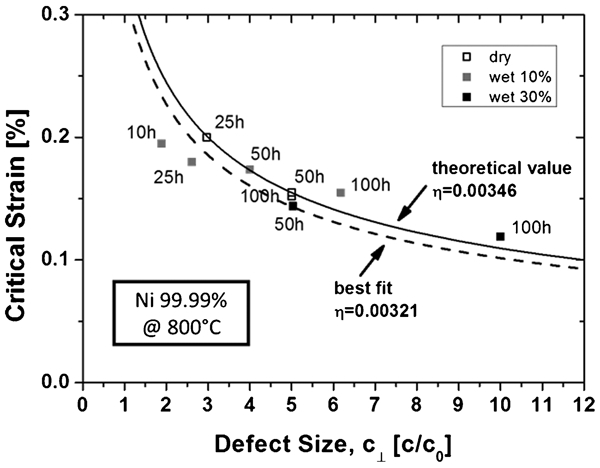
The first experimental investigations in this respect have been performed on pure nickel, on pure titanium and on pure iron. These data will be published in detail elsewhere,16 for illustration of the concept here, part of the data for NiO and TiO2 will be used. The results for the kinetics of scale thickness growth and physical defect growth of NiO are given in Fig. 10. These measurements have been performed in dry air, in air with 10% water vapour and in air with 30% water vapour at 800°C. As the plots show, there is not a significant difference between the dry and wet environment except for an oxidation time of 100 h, where at least for 30% water vapour, the physical defect size seems to be somewhat higher than for the other conditions. When plotting the critical strain versus scale thickness as in the conventional approaches (see Fig. 11), no clear tendencies become evident with regards to the influence of water vapour and scale thickness. There seems to be only a very general tendency that with increasing scale thickness, the values for the critical strain seem to decrease. The situation becomes significantly different, if the critical strain is plotted versus the physical defect size determined by metallography (see Fig. 12). Here, the values very much follow the η–c approach. Interestingly, even if one uses the ‘theoretical’ data from Ref. 7 for energy, Young's modulus, etc. that were derived from atomistic data for the calculation of η, the measured values lie very close to this line; the best fit line comes very close to this theoretical line. Another tendency that may be taken from this plot is that water vapour in this case does not seem to have a significant influence on the η value, as both curves lie in the same range.
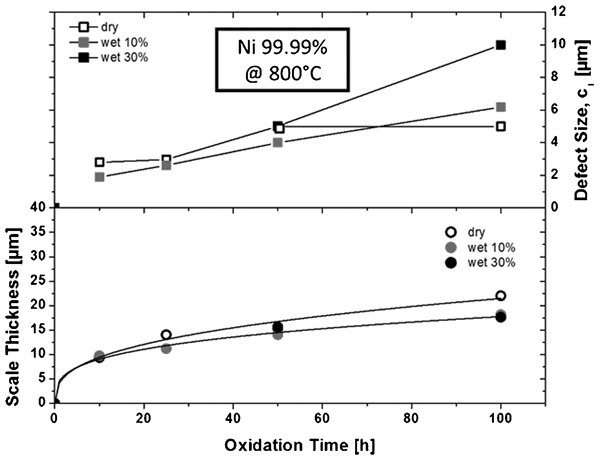
Kinetics of oxide scale growth and maximum (i.e. most critical) physical defect size for oxide on Ni99·9 at 800°C in dry air and air+10% water vapour or air+30% water vapour16
The same approach was applied to the situation of the oxide scale on titanium 99·6 (see Fig. 13). Again, the experimental data follow the η–c approach very closely, while as shown in Ref. 16, they would not fit into a plot critical strain versus scale thickness in a reasonable manner. Furthermore, this plot indicates that the presence of water vapour for titanium oxide has a significant influence on the η value, which is not surprising since a potential effect of hydrogen on the properties of titanium oxide has been mentioned in the literature.17 The data for pure iron indicate that the η–c approach also seems to apply for this type of metal/oxide system.16
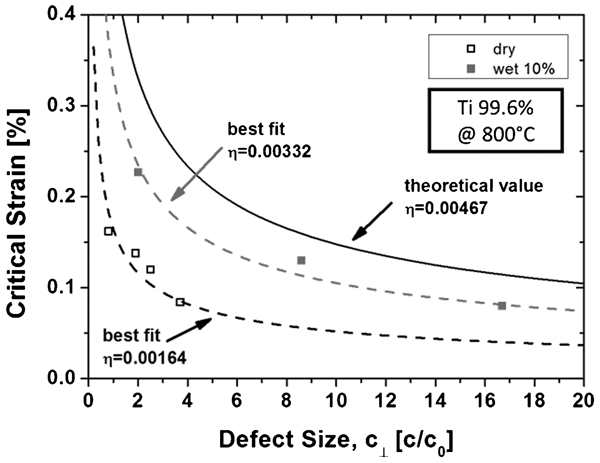
η–c plot for TiO2 on Ti99·6
Industrial relevance of extended approach
So far, this may have looked like an academic exercise, but it should not be forgotten that this approach contains a significant potential even for practical application. Figure 14 illustrates that once the η values have been determined in laboratory experiments, it becomes possible to assess the failure strains of oxide scales on components of industrial plants in conjunction with ambulant metallography. Furthermore, if an atlas of oxide scale structures from plant operation and from lab data would exist similar to the MTI Atlas of microstructures18 developed at DECHEMA-Forschungsinstitut for exposure times of up to 149 000 h, it would be possible to assess the failure strain values of oxide scales on service exposed components without the necessity of any experimental work. Simply, the defect growth kinetics are needed that should be part of such an atlas of oxide scale structures, where for the establishment of this atlas, the defect growth kinetics can e.g. be determined by the exposure of ring samples in plants and subsequent metallography after different exposure times.
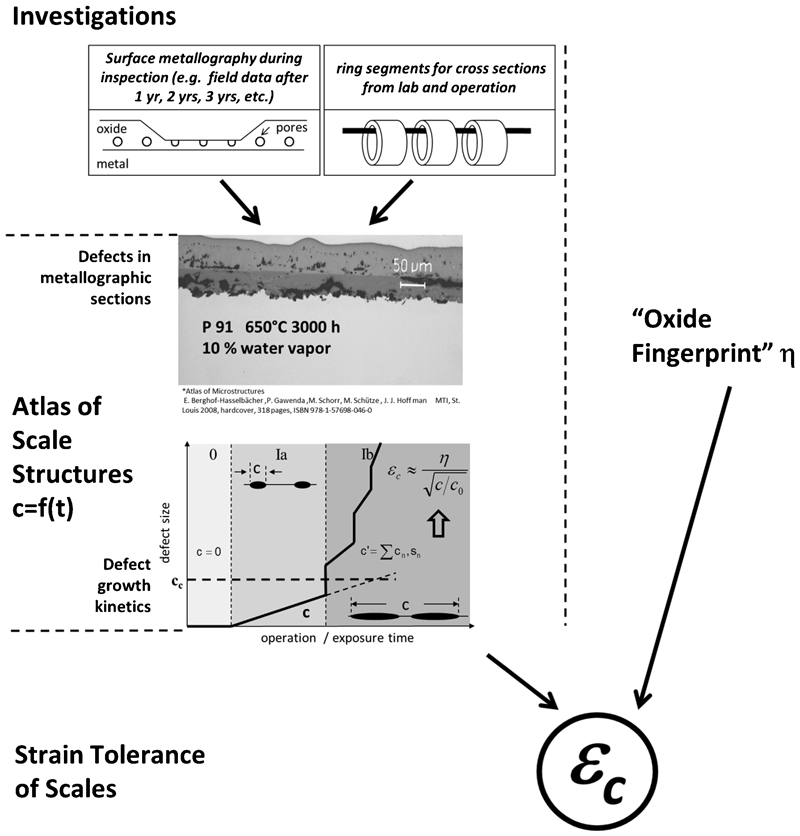
Schematic of procedure for applying η–c concept to practical conditions (for explanation, see text)
Conclusions
The U. R. Evans approach still provides a valid basis for the description of oxide scale failure; however, focusing only on the role of scale thickness can underestimate the important role of physical defects that is hidden in the energy term W A or γ o respectively. The extended ω–η approach overcomes this problem and even in its simplified form as an ϵ c versus c plot (η–c approach) offers an interesting potential for describing the mechanical limits of oxide scales. The conclusions of this work are as follows.
If η has been determined for a scale type, the critical strains to failure can be assessed simply from metallographic data, i.e. physical defect sizes (η as a ‘mechanical k p’); no additional mechanical testing would be needed.
For the examples of nickel oxide and titanium oxide, clear tendencies were observed contrary to the plot ϵ c versus d.
η can evidently reveal differences in the mechanical properties of the scales, e.g. scales in humid and in dry environment.
Further data are needed in particular to establish a wider data basis of η values for different oxide/metal systems.
Footnotes
Acknowledgements
The help of Dr M. Rudolphi in the preparation of this manuscript is gratefully acknowledged.