
Abstract
In the present paper, the nanoindentation theory proposed in Ref. 1 is extended to nanoscratching, considering different sizes and shapes of a nanosized indenter/scratcher penetrating into a plastic material. The finding can explain the observed scaling of the mean pressure or specific energy for scratching; such a quantity is seen as ‘lateral hardness’, allowing one to unify nanoindentation and nanoscratching as different aspects of the same nanotribology. The scratching resistance and hardness are then discussed as a function of the penetration velocity. Finally, new experiments of nanoindentation, using an atomic force microscope coupled technique for indentation and imaging, of a complex and anisotropic metallic–organic framework pulverised material are reported and discussed, quantifying the role of the nanohardness, Young's modulus, pile-up and nanoscratching resistance.
Introduction
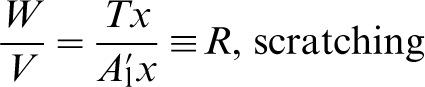
Hardness H is defined as the normal load F divided by the projected normal area  of the indentation (
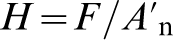 ); thus, it is the ‘mean pressure’ that a material will support under a load applied perpendicularly to the solid surface. A similar ‘mean pressure’ or ‘specific energy’ R is defined in scratching when considering a force T parallel to the solid surface and the projected lateral area
  of the scratching (
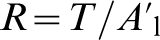 ). These parameters are only nominally constant and are experimentally dependent on the penetration depth and the size and shape of the indenter, as has already been discussed for nanoindentation.
1
In the present paper, previous results on nanoindentation are extended to nanoscratching using the key idea that the scratching resistance of a material is simply its ‘lateral hardness’. The failure mode of nanocutting is also considered.
). These parameters are only nominally constant and are experimentally dependent on the penetration depth and the size and shape of the indenter, as has already been discussed for nanoindentation.
1
In the present paper, previous results on nanoindentation are extended to nanoscratching using the key idea that the scratching resistance of a material is simply its ‘lateral hardness’. The failure mode of nanocutting is also considered.
Much of the early work on indentation was reviewed by Mott. 2 Ashby 3 proposed that geometrically necessary dislocations 4 would lead to an increase in hardness measured by a flat punch. The problem of a conical indenter has been recently investigated, 5 showing a consistent agreement with microindentation experiments. However, previous results that cover a greater range of depths show only partial6,7 or no agreement 8 with this model. 9 Thus, it was extended by Swadener et al. 7 in a very interesting way to treat indenters of different sizes and shapes; the results were compared with those of microindentation experiments, but limitations for small depths of pyramidal indenters or sizes of spherical indenters were observed, as pointed out by the same authors. Accordingly, such a treatment was extended for developing a new model capable of matching as limit cases the discussed indentation laws, simultaneously capturing the deviation observed towards the nanoscale. 1
The present paper, based on the previously mentioned Refs. 2–9 but also on Refs. 10–17, extends the results reported in Ref. 1 for nanoindentation to nanoscratching, including nanocutting; new experiments of nanoindentation, using an atomic force microscope (AFM) coupled technique (for indentation and imaging), of a complex and anisotropic metallic–organic framework (MOF) pulverised material are reported and discussed.
Theory
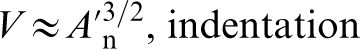
The previous indentation models1,5,7 assume that plastic deformation of the surface is accompanied by the generation of geometrically necessary dislocations; assuming this same hypothesis, the deformation volume during the scratching of length x is assumed to be
 is the projection of Ω on the solid surface (nominal groove area) and b is (the modulus of) Burger's vector. Thus, the surface difference S can be interpreted as the one along with the energy flux arises, positive if outgoing (Ω) and negative if incoming (
 ).
).
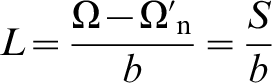
Accordingly, the average geometrically necessary dislocation density is ρG = L/V = S/(bV); since L,V∝x, ρG is not a function of x.
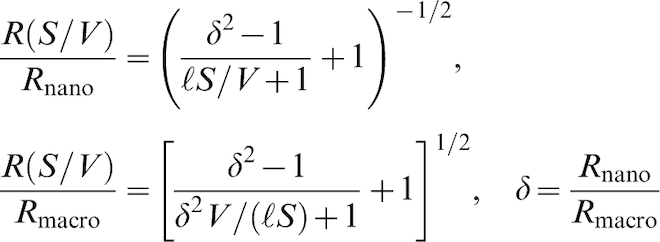
Following the approach proposed in Ref. 1, it is found that
 ,
,  and
and 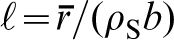 , where
  is the Nye factor (∼2
7
), ρS is the statistically stored dislocation density,
5
μ is the shear modulus, α is a constant (0·3–0·6 for fcc metals
12
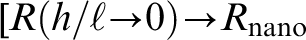
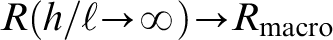
) and again β is a constant (∼1; see Ref. 1 for details). These expressions have to be considered with caution, depending on the details of the assumed nanomechanisms, in contrast to the more robust result of equation (3); in any case, they imply the following estimations: Hnano≈Rnano and Hmacro≈Rmacro, even if, in general, H≠R. From a physical point of view, note that
is the Nye factor (∼2
7
), ρS is the statistically stored dislocation density,
5
μ is the shear modulus, α is a constant (0·3–0·6 for fcc metals
12
) and again β is a constant (∼1; see Ref. 1 for details). These expressions have to be considered with caution, depending on the details of the assumed nanomechanisms, in contrast to the more robust result of equation (3); in any case, they imply the following estimations: Hnano≈Rnano and Hmacro≈Rmacro, even if, in general, H≠R. From a physical point of view, note that 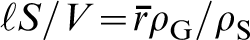 , i.e. it is equal to the ratio of the geometrically ‘sufficient’ and statistical stored dislocation densities, whereas
 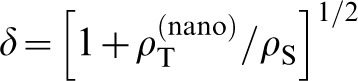 . Note that for δ→∞ and considering self-similar objects of size B,
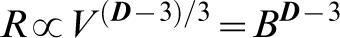
  , which agrees with previous scaling laws for material strength.
18
The two equivalent expressions in equation (3) correspond to a bottom-up or top down view. Equation (3) is a general shape/size effect law for nanoscratching that provides the scratching resistance as a function only of the ratio between the net surface throughout which the energy flux propagates and the volume where the energy is dissipated, or simply stated, as a function of the surface/volume ratio of the domain in which the energy dissipation occurs. The same equation formally holds for nanoindentation but with a different characteristic length V/S, since in this case, the volume must be calculated as reported in equation (1b) and also the calculation of S in equation (2) changes (in nanoindentation, the dislocations arise in loops and thus of lengths not anymore proportional to x; see Ref. 1).
, which agrees with previous scaling laws for material strength.
18
The two equivalent expressions in equation (3) correspond to a bottom-up or top down view. Equation (3) is a general shape/size effect law for nanoscratching that provides the scratching resistance as a function only of the ratio between the net surface throughout which the energy flux propagates and the volume where the energy is dissipated, or simply stated, as a function of the surface/volume ratio of the domain in which the energy dissipation occurs. The same equation formally holds for nanoindentation but with a different characteristic length V/S, since in this case, the volume must be calculated as reported in equation (1b) and also the calculation of S in equation (2) changes (in nanoindentation, the dislocations arise in loops and thus of lengths not anymore proportional to x; see Ref. 1).
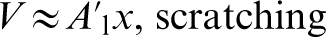
Furthermore, in scratching, ‘smaller is stronger’, and thus, nanoscratching requires a huge amount of energy W per unit removed volume V
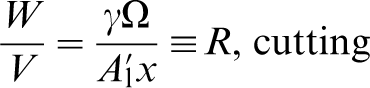
Three simple examples can be considered. For a scratching of depth h made by a flat punch of width w, V≈whx, S≈(w+2h−w)x = 2hx and thus V/S≈w/2, which is the governing characteristic size of the process [note that for cutting, R = γ(1/h+2/w)]: thus, more than depth effects one can expect for scratching, without cutting, width effects [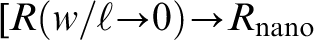 ,
, ]. For a conical scratcher having the vertex angle equal to 2α, the governing characteristic size is
 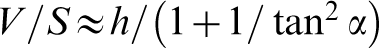 [
[ ,
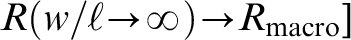
,  ; in addition, note that R(α→0)→Rnano; for cutting,
 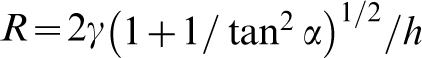 , and thus, the two processes are, in this specific case, similar]. Finally, for a sphere of radius r penetrating at a depth h = r−r cos
The scaling law of the specific energy can also be computed according to19–21
It is noted that the friction force applied by a fluid on a particle moving on it with velocity v is proportional to the first power of the velocity for a small Reynolds number (Stokes’ law for a sphere) but to the second power of the velocity (constant drag coefficient) at a large Reynolds number.
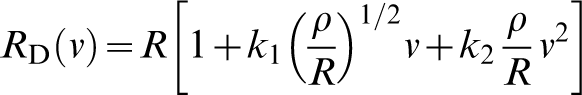
Different from a fluid, the resistance of a solid is not negligible at negligible velocity, as predicted by equation (3). Thus, generalising equation (3), a dynamic penetration resistance is expected (also for hardness)
The scratching force exists also after removal of the normal force, and thus, in this case, the friction coefficient tends to infinity; on the other hand, the normal force must be applied in order to reach a given penetration depth: accordingly, dividing the normal maximal force F for the lateral force T, a pseudofriction coefficient can be defined
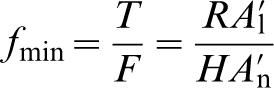
 , and thus, the pseudofriction coefficient is roughly proportional to the lateral projected cross-section area
  at fixed
  , as can be easily verified in one's own home using butter as plastic material and knife as scratcher and scratching the butter along or perpendicular to the cutting edge of the knife. The expected transition from scratching to cutting is also observed by increasing the attack angle.
Experimental
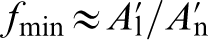
Whereas nanoscratching is used for evaluating the resistance to scratching of a material, nanoindentation easily provides, in addition to hardness, its Young's modulus. An example of nanoindentation experiment, with the aim of deriving hardness and elasticity on a complex material, is reported in this section. The mechanical anisotropy of the hybrid MOF material reported in Fig. 1 has been investigated.
Tested MOF material (provided by research group of Nobel Laureate H. Kroto)
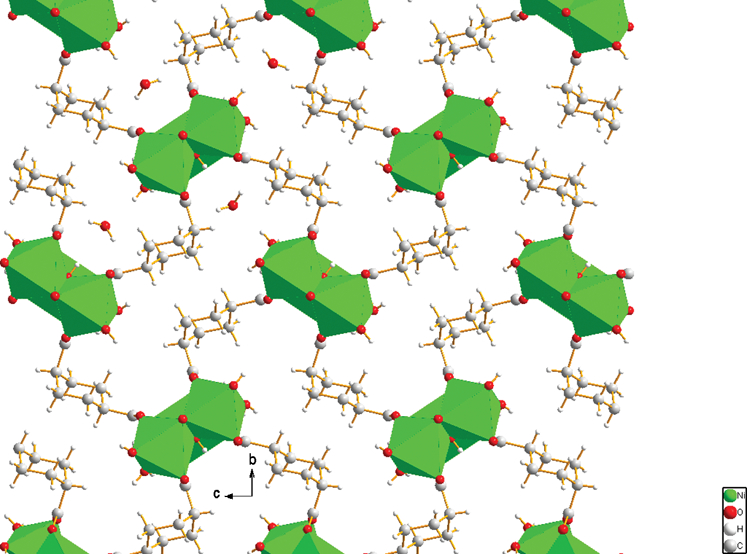
An AFM nanoindentation technique has been employed; this technique is extremely powerful because of its versatility, allowing one to measure hardness and to image the surface with AFM high resolution at the same time.25,26 With this approach, it is indeed possible to check exactly the morphology and the position of the different facets forming the crystal, indenting, and thus measure the exact local superficial hardness and elasticity of the sample. In particular, a minimum quantity of the MOF powder was placed on a droplet of colloidal graphite, arranged on a silicon substrate. In this way, it is possible to observe crystals of MOF, arranged in the way shown in Fig. 2. They indeed show a triangular structure with a high statistical distribution, as expected for this kind of material. Many MOFs show the top triangular face, while only a few arrange themselves on a side, showing a lengthened structure.
a 600 μm; b 250 μm; c 100 μm
The whole experimental campaign is performed using AFM nanoindentation. The instrument used is a Digital Instruments EnviroScope AFM by Veeco. This instrument allowed us to indent the sample and image it right after the indentation.
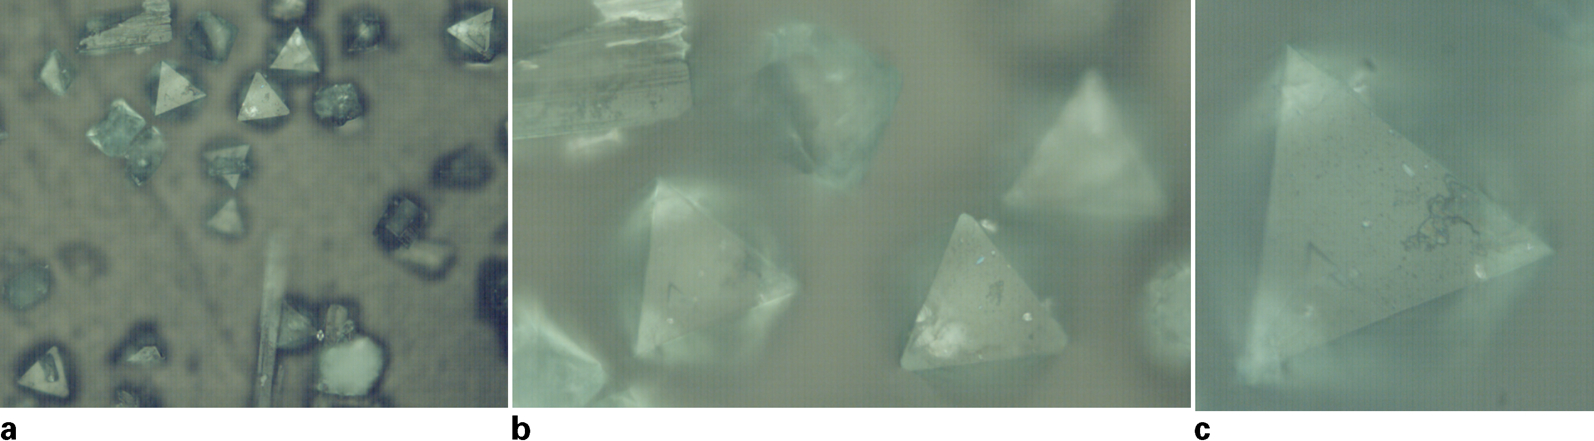
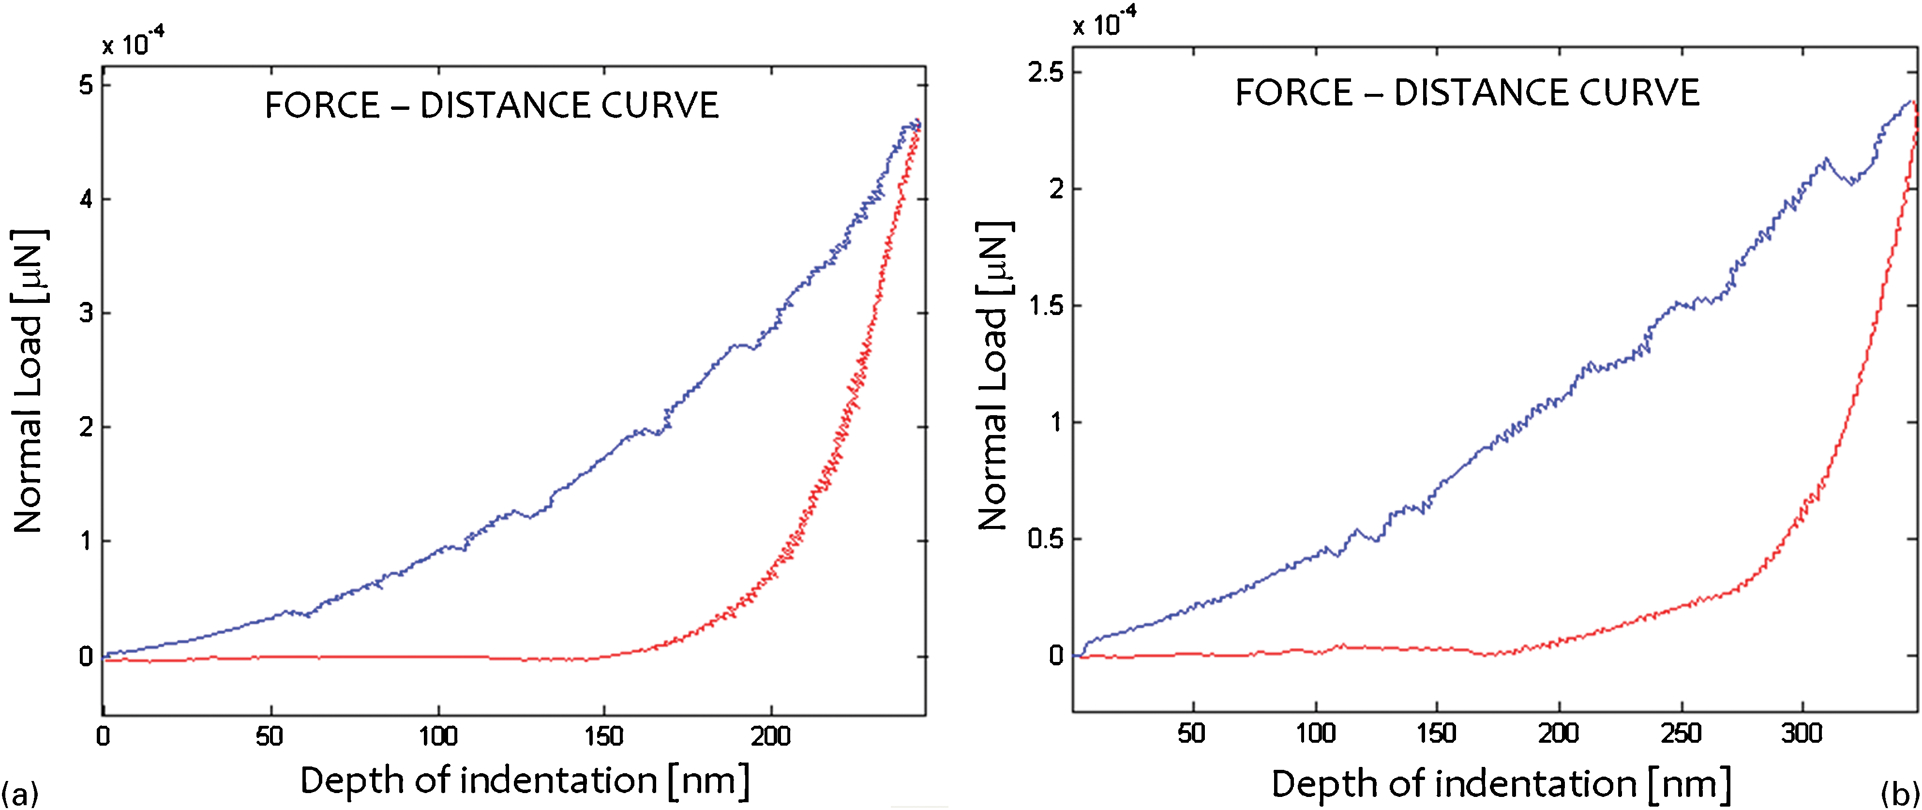
The AFM tip was initially placed on a MOF facet (triangle with a red square surrounding it, Fig. 3a). This is a very tricky procedure because the triangle facets are raised with respect to the graphite substrate (there is a focus mismatch). The AFM has a vertical stroke of 5 μm (much smaller than the difference between the crystal facet and the substrate); thus, it is mandatory to jump directly on the triangle during the approach phase in order to take a correct image of the sample. This is not trivial because the optical microscope of the AFM is for positioning purpose only, and it has not enough resolution to have an easy positioning on such a small item. In Fig. 3b, an AFM image of the top facet of the MOF crystal is reported. The second test has been carried out on the lateral side of a MOF crystal (one of the few lateral sides observable) reported in Fig. 3c with a red rectangle surrounding it. It is visible how the focus is extremely different from the other structures in the figure. This means that the functional surface is extremely raised with respect to the other structures. This surface is, however, extremely smooth, much more than the surface of the triangular face, as confirmed by roughness measurements: RRMS-side∼3·5 nm and RRMS-top∼18·5 nm.
a detail of top facet indented (FOV: 800 μm); b AFM image of triangular top face of sample; c detail of lateral facet indented (FOV: 980 μm)
The experimental phase consists of a matrix of nine nanoindentations (three by three) performed at different loads for the two facets. In the first case (Fig. 4a), an indentation load of F = 478 μN was applied. In the second test, carried out on the lateral side of the crystal (Fig. 4b), the indentation load is half the previous one (F = 239 μN). In this case, in fact, the material seemed less hard, and it was not possible to reach the same force as before. For this reason, the image has a different field of view. In the latter case, the surface is evidently smoother, and also the indentation process appears different. On the top facet, there is, in fact, an evident pile-up, uniformly distributed on the three indentation sides (Fig. 4a), while on the lateral facet, there is a smaller pile-up concentrated on the two lateral sides of the indentation (Fig. 4b). This behaviour makes anisotropy among the two facets even stronger. The hardness and Young's modulus trend for the two samples analysed (for each sample, nine different points of analysis have been measured) are reported in Fig. 5. The data have been obtained by the analysis of the load–displacement curves using the Oliver and Pharr method.27–29 The hardness values have been also evaluated using the AFM images in order to avoid any pile-up effect, and the results are reported in Fig. 6. The difference in the predictions quantifies the pile-up; here, no significant differences are noticeable.
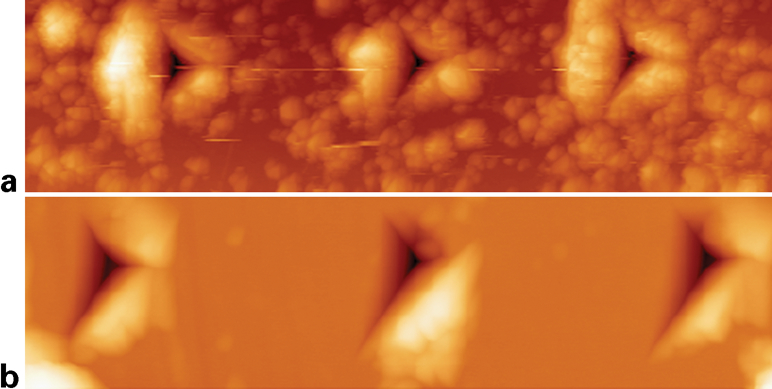
a on top facet of MOF sample (FOV: 9 μm); b on lateral side sample (FOV: 4·5 μm)
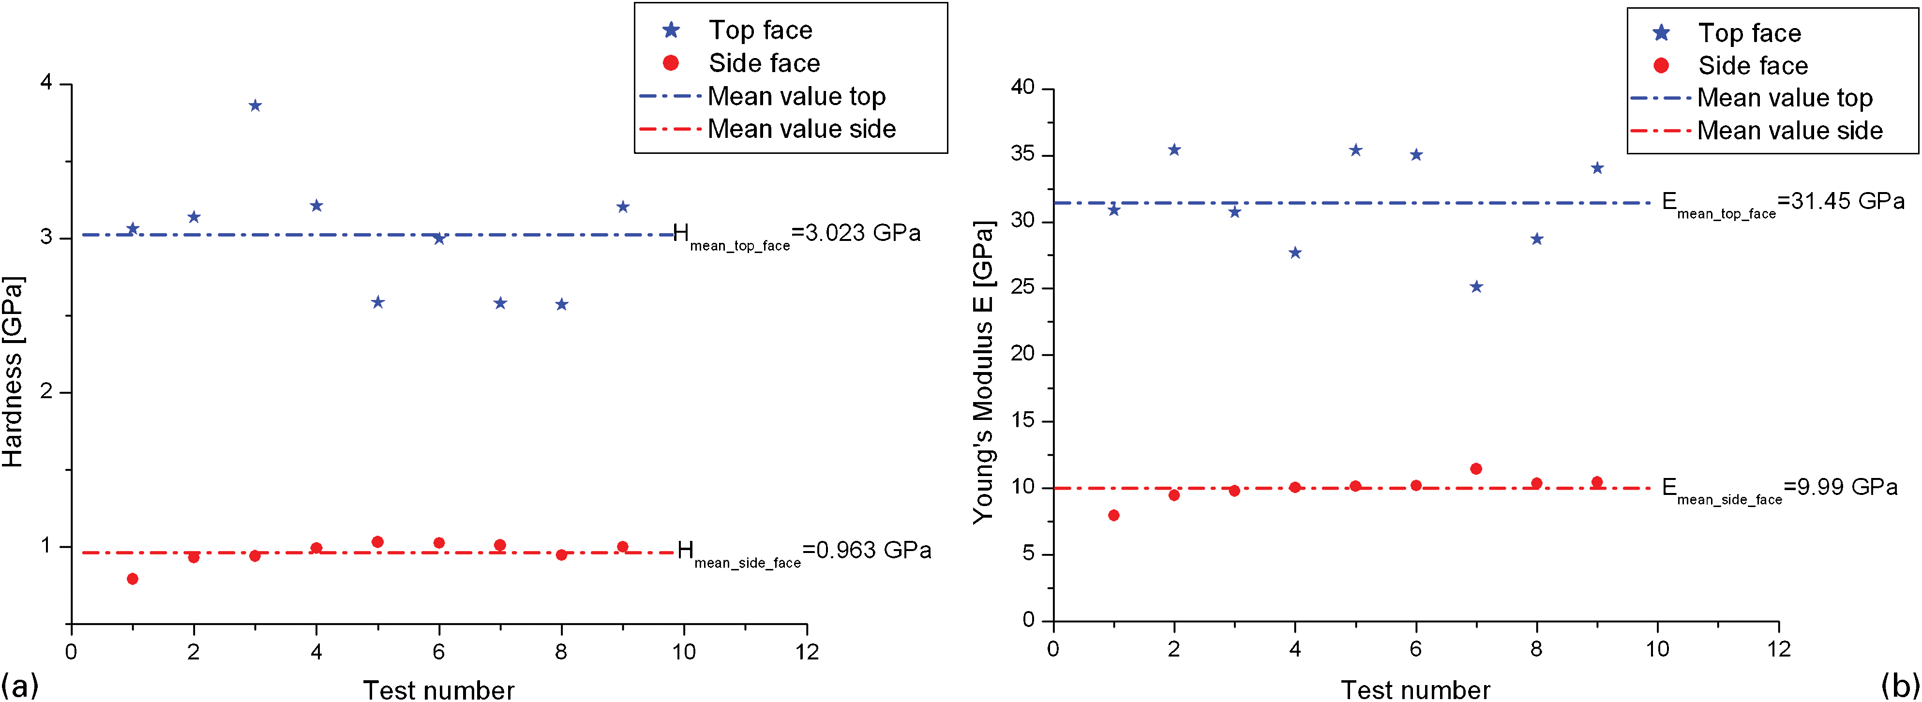
a hardness and b Young's modulus of two sides of MOF crystal
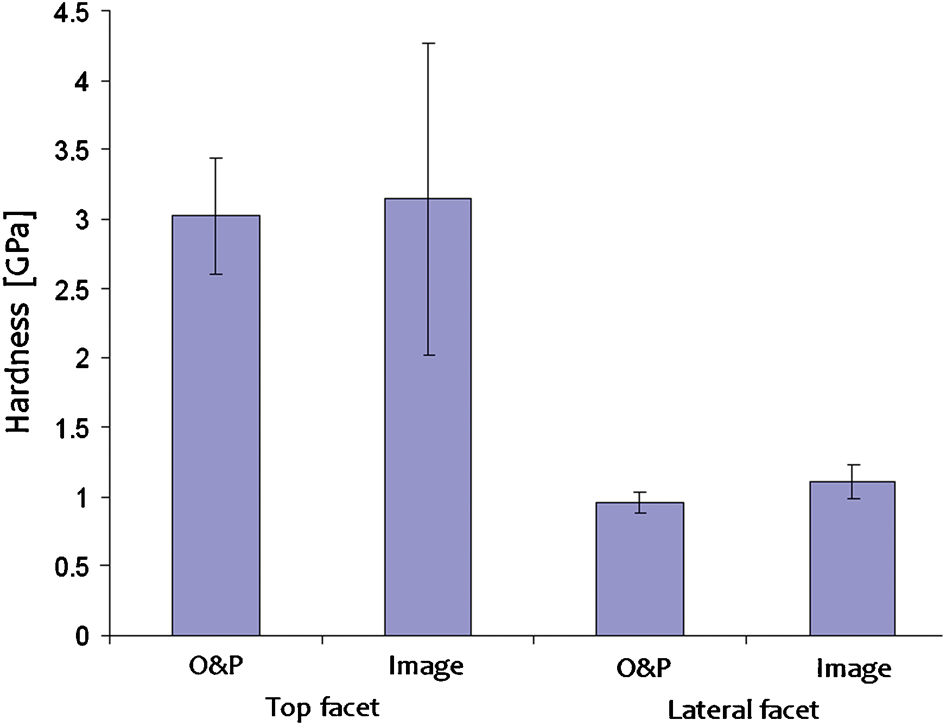
Hardness of two sides of MOF crystal using Oliver and Pharr method or using AFM images (direct approach that takes into account pile-up)
It is possible to notice how both the nanohardness (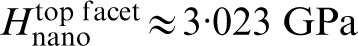 ,
, 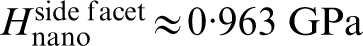 ) and Young's modulus (
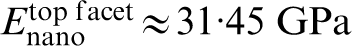 ,
,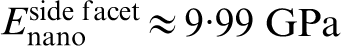 ) of the triangular surface (top face) are larger than those of the lateral face by a factor of ∼3. This underlines a strong anisotropy in this kind of MOF material, in agreement with measurements in similar MOF materials.
30
According to the previous theory, even if in general R≠H, a specific energy for nanoscratching
) of the triangular surface (top face) are larger than those of the lateral face by a factor of ∼3. This underlines a strong anisotropy in this kind of MOF material, in agreement with measurements in similar MOF materials.
30
According to the previous theory, even if in general R≠H, a specific energy for nanoscratching  and
and  can be deduced. Such theoretical predictions are useful also because direct experiments in a powdered material, as in the case of the authors’ MOF, are even more challenging than those of nanoindentation.
Another interesting behaviour comes out by observing the raw data of the force–indentation depth curve in both the crystal planes analysed (Fig. 7). As a matter of fact, pop-in events can be detected on both of the indented facets. These events probably originate from the breakage of hydrogen bonds that bind the layers together. 30 Thus, they are barely pop-ins but more related to the material than to the instrument itself, even if a complex coupling due to displacement bursts cannot be excluded. In any case, their effect on the measurements is negligible here.
a top face, smaller; b lateral face, larger
In both cases, the number of pop-ins is approximately the same, but in the second case they appear more prominent with a higher displacement. This evidence, together with the smaller value of hardness modulus, could be attributed to the direction of the inner layers, which in this case should be parallel to the indentation direction.
Conclusions
The present paper has discussed nanoscratching (including nanocutting) and nanoindentation thanks to the general approach presented in Ref. 1 and based only on the surface/volume ratio of the domain in which the energy flux occurs, considering different sizes and shapes of the scratcher/indenter. Nanoindentation is considered to be a good method for deriving hardness and Young's modulus of a material. However, the proposed method suggests that nanoscratching could become in the future a promising alternative tool to nanoindentation. New experiments of nanoindentation, using an AFM coupled technique (for indentation and imaging), of a complex MOF pulverised material are reported and discussed, quantifying the role of the pile-up, measuring nanohardness and Young's modulus and estimating the nanoscratching resistance. A strong anisotropy (material properties differ by a factor of ∼3) is observed.