
Abstract
In the present study, the effect of the processing routes (A, BA, BC and C) of equal channel angular pressing (ECAP) on texture evolution has been investigated for different initial microstructural conditions of the 2014 Al alloy. The present study also features the issue of heterogeneity in texture evolution along the thickness of the ECAP processed sample as a function of the processing routes. A stronger texture evolution was observed in the solution treated (ST) conditions for most of the processing routes (A, BA and BC except for C) due to the increased contribution from solid solution hardening during ECAP. A comparatively weak texture evolution is observed for as extruded+annealed and solutionised+aged conditions because of the strain scattering due to the fragmentation and dissolution of precipitates. The texture evolution along the thickness direction for ST samples suggests that the inherent heterogeneity of the ECAP process is minimised when processed via route C.
Introduction
The refinement of grain size up to the submicrometre range (∼0·1–1 μm) or even smaller (<100 nm) usually leads to the most suitable combinations of strength and ductility for metallic materials.1 This has led to a quest for fabricating ultrafine grained (UFG) materials in recent times.2 In this regard, severe plastic deformation (SPD) based approaches have been found potential to produce such fine grain sized materials in bulk. These processes usually involve the application of very large strains, which lead to microstructural refinement through subgrain formation and subsequent continuous dynamic recrystallisation.3 An added advantage is the minimal change in initial sample dimensions during successive steps in a multistep processing schedule. Different variations of SPD processes, e.g. equal channel angular pressing (ECAP), high pressure torsion, multiaxial forging, etc., have been successfully applied to fabricate UFG materials.4–12
More recently, ECAP has come up as a potential SPD technique for the production of UFG microstructures in bulk materials.13,14 During ECAP, it is possible to alter the microstructure,15–17 mechanical property18,19 and texture4–10,20 of the material by changing the strain path between successive passes. There are generally four different ways to do so. In route A, no rotation is provided to the specimen between subsequent passes. In contrast, the specimen is rotated by 90° in alternative directions in route BA and in the same direction in route BC between each passes. Finally, in route C, the sample is rotated by 180° in the same direction between subsequent passes. A typical texture evolves as a result of ECAP processing following these four routes, which this has been investigated as a function of grain refinement effectiveness,21,22 back pressure and die relief angle,23 deformation path,6–10 etc., for various aluminium alloys.
One of the major limitations of ECAP includes the inhomogeneous deformation and resulting heterogeneity in microstructure and texture along the thickness of the sample. The various factors that account for this microstructural inhomogeneity are related to die design, friction effect, strain, strain path, back pressure, temperature and material properties.23–29 The heterogeneous texture, on the other hand, evolves due to a change in material flow characteristics and related differential work hardening along the cross-section of the sample.30 In spite of the fact that it is possible to reduce the deformation inhomogeneity by synchronised alteration of the deformation path during ECAP,21 only a limited number of studies have been carried out in this direction.8,31–34 Moreover, such studies are mostly restricted to pure metals, and no comprehensive investigation has been carried out so far on the alloys. This issue becomes particularly important for the 2xxx series Al alloy, which can exist either in a precipitate free condition [solution treated (ST)] or precipitate containing aged condition.
It is in this regard that the present study addresses two important, yet relatively unexplored, issues pertaining to ECAP of age hardenable 2014 Al alloy. These include (i) the influence of processing routes on the microstructure and texture evolution after ECAP for different starting microstructural conditions and (ii) the effect of processing routes on texture heterogeneity for an optimised starting condition. Understanding these issues is expected to optimise the ECAP processing schedule for superior microstructure and texture combinations. The starting materials for the present investigation, therefore, consist of the alloy in as received condition, after solutionising and after aging. These three materials have been subjected to ECAP through processing routes A, BA, BC and C up to five passes. The microstructure and texture after ECAP has been characterised and correlated with the starting microstructure, texture and respective processing routes.
Experimental
Material
In the present investigation, the commercially available 2014 Al alloy has been used as starting material in the form of an extruded rod of 13 mm diameter. The chemical composition of the starting alloy is given in Table 1. The starting alloy was further processed via ECAP in three different conditions: (i) as extruded+annealed at 688 K for 1 h and air cooled after the annealing treatment (E+A), (ii) solutionised at 768 K for 1 h and quenched to room temperature (ST) and (iii) solutionised at 768 K for 1 h, quenched to room temperature and artificially aged at 468 K for 5 h (ST+A).
Chemical composition of base 2014 Al alloy

Equal channel angular pressing processing
For the ECAP experiments, the starting extruded rods were machined in the form of cylindrical specimens of 11 mm diameter and 50 mm length. The ECAP die consists of a channel of diameter 11 mm with an angle of Φ = 90° and a corner angle of Ψ = 20° (Fig. 1a). The equivalent strain per pass for this die design is calculated to be ∼1·07.34 The ECAP experiments were carried out at ∼34°C up to five passes using a hydraulic press at a crosshead speed of 0·5 mm s−1. The die was well lubricated using MoS2 before each ECAP pass. It is to be noted that the effect of deformation on microstructural changes (e.g. grain refinement) as well as texture evolution saturates only after the first few passes during any SPD process.35 Furthermore, the materials processed through routes BA and BC complete a cycle in four passes, and the orientation of the sample comes back to its original configuration in the fifth pass. From that perspective, the ECAP processing is carried out only up to five passes.
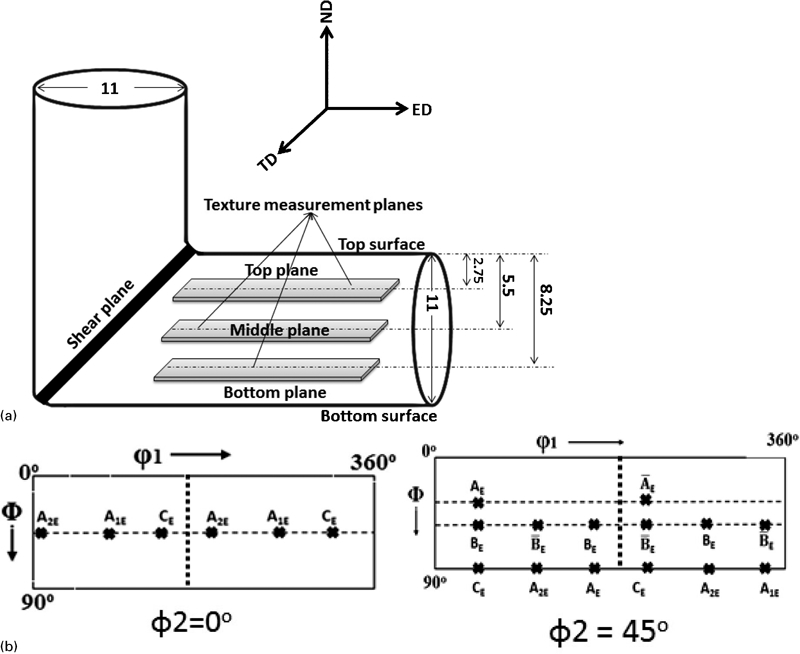
a schematic showing scheme of texture measurement for heterogeneity study with respect to ECAP reference system and b key orientation distribution function (ODF) sections representing ideal components for ECAP on extrusion direction (ED)–transverse direction (TD) projection plane (ND = normal direction): dimensions are expressed in millimetre
Characterisation of crystallographic texture
The bulk textures of the ECAP processed samples as well as the three starting materials were measured in a Bruker D8 texture goniometer with Schultz reflection geometry using Cu Kα (λ = 1·5406 Å) radiation. For the ECAP processed samples, the texture measurement was carried out from the TD–ED plane under all the four processing routes (Fig. 1a). It is important to note that the specimen size used for the present study is somewhat smaller as compared to the interaction volume of the X-ray measurement technique. However, the concept of a large sample size is applicable when there are not enough grains to sample in the irradiated area. In ECAP processed materials, the grain size is so refined that even an area of 15×8 mm is sufficient for texture measurement.4–10,30–34
In order to characterise the texture heterogeneity in different processing routes, the X-ray texture measurements were performed at three different regions in the thickness direction, i.e. at the top, middle and bottom of the samples. The top and bottom planes of texture measurement were taken along the thickness of the cylindrical specimens at 1/4 and 3/4 of the diameter. This is equivalent to depths of 2·7 & 8·1 mm from the top surface (Fig. 1a). Four incomplete pole figures, namely, (111), (200), (220) and (113), were recorded for each of the samples. The ODFs were calculated from the experimental pole figures by Labotex software using the ADC algorithm without any rotation or symmetrisation. Afterwards, the calculated ODF was rotated with respect to φ1 and Φ axes in a way that the recalculated pole figures were finally presented in the laboratory reference system projected onto the TD plane. This TD plane was initially parallel to the sample flow axis, and the ideal shear texture for ECAP processing is clearly visible in this plane. This measurement scheme was chosen to ensure ideal conditions of texture development. It has been reported by various researchers that the strain distribution and the resultant ECAP texture evolution is inherently heterogeneous in the ND–TD plane.24 In order to avoid this experimental difficulty, the currently applied texture measurement scheme is generally accepted.31 The ideal texture components that occur in the ODF sections of any ECAP processed materials are shown in Fig. 1b.28–30
Characterisation of microstructure
The microstructures of the three starting as well as ECAP processed materials were examined by transmission electron microscopy using a Philips transmission electron microscope at an accelerating voltage of 200 kV. The thin foil specimens were prepared from the middle of the specimens. Initial mechanical polishing was followed by twin jet electropolishing using a solution of 10 perchloric acid plus 90 methanol at 40 V. The temperature was maintained at −20°C during the course of electropolishing. The microstructural sizes (grain and particle sizes) were calculated from several TEM images (not <20 in each case) in order to obtain statistical reliability. The calculation was based on the linear intercept method using commercially available image analysis software (Sigma Scan Pro, Systat Software Inc., USA). The measurement was carried out by drawing numerous horizontal and vertical test lines at almost equivalent distances to obtain statistically averaged intercept values of not less than a 99 confidence level. Edge grains were also included in the measurement scheme. From the measured values, a cumulative distribution (in terms of number fractions) of intercept length was obtained. The weighted average along with the corresponding error value was calculated from the cumulative distribution. A proportionality constant of 1·56 was used to convert the average linear intercept lengths into the corresponding spatial sizes according to the ASTM standard E112-96.
Results
Microstructure and texture of the starting materials
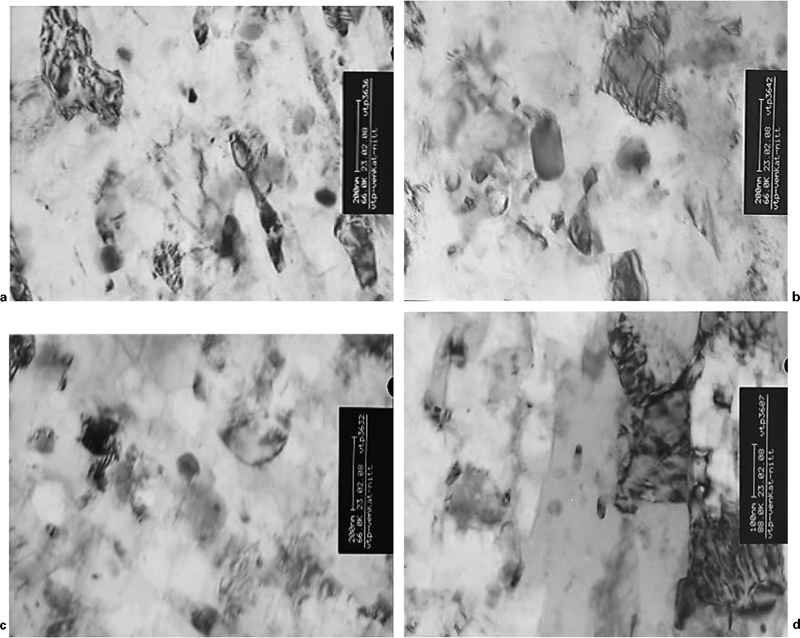
The microstructure of the starting material in the as extruded plus annealed condition consists of equiaxed grains of ∼3–4 μm size (Fig. 2a). It also contains fine precipitates of ∼90 nm size distributed throughout the Al matrix. The precipitates were identified as CuAl2 through elemental composition analysis by energy dispersive spectrometry technique (Fig. 2a, inset). The microstructure of the alloy in the ST condition consists of equiaxed grains without any CuAl2 precipitates (Fig. 2b). This suggests that the precipitates were dissolved in the matrix during the solutionising heat treatment. The grain size in this condition was ∼4–5 μm. After the solution treatment and aging, precipitates of ∼125 nm size reappeared in the Al matrix (Fig. 2c), which was coarser than those present in the as received material. These precipitates were also identified as CuAl2 by selected area diffraction pattern taken from one of the precipitates (Fig. 2d). The texture of the three starting materials is characterised by a fibre with 〈111〉∥ ED (not shown). The texture is reasonably symmetric and almost of the same intensity level irrespective of the three starting conditions. The details of the texture evolution in the three starting materials can be obtained elsewhere.36
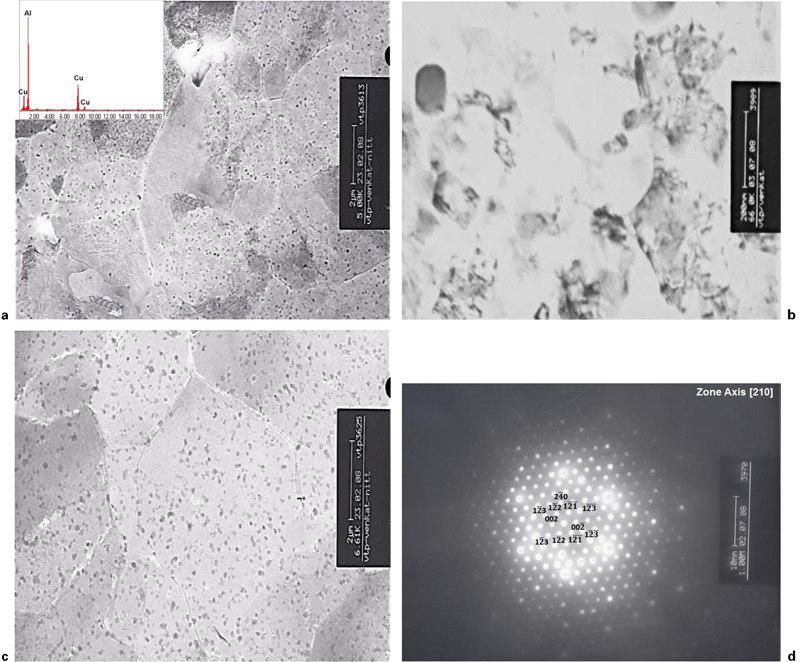
Bright field TEM images showing microstructures of starting materials before ECAP in a as received condition (inset: energy dispersive spectrometry analysis of precipitate phase), b after solution treatment c solutionised+aged condition and d selected area diffraction pattern obtained from precipitate phase shown in c
Texture evolution after ECAP
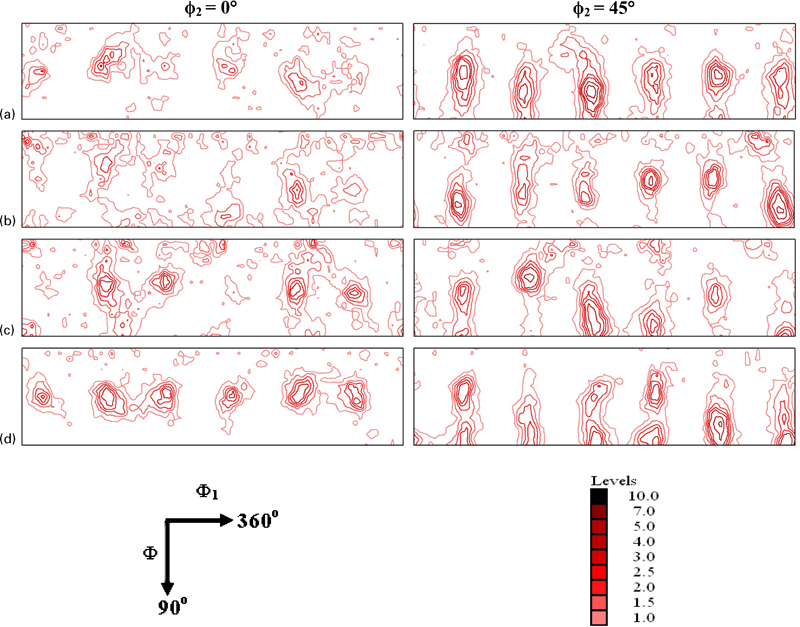
The important ODF sections (φ2 = 0 and 45°) for the three materials processed via different ECAP routes are shown in Figs. 3–5. The Euler space for monoclinic sample symmetry as observed in ECAP is defined with φ1 = 0–360°, Φ = 0–90° and φ2 = 0–360°. The ideal texture components after single pass ECAP processing differ from those for simple shear by an additional φ2 = 45° rotation, while the other two Euler angles remain invariant. The ECAP texture after multiple passes or via different routes is, however, not directly related to classical simple shear textures and is, therefore, much more difficult to characterise. The specimen undergoes shear deformation on three different planes and two different directions between subsequent passes during ECAP processing. Moreover, the strain in each pass is not monotonically applied in the same plane and in the same direction as opposed to simple shear based deformation processes. The ideal components, therefore, differ from the exact location in the Euler space, and this deviation is usually measured in the φ1 direction. The intensity and deviation of these ideal components are listed in Table 2. The  and
and  components have non-equal intensities at all conditions and processing routes, which signifies that the ideal positions are not self-symmetric.
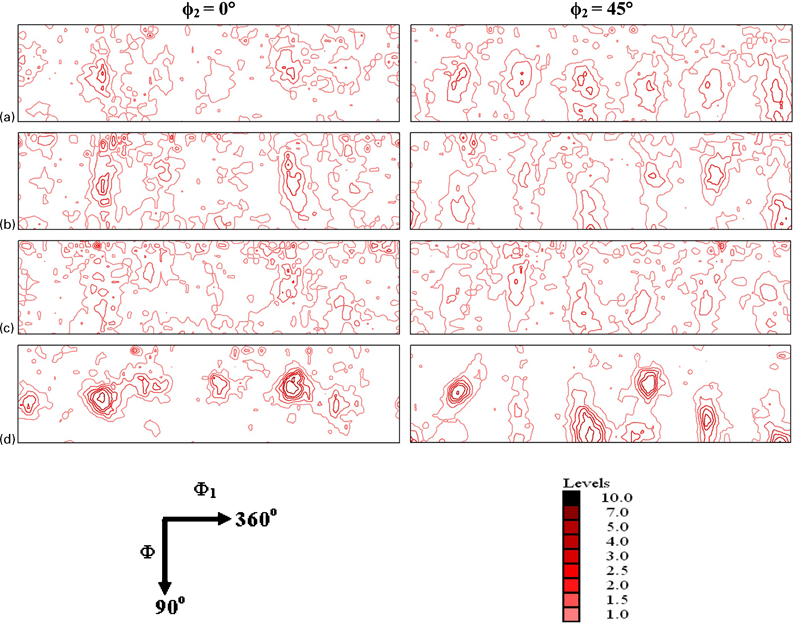
φ2 = 0 and 45° ODF sections for E+A condition after ECAP processing up to five passes through a A, b BA, c BC and d C routes: intensity level is shown at bottom
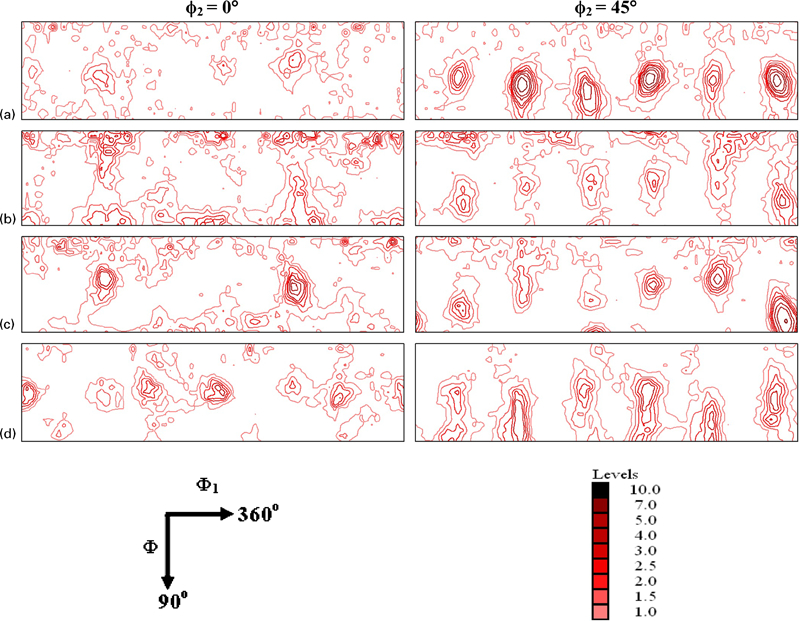
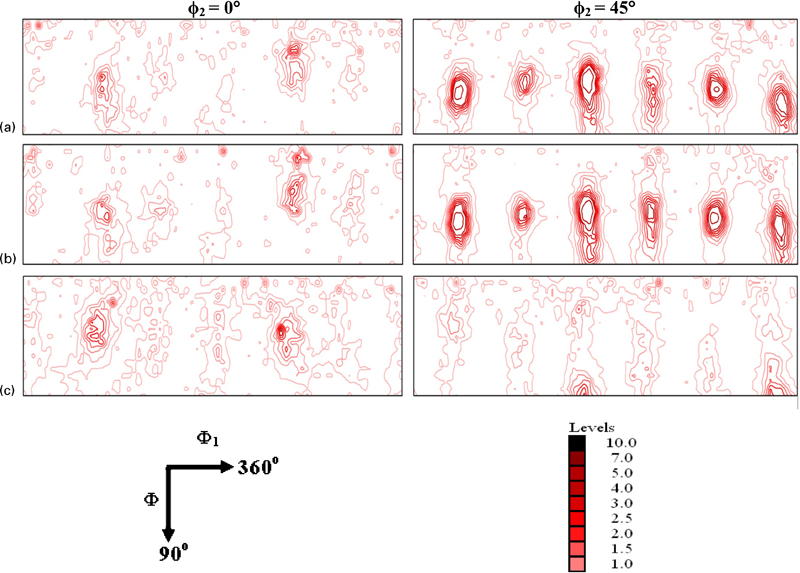
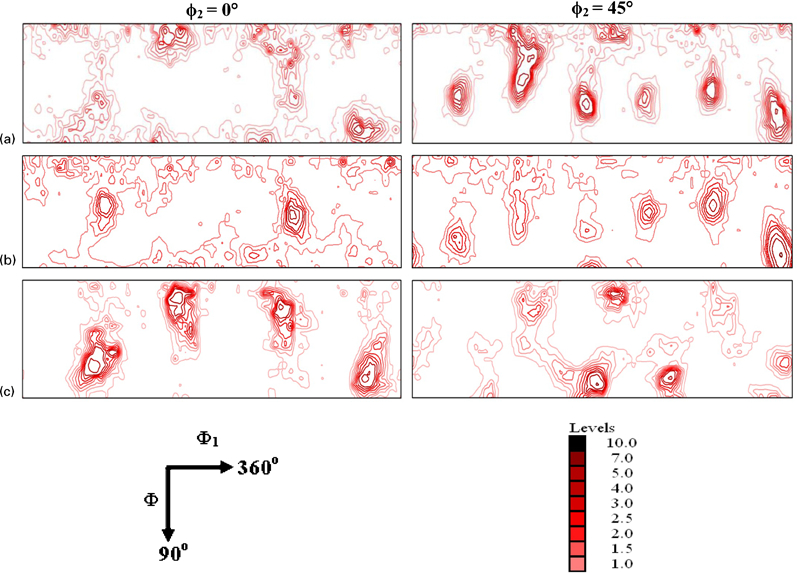
φ2 = 0 and 45° for ST condition after ECAP processing up to five passes through a A, b BA, c BC and d C routes: intensity level is shown at bottom
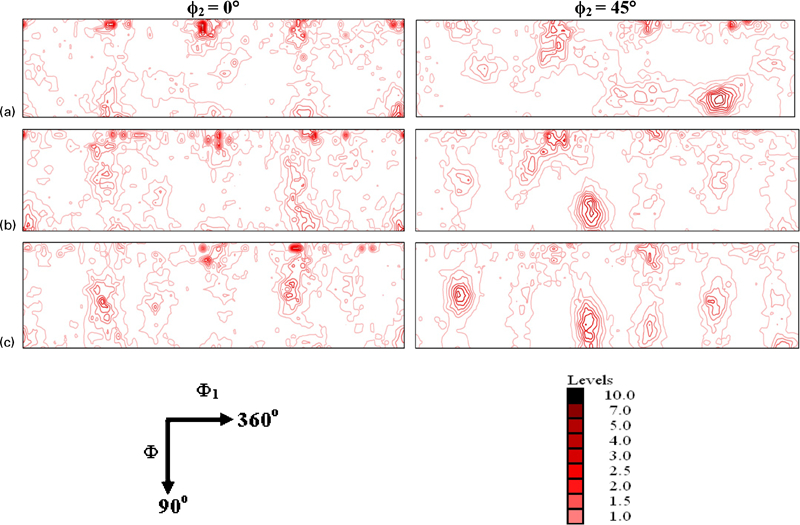
φ2 = 0 and 45° for ST+A condition after ECAP processing up to five passes through a A, b BA, c BC and d C routes: intensity level is shown at bottom
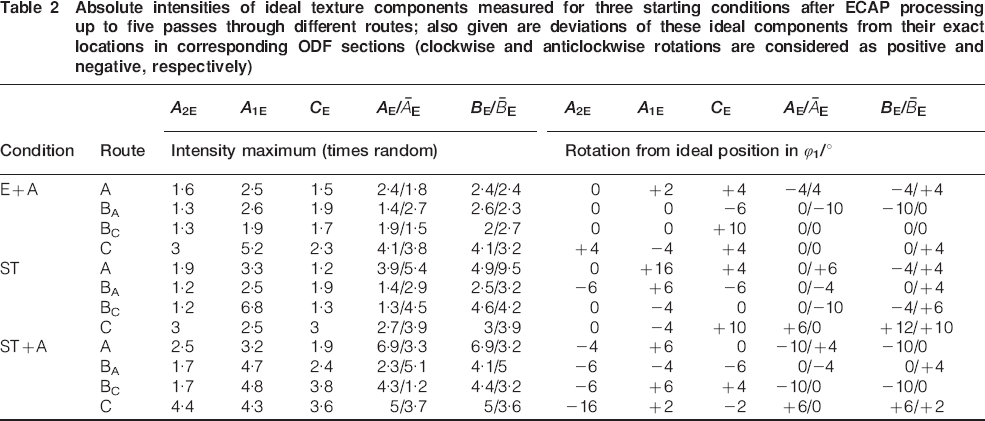
Absolute intensities of ideal texture components measured for three starting conditions after ECAP processing up to five passes through different routes; also given are deviations of these ideal components from their exact locations in corresponding ODF sections (clockwise and anticlockwise rotations are considered as positive and negative, respectively)
 E
E E
E E
E E
ETexture evolution in materials with E+A starting condition
In materials with an E+A starting condition, ideal components like A1E, A2E, and CE show a strong presence in the φ2 = 0° ODF section for route C (Fig. 3). Similarly, in the φ2 = 45° section, the  and
and  components are comparatively strong. In the case of routes A, BA and BC, these components are relatively weak in the φ2 = 0 and 45° sections. In simple shear based deformation, a continuous orientation distribution joins the AE, BE and CE components in the φ2 = 45° ODF section and is generally termed as B fibre. This fibre is relatively weak and non-uniform for routes A, BA and BC in the E+A condition. In route C, the B fibre is strong and continuous through the components AE, BE and CE. In the E+A condition, the shifts in ideal components from the exact locations are relatively low, except for the BE and CE components in routes BA and BC respectively.
Texture evolution in materials with ST starting condition
In materials with ST starting condition, the texture evolution for different processing routes follows a somewhat reverse trend compared to that of the E+A condition (Fig. 4). The components  and
and  , which are stronger for the E+A condition, substantially weaken for the ST condition in route C. On the other hand, these two components are the strongest in the ST condition after ECAP in route A. In addition, the A1E component substantially strengthens for route BC. The remaining components persist to be weak for all the routes. The shifts for the components from ideal locations are more pronounced in the ST condition compared to the E+A condition. The shifts are the most for the A1E component in route A and the
  component in route C.
Texture evolution in materials with ST+A starting condition
Texture evolution in materials with an ST+A starting condition as a function of processing routes is quite similar to that of the ST condition (Fig. 5). The strongest components are  and
and  in route A in this condition. However, the strongest
  component in the ST condition weakens in the ST+A condition after ECAP via route A. The B fibre is strong in route C in the ST+A condition. The deviation of components from the ideal location at the ST+A condition is comparatively larger than that for the ST condition. The maximum deviation was observed for the A2E component in route C, which shows an almost negligible shift in the ST condition. In conclusion, the
  and
and  components are predominant in route A for ST and ST+A as starting conditions.
Texture heterogeneity
The texture heterogeneity after ECAP through different processing routes for the ST 2014 Al alloy is shown in Figs. 6–9. A comparison of the corresponding ODF sections for the top, middle and bottom regions in the flow plane (XZ) indicates that the texture is heterogeneous for all the four processing routes. The intensities and the extent of deviation of the ideal components are presented in Table 3. In the case of route A, the texture is stronger in the top and middle regions than in the bottom region. In the top region, the components A1E and  are stronger compared to the other components. In the middle region, the strong presence of the
  component can be observed in addition to the A1E and
  components. The component A1E in the bottom region is relatively stronger than the other components. The deviation of the components from their ideal locations in the Euler space is less in the top and middle regions than that in the bottom region. The maximum deviation is observed for component A1E of the middle region.
φ2 = 0 and 45° ODF sections for a top, b middle and c bottom planes of ECAP processed specimen. Starting material was in ST condition, and ECAP processing was carried up to five passes through route A. Intensity level is shown at the bottom
φ2 = 0 and 45° ODF sections for a top, b middle and c bottom planes of ECAP processed specimen. Starting material was in ST condition, and ECAP processing was carried up to five passes through route BA. Intensity level is shown at the bottom
φ2 = 0 and 45° ODF sections for a top, b middle and c bottom planes of ECAP processed specimen. Starting material was in ST condition, and ECAP processing was carried up to five passes through route BC. Intensity level is shown at the bottom
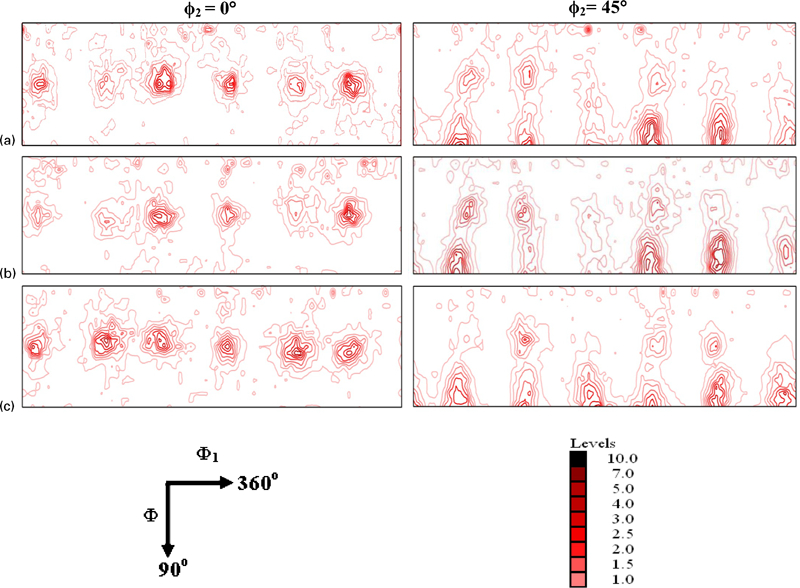
φ2 = 0 and 45° ODF sections for a top, b middle and c bottom planes of ECAP processed specimen. Starting material was in ST condition, and ECAP processing was carried up to five passes through route C. Intensity level is shown at the bottom
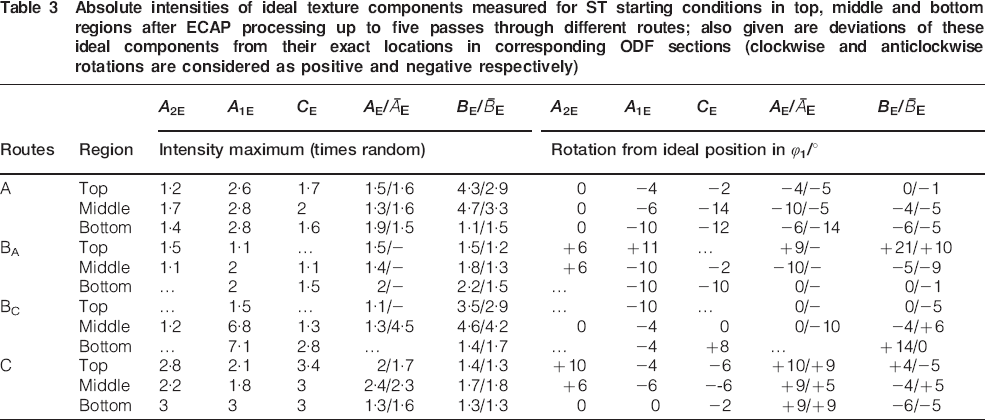
Absolute intensities of ideal texture components measured for ST starting conditions in top, middle and bottom regions after ECAP processing up to five passes through different routes; also given are deviations of these ideal components from their exact locations in corresponding ODF sections (clockwise and anticlockwise rotations are considered as positive and negative respectively)
 E
E E
E E
E E
EIn the case of route BA, the texture is stronger in the middle than in the top and bottom regions. The  ,
,  and A1E components are stronger in the middle region than in the others. The CE and
  components are completely absent in the top region. Similarly, the A2E and
  components are completely absent in the bottom region. The deviation from ideal locations is high for most of the components in the top and bottom rather than in the middle regions. The maximum deviation is observed in component BE in the top region and components A1E and CE in the bottom region.
For route BC, a strong texture is present in the top and bottom regions although the components show a large deviation from their ideal positions. In addition, a few components are completely absent while the A1E and BE components show the maximum deviation in these regions. Component A1E is, however, strongest in the bottom region. The extent of deviation for the ideal components is low in the middle region. The  ,
,  and A1E components in the middle region show a stronger intensity than the other components. The deviation of ideal components is also lower in the middle region.
The texture in route C is less heterogeneous compared to the other three routes. All the ideal components appear in the top, middle and bottom regions. In this case, the deviation from the ideal locations is almost similar in these three regions. The texture is relatively stronger in the middle region. The components CE in the top region,  in the middle region and A2E in the bottom region are stronger than the other components. The maximum deviation is observed for the components A2E and
  in the top region, CE in the middle region and
  in the bottom region.
Microstructural evolution after ECAP
The TEM bright field images of E+A, ST and ST+A conditions after ECAP through routes A, BA, BC and C are shown in Figs. 10–12. The microstructural sizes (grain and precipitate sizes) are listed in Table 4. In the E+A condition, the grains are elongated for the processing routes A, BA and C (Fig. 10a, b and d). In route BC, however, the grain morphology changes to near equiaxed (Fig. 10c). The fine precipitates present in the starting material completely dissolve in the matrix after ECAP, irrespective of the processing routes followed. The grain size after ECAP is highest in route C (∼370 nm) and almost similar for routes A and BA (∼280 nm). The maximum refinement in grain size is observed for route BC (∼250 nm).
Bright field TEM images showing microstructures in E+A condition after ECAP processing through routes a A, b BA, c BC and d C
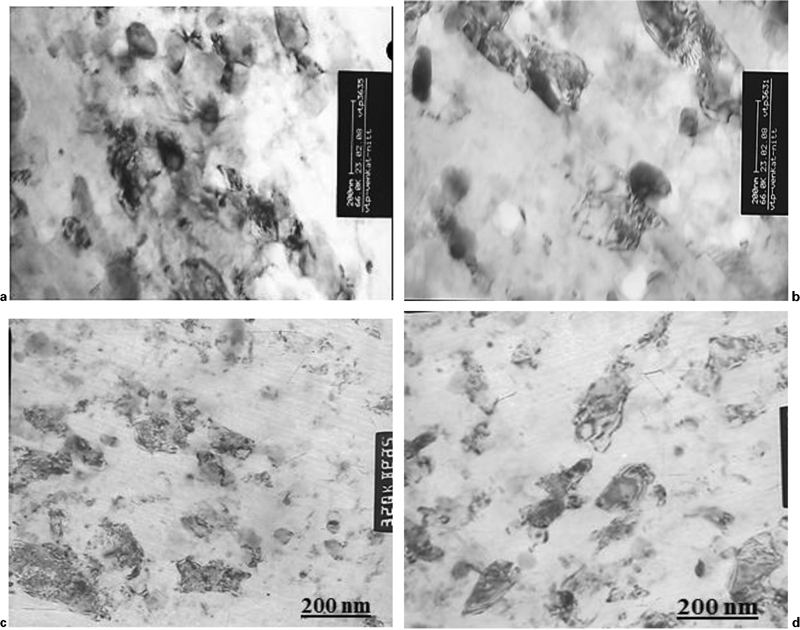
Bright field TEM images showing microstructures in ST condition after ECAP processing through routes a A, b BA, c BC and d C
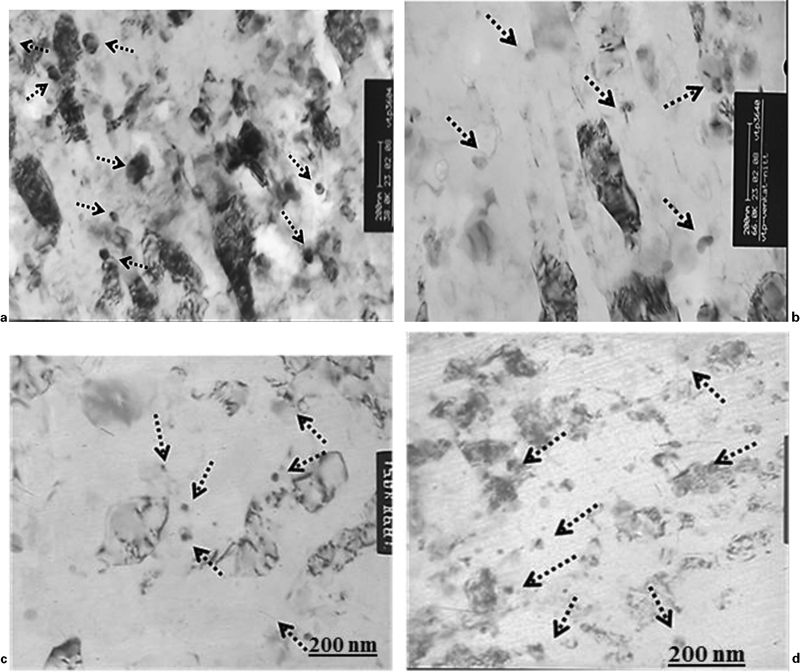
Bright field TEM images showing microstructures in ST+A condition after ECAP processing through routes a A, b BA, c BC and d C: arrows indicate presence of precipitate phase
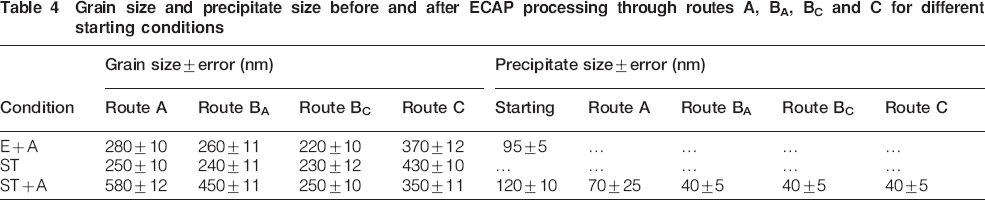
Grain size and precipitate size before and after ECAP processing through routes A, BA, BC and C for different starting conditions
In the ST condition, the grains are elongated after ECAP for the processing routes BA and C (Fig. 11b and d). The grain boundaries appear distorted for the material processed via route A (Fig. 11a). In route BC, the grains are mostly equiaxed, although a few fine elongated grains are present in the microstructure (Fig. 11c). The matrix is completely precipitate free after ECAP. The lowest grain size is obtained for route BC (∼230 nm). As in the E+A condition, the maximum grain size is observed for route C (∼430 nm). The grain size obtained for routes A and BA (∼250 and ∼240 nm respectively) is comparable to that for route BC.
The microstructure of the ST+A material after ECAP shows the presence of fine precipitates throughout the Al matrix for all the processing routes. The grains are mostly elongated, and the grain boundaries are distinct for processing routes A, BA and C (Fig. 12a, b and d). In processing route BC, the grain appears to be more or less equiaxed (Fig. 12c). The coarser precipitates present before ECAP in the ST+A material are completely fragmented and distributed in the matrix. As in the other two conditions, the grain size is lowest for route BC (∼210 nm). However, unlike in the previous conditions, the least refinement occurs when the ST+A material is processed via route A (∼580 nm). A slightly higher refinement is observed when the processing is carried out in route BA (∼450 nm) or route C (∼350 nm). The precipitate size significantly reduces after ECAP through routes BA, BC and C (40 nm) compared to that in the initial material.
Discussion
Effect of starting microstructural conditions on strength of texture
As described in the section on ‘Texture evolution after ECAP’, the intensity of ideal texture components varies as a function of starting microstructural conditions. The stronger texture evolution in solutionised material can be attributed to the higher strain hardening of the matrix due to the higher amount of solute.37 In the E+A and ST+A material, the weaker texture is due to the dissolution and fragmentation of precipitates, which results in significant strain scattering during ECAP.38 The fragmentation of precipitates leads to a strain gradient across the deformation zone. As a result, the texture components substantially deviate from their ideal position.
Effect of processing routes on texture evolution
The ODF sections reveal important differences between routes A and C in terms of the component  , which is quite significant in the former but very weak in the latter specimen. It is important to note that the evolution of texture may be quite different among the four different routes, particularly for the first few passes when the initial texture is strong.39 In route A, the main component is A1E,38 while the subsequent strengthening of the
  components occurs for a strong initial texture.29 Similarly, in the present study, a strong
  component forms due to the strong initial texture present in the three starting materials. If a monoclinic symmetry of straining is present throughout the ECAP process, the intensities of the components AE and
  and BE and
  must be equal. However, in route A, the monoclinic symmetry exists up to only four passes and is lost afterwards due to the inhomogeneous deformation in the sample (Fig. 13).19,29
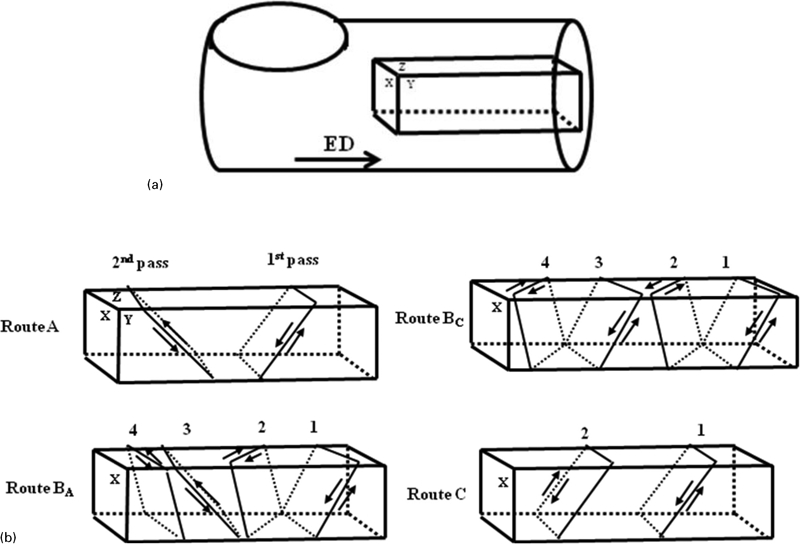
Schematic showing a ECAP specimen symmetry in terms of three orthogonal planes and b shearing patterns as applied during ECAP through different routes37
In route C, the texture evolution exhibits monoclinic symmetry because of the twofold symmetry around the TD axis along the ED.24 The shear plane, therefore, oscillates between opposite directions in successive passes. This moves the initial texture along the B fibre line, and the final texture can be regarded as a rotated variation of the starting texture, wherein an even number of passes would resemble the initial texture and an odd pass would resemble the first pass texture. The components A1E, CE,  and
and  are most prominent in route C, as has been reported by Suwas et al.39
The texture evolution in routes BA and BC is usually different from routes A and C. The components  and
and  are strong in the ST and ST+A conditions. In route BC, the monotonic rotation of 90° in the same direction between successive passes means that the initial monoclinic symmetry of deformation no longer exists after the first pass (Fig. 13).24 This moves the initial texture components into different positions in the Euler space as compared to much simpler routes like A or C. In route BC, the texture components, therefore, rotate between successive passes around an axis that is different from the texture symmetry axis of the process.24 Thus, the final texture developed in this route strongly depends on the number of passes. The generation of a strong
  component in route BC can be explained on the basis of a flow field of deformation, which describes the evolution of a B type texture during deformation.29,31 The texture evolution in route BA is difficult to characterise and depends mainly on the total number of passes. It is important to note that the texture evolution in processing route BA has not been documented yet. In the present study, the evolution of stronger A1E and
  components for all the three microstructural conditions indicates that the texture evolution is similar to that in route BC.
Effect of processing routes on texture heterogeneity
It is quite well established that inhomogeneous deformation usually persists over the specimens during ECAP processing due to several factors (e.g. specimen rotation, friction, etc.).40 Because of such inhomogeneous deformation in every pass, the evolution of texture in the top, middle and bottom regions of the specimen becomes distinctly different in each processing route, especially for a multipass ECAP process. In the present study, inhomogeneous deformation and strong heterogeneity in texture evolution are observed in the top, middle and bottom regions of the ECAP processed specimens irrespective of the starting conditions or processing routes. The severity of this heterogeneity is much less for route C than for route A, BA or BC.
The intensity difference of the corresponding ideal components in the top, middle and bottom regions is comparatively higher in the case of route A than in other routes. The origin of such texture heterogeneity in route A has been explained by Skrotzki et al.32 on the basis of the flow line model. For the constant thickness of the plastic zone that lies around the intersection plane of the die, the shape of the flow lines does not remain the same. In the upper part, the flow lines are more rounded. The plastic strain increases as the distance from the centre of the specimen increases. During multipass ECAP, since no specimen rotation is involved with this route, no exchange of the top, middle, bottom and side layers occurs between successive passes unlike in routes C, BC, and BA.41 As a consequence, the texture strengthens with the number of passes at a faster rate in route A than in the other routes.
Although the maximum tolerance for the deviation of ideal components is considered to be as high as 15°, certain components are completely absent in routes BA and BC in the top and bottom regions, in contrast to the middle region. In these two routes, the outer regions change their orientation with respect to the die wall between successive passes so that an outer region of different microstructure and texture from the centre is created in every pass.24 The texture in the middle remains unchanged while that in the outer regions is strengthened in the subsequent passes.
In route C, the upper and bottom regions have a similar texture that is different from that of the middle region. Since the bottom and top regions are interchanged between the passes in route C, the effect of any deformation heterogeneity diminishes for this processing route.42 The reduction rate at the top and bottom is, however, slower than that observed at the centre.
Conclusions
In the present study, the effect of the processing routes on the microstructure and texture evolution during ECAP of the 2014 Al alloy with varying starting microstructural conditions is examined. The important conclusions are summarised below.
The ECAP of as received, ST and ST+A materials through different routes leads to significant grain refinement and precipitate fragmentation after ECAP up to five passes. The amount of refinement is the lowest in ST+A material compared to that of the as received and ST material for all the processing routes.
The strength of texture evolution strongly depends on the starting material condition for all four processing routes. The strength of ECAP texture varies in the order E+A<ST+A<ST, which is attributed to the strain scattering ability of the precipitates under imposed deformation conditions. The higher the strain scattering (E+A and ST+A conditions), the weaker the final texture evolution after ECAP.
The texture evolution during ECAP strongly depends on the processing routes. The texture developed in route A is stronger than in the other processing routes due to the monotonic nature of strain path for this route. The presence of strong components like  and
and  is observed for all processing routes.
The texture after ECAP is heterogeneous from the top to the bottom of the specimens after ECAP irrespective of the processing routes or starting conditions. The heterogeneity is minimal for route C and maximum for route A.
Footnotes
Acknowledgements
The authors are thankful to NRCM, IISc, Bangalore. They express their sincere gratitude to the Institute X-ray Facility at IISc, which was used for texture measurement. The help rendered by Dr N. Gurao of IISc during the analysis of the texture results is also acknowledged.