
Abstract
A semi-empirical model was developed to represent a carbon in leach/carbon in pulp (CIL/CIP) circuit for recovery of gold and silver. The model uses a simple two rate representation of the leaching kinetics. Parameters for the leaching kinetics may be obtained by sampling the feed to a circuit and the tailings from each tank and assaying the solids for both gold and silver to obtain the assay profiles of the solids down the tanks. The parameters in such a leaching model would be expected to be a function of the ore type, the grind, cyanide concentration, whether oxygen was used and the general chemical environment. The leaching parameters are primary inputs to the model for any simulation. Standard power law relationships are used express the practical equilibrium between the gold and silver cyanides adsorbed on the active carbon and the tenor of the solution. There is an underlying assumption that the residence of time of carbon in the tanks is sufficient for the carbon loading and solution concentration to be close to equilibrium. The parameters for this relationship are also derived from plant data. The model was constructed by writing a mass balance for gold and silver in and out of each tank in the train and for the circuit overall. Other inputs to any simulation are the feedrate of ore, per cent solids of the slurry in the tanks, gold and silver loadings of the input ‘barren’ carbon and the rate of movement of carbon through the circuit counter current to the slurry. With appropriate practical parameters, the simulation is able to reproduce typical tank profiles.
Introduction
The leaching of gold and silver by cyanide and counter current adsorption of the cyanide complexes on activated carbon is a well established technology. In essence, the process is simple. Values are leached from finely ground ore by cyanide under alkaline conditions in a series of well stirred tanks. Freshly activated carbon, with a much larger particle size than the ore, is introduced into the final tank in the train. Typically, the carbon is retained in any tank by suitable screens and is intermittently progressed up the bank by some type of gentle pumping system and is finally removed from the slurry for desorption of the values. Not all tanks are necessarily used for both leaching and adsorption. The carbon may be finally removed for stripping before reaching the tank at the head of the bank so that one or more of the initial tanks may be used in a leach-only mode (Fig. 1).
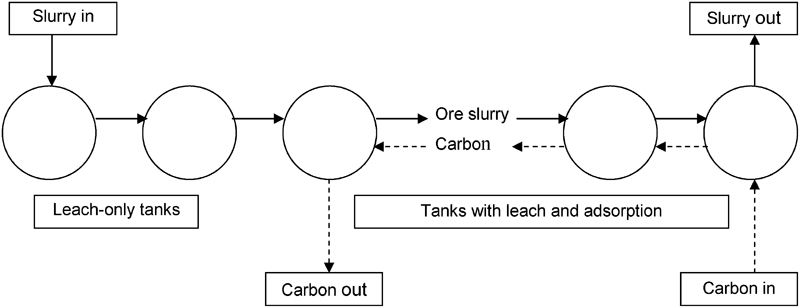
‘Hybrid’ carbon-in-pulp (CIP) circuit with two ‘leach-only’ tanks
Despite the intrinsic simplicity of the process, interaction of the design and operating variables may be very complex so that it is not easy to intuitively predict the results of an operational or configuration change. The model was developed to assist in making decisions about circuit changes, to help identify anomalous behaviour and to provide insight on the influence of the major variables for guidance in design and operation of a CIP/CIP circuit.
The focus in this modelling is on design and operational parameters using a model fitted to a real plant. This is in contrast to modelling, derived from laboratory studies, of the detail of the actual leaching and adsorption processes as others have performed (Srithammavut, 2008; Parker Centre, 2008). The use of the model in plant optimisation is described in Part 2 (Stewart, 2012).
It is also distinct from the carbon-in-leach (CIL) plant modelling reported previously (Stewart, 2010a, b) whereby allowance could be made for delay and mixing in the plant so that valid performance data could be obtained from 8 or 12 h shift samples despite plant residence times of the order of 20 h.
Model
The model used in this study is a simple representation of the leaching and adsorption system. The model has been structured so that all required parameters may be derived from readily obtainable plant data and thus easily tuned to any particular plant.
There are three primary elements in the model – the representation of leaching as a two rate system, the power law equation relating equilibrium solution concentration and carbon loading and the mass balance constraints across each tank and the bank as a whole.
Leaching
The representation of values in the ore as consisting of a fast leaching component and a slow leaching component is similar to the way in which flotation has been analysed and modelled (Cameron et al., 1971; Imaizumi and Inoue, 1965). While it is not claimed that this is a rigorous physical representation of the leaching properties of an ore, nonetheless it provides a convenient empirical way of representing the leaching behaviour and so long as it matches the leach profile over the range of leaching times under consideration then valid simulations may be obtained (Fig. 2). With some ores an additional parameter could be justified to represent a fraction of the values which cannot be leached at all. Such a situation was not considered in this work.
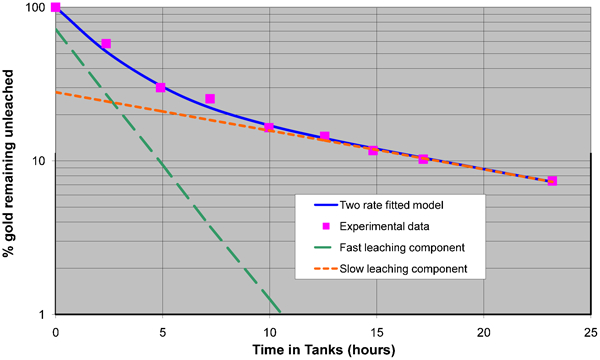
Leaching model for gold fitted with two components (typical data)
In a batch leaching situation
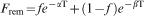
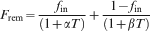
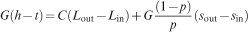
It follows from this that if tanks are fully mixed, then in a continuous flow situation, where fin is the fraction of fast leaching material entering, the fraction of values unleached in any tank is
Unexpected deviations from a normal leaching profile may be due to lack of cyanide or aeration (or oxygenation) deficiencies. Identification of such deviations may be obscured by short term variations in ore (order of hour to hour) changing the material from which the contents of any tank have been derived.
In order to fit the model to any circuit, data must therefore be obtained by sampling the feed to the circuit and the tailings from each tank. A series of campaigns may be required to obtain sufficient data to accommodate short term changes in parameters due to variations in head grade and ore type. The number of such ‘runs’ needed to obtain reasonable averages may be reduced by sampling each tank in succession with a delay which allows for the residence time of slurry in each tank, thus removing a large part of the dynamic effect of short term changes in ore properties and feedrate. The solids, solution and carbon in all samples are assayed for both gold and silver to give the assay profiles for both components down the bank on each occasion. If it is desired to extrapolate simulations reliably to a more barren tailing, the leaching data may be extended by bottle rolling final tails for an additional period or special plant runs may be performed at reduced feedrate. Adjustment can be made for the difference between continuous flow and mixed conditions in a tank and batch conditions in a bottle.
Carbon adsorption
Ideally the sampling of solution and carbon would be taken immediately prior to the movement of carbon on to the next tank up the train. In this way the carbon will have had maximum opportunity to equilibrate fully to the solution concentration in a tank. In practice because of head grade variations the solution concentration in a tank does not remain steady and timing sampling to correspond to carbon movement is difficult to coordinate. However, if the approach of the carbon to equilibrium loading in any tank after movement occurs at a reasonable rate (e.g. within a few hours), then there may be quite a big window for satisfactory samples to be obtained. While active carbon adsorption rates from pure solutions in the laboratory may occur quite rapidly (order of minutes) in a plant with solids concentration of ∼40%, the activity of the carbon as measured under laboratory conditions has only a secondary influence as adsorption rates are largely controlled by the mixing in the tanks and diffusion through the boundary layer close to the available carbon particles.
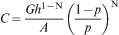
As concentrations of the gold and silver as cyanides in solution (up to 40 g t−1) and on the carbon (<3%) are relatively low, the adsorption of gold and silver on active carbon in the model has been represented by the Freundlich equation (Treybal, 1955)

Mass balance
Values enter the circuit primarily contained in the ground ore fed to the circuit. Water being recycled to the circuit may contain values, especially water returned from a thickener which is intended to recover unused cyanide and values which would otherwise be lost in solution in the tailings. Regenerated carbon may also contain some residual values. The mass balance for the circuit and for any tank may be written as follows
These equations were programmed in Excel, solid and solution grades in the tailings from one tank being the input to the next and the carbon output from one tank being the carbon input to the preceding tank. The number and function (leach-only or leach and adsorption) of the tanks was set in any version of the programme and the tank sizes could be input. Additional normal inputs apart from the leaching and adsorption parameters were the feedrate of ore, the per cent solids in the slurry, the carbon advance rate and the residual loadings of the regenerated feed carbon. If the effect of return of water containing values being recycled from a thickener was being explored then a further input was the fraction of water in final tails which was recycled. A direct analytical solution of the complex equation set cannot be obtained readily, so the circuit was generally solved by progressive approximation of the solution concentration of the final tails. Alternatively, the final solution concentration for either gold or silver could be chosen and one of the other operating variables changed to give the selected concentration.
Some mass balance considerations
The overall mass balance provides some preliminary insights into the primary relationships between the main operational variables. A key design and operating consideration is selecting a carbon advance rate. If a particular loading is targeted for say gold, then a corresponding advance rate would be

The fractional recovery R, in the circuit is


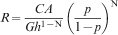
As N is typically in the range 0·65–0·85, the value of R proves to be relatively insensitive to the head grade h, a doubling producing only a change of ∼20% in R. In contrast, the recovery from solution may be very sensitive to pulp density, an increase in p of 6% from say 40 to 46% increases R by ∼20%.
These general considerations form a background for the simulation studies which embody a more detailed and precise representation of the whole leaching and adsorption circuit.
Model parameters
A standard set of parameters were used in most simulations with the model. The leaching parameters are shown in Table 1 below. These were derived from a range of plant data obtained from surveys of gold and silver in the solids and solution, and carbon loadings from tank to tank. The parameters represent an ore in which the gold leached readily but the silver, in contrast, was more resistant to extraction. The surveys encompassed a range of feedrates, plant configurations with seven or ten tanks in series and operation with and without oxygen addition.
Leaching parameters
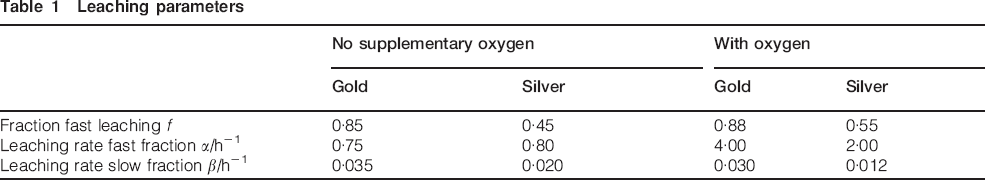
The effect of oxygen addition on the parameters is typical of the data examined. There is a relatively small increase in the fraction which is fast leaching, a major increase in the rate at which this fraction leaches and a decrease in the leaching rate of the slow leaching fraction. The leaching profiles generated by these parameters are illustrated in Fig. 3 below. These are for an ore feedrate of 209 t h−1 at 38% solids to a series of tanks of 840 m3 active volume. The residence time in each tank was very close to 2 h.
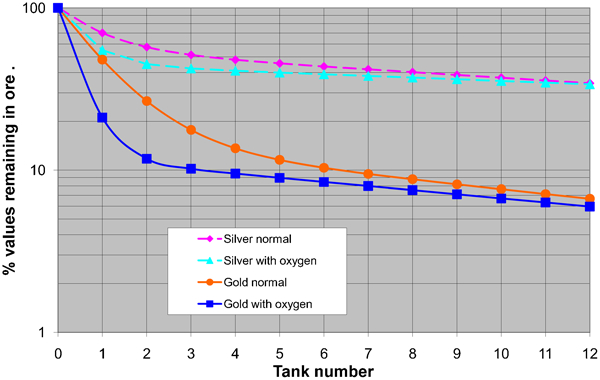
Standard leach profiles used in models
While the initial leaching is much quicker with oxygen, in one tank with oxygen almost as much leaching occurs as in three tanks without oxygen, surprisingly after 12 tanks (24 h) the final amount leached was found to be little more with oxygen (0·7% additional recovery for gold and 0·5% more for silver). As the number of tanks is reduced the differences with the use of oxygen are increased.
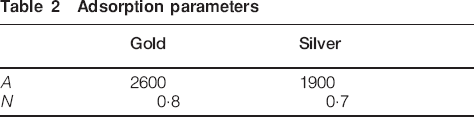
Adsorption parameters used in the standard simulation with the model are given in Table 2 below. The parameters are scaled for expressing the carbon loading and solution concentrations in g t−1. They represent the adsorption of active carbon which is a seasoned inventory, i.e. carbon in a plant which has been in operation for a sufficient period for the carbon to have reached the equilibrium blend from carbon which has been regenerated many times through to fresh make up carbon.
Adsorption parameters
The adsorption relationships are shown in Fig. 4 below for a normal range of carbon loadings.
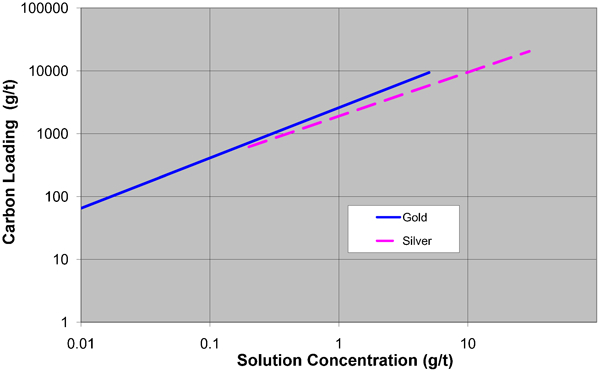
Adsorption relationships
These relationships were developed for ores where there were no important quantities of competing species (other metal cyanides) and show that, in general, gold was more readily adsorbed than silver.
The ‘standard’ ore being processed in the simulations was presumed to have 5 g t−1 gold and 35 g t−1 silver. Feedrates and residence times were generally kept in a range such that recoveries of gold would be >85% and silver 30–70%. Thus feedrates were generally 150–300 t h−1, slurry ∼38% solids and total slurry residence times of about 14–30 h. Carbon advance rates were generally constrained to maintain a carbon loading of at least 2000 g t−1 and were typically in the range of 6–10 t/day.
While the model studies illustrate behaviour characteristic of CIL/CIP plants and generate some broad principles of circuit design and management, decisions in relation to any particular plant will be very dependent on head grades, the actual range of leaching rates for any ore, the adsorption parameters pertaining to a seasoned carbon inventory, metal prices and the cost of any indicated changes. However, in this study, a particular percentage change in silver recovery would currently have only about one eighth of the value of the same percentage change in gold recovery with current gold and silver prices (Au, $1600; Ag, $28).
Carbon advance rate
Carbon advance rate impacts directly on the overall mass balance and hence on solution loss. Using equations (3), (5) and (7), the theoretical minimum carbon rate is given by
Conclusion
A simple semi-empirical model of a CIP/CIL circuit was developed to provide insights into the complex interactions in a leaching and adsorption plant for gold and silver. The model used a simple representation of leaching in which the values were considered to consist of fast and slow leaching components and adsorption on active carbon was represented by a power law relationship between solution concentration and carbon loading.
Parameter values for use in the model were obtained from a series of plant surveys of gold and silver in the solids and solution and carbon loadings from tank to tank. The surveys encompassed a range of feedrates, plant configurations with 7 or 10 tanks in series and operation with and without oxygen addition. The model was found to give a realistic representation of plant performance over a wide range of conditions.
Footnotes
Acknowledgements
The model was developed, while the author was employed at the Chatree Gold Mine, Thailand. The permission of the mine to publish this paper is gratefully acknowledged.
The author would also like to acknowledge the support and assistance of colleagues, who collected much of the data on which the concepts embodied in the model were based and who were always happy to discuss any of the applications or practical aspects in early development of the model. In particular I express my gratitude to Natsima Phunmuang, Kritsana Kritsanaphak and David Morrison.
This paper was originally presented, together with Part 2 (Stewart, ![]() ), at Metallurgical Plant Design and Operating Strategies (MetPlant) 2004, 6–7 September 2004, Perth, Western Australia. It has been subsequently peer reviewed and revised for publication in Mineral Processing and Extractive Metallurgy with the kind permission of the Australasian Institute for Mining and Metallurgy.
), at Metallurgical Plant Design and Operating Strategies (MetPlant) 2004, 6–7 September 2004, Perth, Western Australia. It has been subsequently peer reviewed and revised for publication in Mineral Processing and Extractive Metallurgy with the kind permission of the Australasian Institute for Mining and Metallurgy.
This paper is part of a special issue on Australian gold processing