
Abstract
This paper describes the modelling and durability assessment of an elastomeric component used in rail vehicles. Components and structures are modelled using finite element analysis and the fracture mechanics parameters are obtained and used to calculate fatigue life. For the fracture mechanics approach, the damage model is represented by the relationship between the rate of crack growth and the strain energy release rate or tearing energy. Suitable materials tests are required to define the damage model and these will be described together with typical test results. The methodology will be illustrated using the example of a spherical bearing that is a critical component in a rail coupling joint and is subjected to a complex set of fatigue loadings. The analysis methodology enabled the various parts of the fatigue loading to be assessed and the most damaging contributions and mode of failure to be identified. The approach also enabled a redesign of the component to be performed and validated and a significant increase in operating life was demonstrated.
Introduction
The fracture mechanics approach based on the classical Griffith's energy principles as modified by Thomas1, 2 has been used to predict the fatigue life of polymeric components including elastomers, structural adhesives and composites.3–5 This paper demonstrates the application of a fracture mechanics based approach in combination with finite element modelling techniques to predict the fatigue crack growth in an existing design of elastomeric spherical bearing and then using the same techniques to modify the design to extend the fatigue life of the bearing. Busfield et al.6 have used the same approach to predict the fatigue life of a gearbox mount.
The component used in this study is a spherical bearing (Fig. 1) which is part of a coupling joint used to connect the train bogies. The spherical bearing consists of an elastomeric layer bonded to a steel inner and outer. During service the spherical bearing undergoes axial, rotational and translational loadings. The expected design life of the spherical bearing is 10 years; however, considerable cracking of the elastomeric layer was found on many bearings after 1–2 years of service, resulting in the need to replace the components on a large fleet of trains. In some instances, there was significant damage after only 6 months in service.
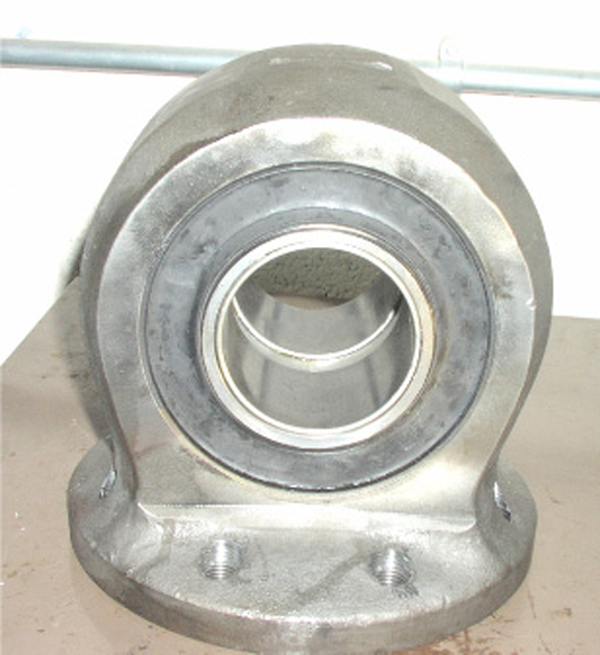
Spherical bearing
The coupling design is inherently fail safe since it does not allow separation of the bogies during service since the central pin runs through the centre of the main casing. However, the damage to the rubber layer does cause significant shock loadings to be transmitted to the bogies when the pin moves through the central position, often at relatively high velocity. This shock loading can be felt by the passengers as well as potentially cause damage to other parts of the bogies.
The main objective of the study was to use analytical techniques along with experimental testing to investigate the causes of the cracking found in the bearings and to propose design changes to either completely eliminate the cracking of the elastomeric layer or limit the crack growth to a level to maintain the integrity of the coupling.
Initially a baseline fatigue analysis of the existing design of the spherical bearing was performed. The results obtained from this analysis were used to affect design changes so that required life of the bearing can be achieved. Necessary material models required to perform the analysis were derived from experiments. Quasi-static and fatigue testing of the existing and modified designs was performed to assess the relative performance of the designs and to correlate analytical results with experimental data.
The fracture mechanics approach begins with a stress analysis of an undamaged component to investigate the likelihood of failure and to determine the predicted locations by interrogation of the predicted stresses and strains.7 A crack analysis is then performed by introducing cracks in the model at locations where cracks are predicted to initiate and propagate. The criterion for the crack growth in this approach is the maximum tearing energy or strain energy release rate; crack growth will occur in the location and direction of the maximum strain energy release rate.
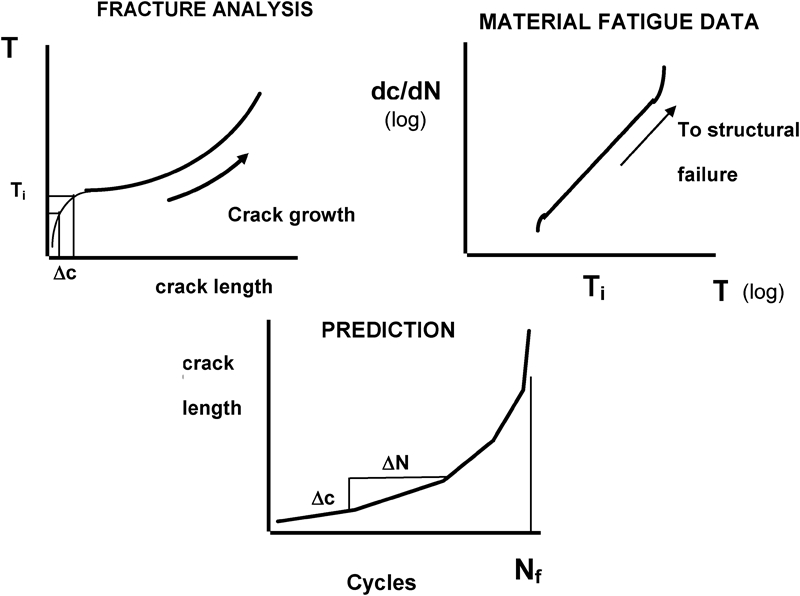
The fracture mechanics prediction procedure is summarised in Fig. 2. The first step is to analyse the component to obtain a relationship between tearing energy T and crack length c under in service loading conditions. A fatigue crack growth model for the material which defines the relationship between the rate of crack growth and tearing energy is obtained from experiments.8, 9 For an initial crack length, a value of T is obtained. This is compared with the material's fatigue crack growth model to obtain the crack growth rate dc/dN. For an incremental number of cycles, the increment in crack length is determined. This gives a new value of T from the T–c relationship and a new value of dc/dN. This continues until the crack grows to a critical length, leading to a number of fatigue cycles to failure at the given load.
Fracture mechanics approach
Several methods are available for calculating the strain energy release rate or tearing energy. There are however, two main methods of calculating strain energy release rate using finite element analysis (FEA), once the location and orientation of the crack are assumed. First, strain energy release rate can be obtained by the energy difference method by allowing the crack to grow and computing the change in the global strain energy and the change in the crack area. In the second method, the tearing energy is calculated through the J integral. Calculation of strain energy release rate in most finite element codes is performed as a separate post-processing function. The simplest of these is the energy difference technique. In this method the strain energy from two solutions is calculated. First, an analysis of the structure is carried out with a given crack length under given loading conditions and the total energy obtained. A second analysis is then carried out with a small increase in the crack length and new total energy is obtained. From the energy difference of the two runs, the tearing energy T is obtained for the change in area associated with the given increment in crack length as

Using the finite element model of the spherical bearing, a crack analysis has been carried out. The crack analysis initially concentrated on determining the location where cracks are likely to initiate and the direction in which they are likely to propagate. In service, three types of loads are applied to the spherical bearing. The effect of these loads was applied individually and simultaneously to identify the influence of the applied loads on the crack growth. Fatigue life predictions were then carried out for the worst case conditions with two applied load spectra. The first load spectrum considered is that under which the bearings have been tested at Materials Engineering Research Laboratory (MERL), i.e. 200 kN to 10 000 cycles. The second load spectrum analysed is that extracted from the data obtained during track testing of the bearings. For all FEA commercial code Abaqus/Standard was used.
Experimental testing of current design
A selection of new and ex service couplings was examined visually and through sectioning at appropriate positions. The ex service units were of known approximate mileage and all exhibited significant damage to the rubber layer. This damage had occurred after a short time in service (less than 6 months in many cases) whereas the service life of the coupling was expected to be at least 10 years. An audit of the production of the coupling bearings was also performed and this indicated some areas for improvement but did not identify the main cause for the cracks in the rubber layer.
The location and extent of the damage to each ex service unit were characterised; however, the damage was so severe in all the units supplied that it was not possible to determine the location of the damage initiation.
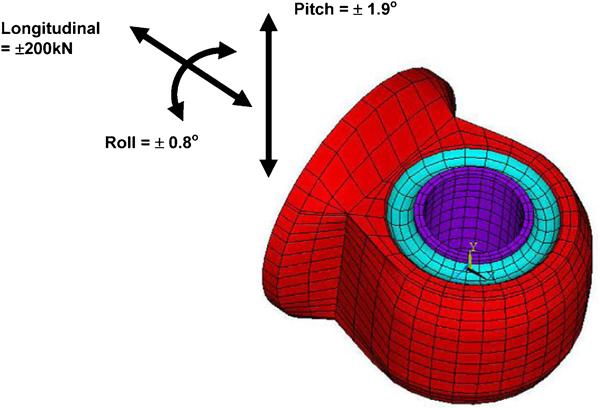
The loading directions applied to the coupling in service are shown in Fig. 3. These consist of longitudinal, pitch and roll. The load spectrum for the original design of coupling bearing was measured during track tests using instrumented bogies and with new couplings of the original design. The data were analysed to extract longitudinal load as a number of cycles in compression and tension. Data from track tests were recorded from a 30 mile run. These data were then extrapolated to 60 000 miles to represent 1 year's loading on the spherical bearing. The load spectra indicated that in extreme case, there could be excursions to loads of ∼200 kN in the longitudinal directions. Based on this peak load of 200 kN from the load spectrum, a test was defined for fatigue testing and subsequent comparison of any design changes proposed. The conditions for the comparative fatigue test were 10 000 cycles at ±200 kN.
Loading directions on spherical bearing
Quasi-static tests were performed on selected units in the longitudinal direction only to determine the stiffness characteristics of the units. The bearings were tested in a universal test machine at a loading rate of 10 mm min−1 for 5 cycles to a maximum load of ±200 kN to characterise the behaviour of new and ex service units. All of the ex service units exhibited a dead band around the central position due to significant cracks in the rubber layer where in many cases the central shaft is not supported. An extreme example of damage to the rubber is given in Fig. 4.
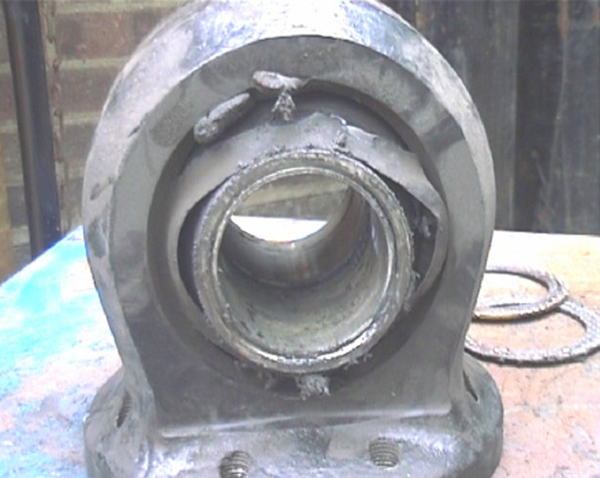
Failed spherical bearing
The same design of bearing was then analysed using FEA and the results of the analysis (in terms of crack location and magnitude) were compared with those measured.
Baseline fatigue analysis of current design
Material characterisation of elastomer
Hyperelastic model
The stress versus strain response of elastomers is represented using hyperelastic material models in terms of strain energy potential functions. To derive a suitable hyperelastic material model for the spherical bearing elastomeric compound, tests were performed under uniaxial extension, uniaxial compression and planar extension test modes. Test samples for these experiments were moulded at MERL from rubber compound supplied. A suitable hyperelastic material model was derived through curve fitting to the first cycle stress versus strain data obtained from experiments. Several hyperelastic material models are available in Abaqus and the choice of a particular function depends on the accuracy of the curve fit, stability and robustness of the model at strains of interest. A Yeoh type reduced polynomial material model gave the best fit to the test data and found to be stable at strains of interest. This model has been used to predict the stress–strain behaviour of the elastomeric layer of the spherical bearing assuming incompressible conditions.
Fatigue crack growth model
The fatigue crack growth model relating the rate of crack growth dc/dN to the tearing energy T for the elastomeric compound of the spherical bearing was derived from experiments in planar extension and simple extension modes of loading. Measured average tearing energy versus crack growth rate is plotted in Fig. 5. A particular form of crack growth model is used which describes the crack growth response in four regions of tearing energy:
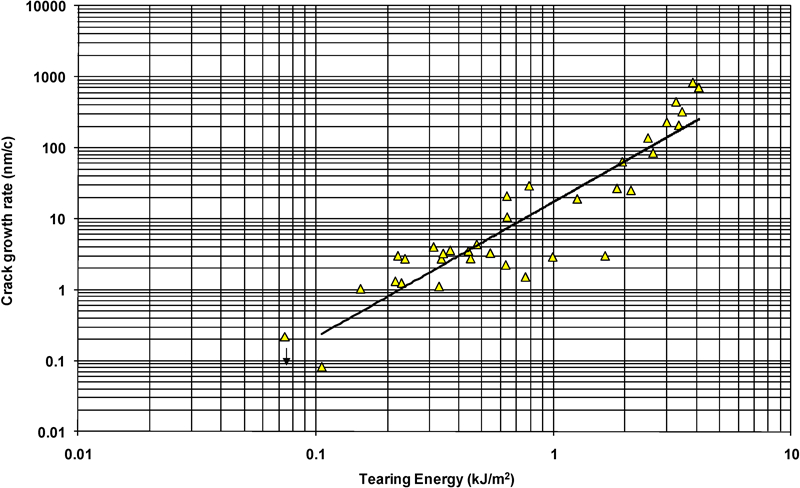
Fatigue crack growth model for original rubber compound
no growth region
If T<To, dc/dN = 0
To is the threshold tearing energy
intermediate region
If To<T<Ti, dc/dN = k(T−To)
Ti is the intermediate value of tearing energy
power law region
If Ti<T<Tc, dc/dN = bTa
Tc is the critical or catastrophic level of tearing energy
catastrophic region
If T>Tc, dc/dN is infinite.
These parameters were defined for the original elastomeric compound and used in the baseline fatigue analysis.
Finite element analysis
Stress analysis
The first stage of a fatigue analysis is to identify the possible locations where cracks are likely to initiate and grow. A three-dimensional finite element model of the spherical bearing was developed to perform stress analysis under applied loading conditions.
The finite element model, shown in Fig. 6, consisted of an inner cylindrical ring, an outer housing bracket and an elastomeric layer. The directions of loading and their respective maximum values that the spherical bearing is subjected to during operation are given in Fig. 3. Both the inner and outer parts are made of steel and are therefore assumed to be rigid compared with the elastomeric layer which is modelled using hyperelastic incompressible material model. The elastomeric layer was mechanically tied to the inner ring and the outer bracket and assumed a perfect bond between the rubber and the steel.
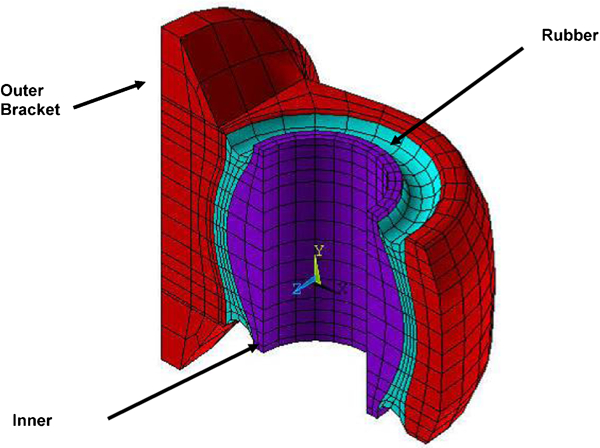
Finite element model of spherical bearing
Analysis of the behaviour of the spherical bearing was performed using a maximum longitudinal load of 200 kN, a maximum pitch of 1·9° and a maximum roll of 0·8°. Results in terms of maximum principal strains in the rubber are plotted on a section of the bearing in Fig. 6. One side of the rubber is in tension while the other is in compression. Peak strains of ∼200% are predicted on the tension side near the inner surface of the rubber. Further analysis of the results determined that this is the region where cracks are most likely to grow.
Crack growth analysis
A crack growth analysis was performed using the finite element model shown in Fig. 6, to establish the relationship between tearing energy and crack size. The tearing energy values are obtained using the global energy difference method. As in any fatigue analysis, the most important decision is to identify the location where the cracks are most likely to initiate and the direction in which they are likely to grow.
Cracks are most likely to occur at locations where highest maximum principal strains occur. From the stress analysis results, it was found that the maximum strain regions in the spherical bearing rubber layer were found to be along the longitudinal loading direction near the rubber and inner ring interface. The maximum strains were found at about 35–40 mm from the top and bottom edges of the inner ring. However, the examination of the failed bearings also showed cracks on the surface of the elastomeric layer just above maximum strain location.
Based on this information, cracks of idealised geometry were modelled at four different locations. The locations and direction of the cracks are identified in Fig. 7. Cracks of different depths were modelled at all four locations under longitudinal loading conditions only. In service the spherical bearing undergoes three types of loading, longitudinal, pitch and roll, applied at random. In order to limit the number of simulations that are required it was decided to employ the worst case loading condition first to identify the region where cracks are most likely to grow and predict the direction of crack growth. From previous analyses, it was found that the longitudinal loading of 200 kN represents the extreme loading conditions.
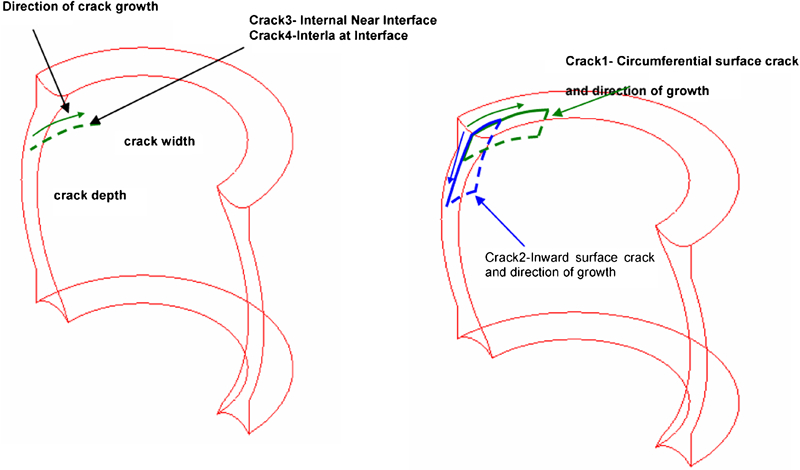
Idealised crack geometries modelled
The results of the baseline fatigue analysis are plotted in Fig. 8 and show that the tearing energy for the crack 1 (which are surface cracks grown around the circumference) is low and remains almost constant suggesting that cracks are not likely to grow along the circumference. The tearing energy for the crack 2 (a crack grown from the outer surface into the rubber) remains low for crack depths of ∼7 mm and then starts to increase rapidly. As the depth increases, the crack is getting closer to the region of highest strains. This suggests that crack is not likely to initiate from the surface.
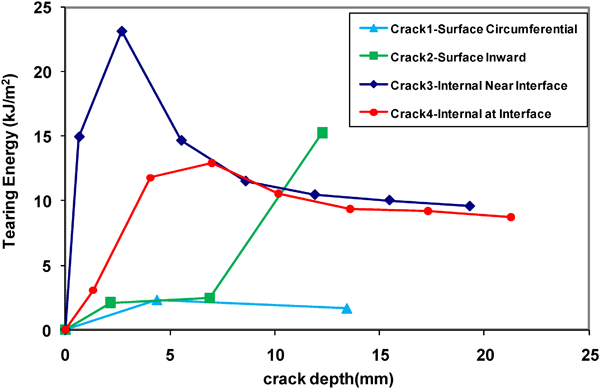
Tearing energy values for surface and internal cracks
The tearing energy values for the two internal cracks, crack 3 and crack 4, exhibit a different trend from that found for the surface cracks. The tearing energy peaks at a crack depth of ∼5 mm and then increases steadily with increasing crack depth. The initial tearing energy values for the crack 3 (an internal crack at the interface) are considerably lower than those for the crack 4 (an internal crack near the interface). Additional internal cracks were also modelled with increasing width, producing similar trends and levels of tearing energy to those shown in Fig. 8, except higher peak tearing energy levels.
The results of Fig. 8 show that the internal cracks of type crack 4 are most likely to initiate and grow along the circumference and will also grow towards the surface. The high tearing energy at low crack depths suggests that cracks are likely to initiate from the region of maximum strain and that after the initial rapid growth, they will continue to grow at a constant rate. The tearing energy levels predicted are high, suggesting that the crack growth is likely to be in the power law region of the material crack growth model.
Having established the region where crack growth is most likely, the effect of different loading conditions (longitudinal, roll and pitch) on the predicted tearing energy values was studied. A crack with an initial crack width of 13·82 mm was used in this study. Analyses were performed with longitudinal, roll and pitch applied individually as well as applied simultaneously to evaluate the worse loading conditions. The results of predicted tearing energy against crack depth for different cases are shown in Fig. 9, which indicate that the most severe loading case is the longitudinal loading only. The pitch and roll result in almost negligible tearing energy values compared with the longitudinal loading. Even the combined loading appears to result in a reduction in level of tearing energy compared with the longitudinal case.
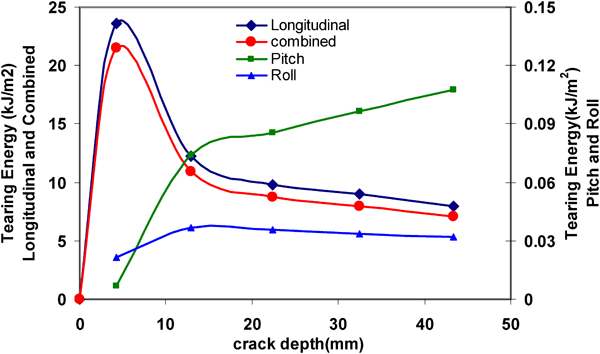
Tearing energy as function of crack size for different cracks modelled
Based on these findings, a more detailed crack growth analysis was performed for a range of crack depths for the internal crack (type crack 4) at the maximum strain location near the rubber/inner interface under the longitudinal loading only, neglecting pitch and roll loadings. The results in terms of tearing energy values at different loads were extracted from the analysis to facilitate fatigue crack growth calculations.
Fatigue life predictions
The calculations of the predicted crack growth due to fatigue are performed using a fatigue calculator based on the methodology described in the section on ‘Introduction’ (Fig. 2). Calculations are performed using the tearing energy data as a function of crack depth of Fig. 8 and the fatigue crack growth model of Fig. 5. In addition, the load spectrum is required for which the life predictions are to be calculated. Two loading conditions are used for life predictions in this study:
those used in the comparative laboratory tests at MERL (maximum longitudinal load of ±200 kN for 10 000 cycles)
those measured from track tests carried out on the original spherical bearing.
The fatigue crack growth calculation procedure does not account for the initiation of the cracks and therefore requires an initial flaw size as input to initiate the calculations. This initial flaw or crack size Co can be assumed to represent the state of the rubber after manufacture. Based on experience, internal work and the results reported by Lake and Lindley10 a value of Co = 0·05 has been used which represents a good quality carbon black filled rubber. With defects in the moulded rubber, the value of Co can be as high as 1–2 mm.
Initial fatigue life calculations were performed using the tearing energy versus crack growth predictions from the crack growth analysis for the longitudinal loading case only at a cyclic load of 200 kN. The predicted fatigue crack growth in the spherical bearing for a 200 kN load applied over 10 000 cycles and for a range of initial flaw size Co values is plotted in Fig. 10. For Co = 0·05 mm the crack growth increases rapidly after ∼1500 cycles where as for a value of 0·5 mm the crack is likely to start growing rapidly from the beginning of the load cycles. Cracks grow to a depth of ∼10 mm at a high rate corresponding to the tearing energy peak in Fig. 9. After the initial high rate of growth the cracks continue at a steady rate with the final crack size in the range of about 35–40 mm after 10 000 cycles. Therefore cracks that start internally are likely to come to the surface towards the end of the cycles.
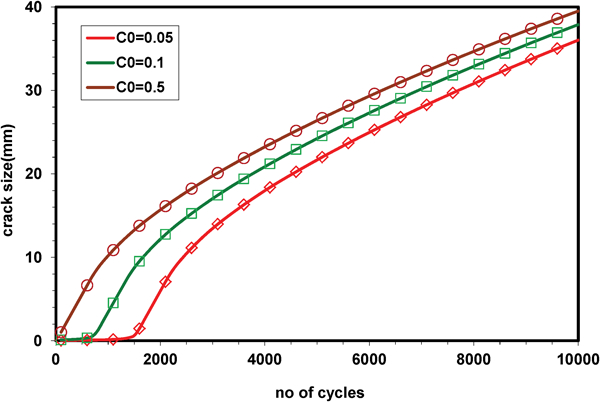
Predicted crack growth as function of number of cycles at different loads for range of initial flaw sizes
In order to estimate the fatigue life of the spherical bearing in service, calculations of the crack growth under actual loading conditions were performed. The load spectrum used in this case is that measured during track tests on the spherical bearings. Data from track tests were recorded from a 30 miles’ run. These data were then extrapolated to 60 000 miles to represent 1 year's loading on the spherical bearing. The cycle counts in both tension and compression are shown in Fig. 11. As can be seen from Fig. 11, the tension loading represents the worst case scenario and hence has been used to evaluate the crack growth rates.
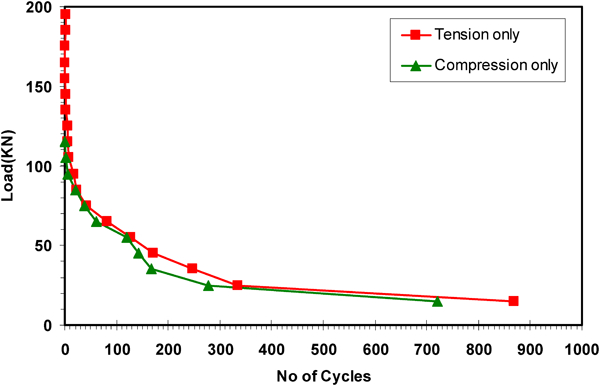
Load spectrum as measured during track tests on spherical bearing in different loading modes: actual data from 30 miles’ run
One important aspect in fatigue calculations is the order in which the fatigue loads are applied. In practice the loads are generally applied in a random manner, which is difficult to incorporate into calculations for fatigue life. In order to assess the influence of applying loads in different manners the loading spectrum was applied in three different ways:
applying the 30 miles’ load spectrum as a block repeated 2000 times to represent 60 000 miles or 1 year's service load. The load spectrum is applied in increasing and decreasing load order
applying the extrapolated 1 year's load spectrum once with ascending loads with crack growth due to each load for a given number of cycles being calculated before proceeding to the next load
applying the extrapolated 1 year's load spectrum once with descending loads with crack growth due to each load for a given number of cycles being calculated before proceeding to the next load.
Crack growth calculations using the tension load spectrum of Fig. 11 are used along with the tearing energy versus crack depth data of Fig. 5 and the crack growth model shown in Fig. 7. The results in terms of predicted crack sizes as a function of the total number of cycles are plotted in Fig. 12 for the three different methods of applying the fatigue loading. The final predicted crack size after 1 year of loading is nearly the same for the three cases. However, the rate of increase in crack growth is not the same for all three cases. For the case of 1 year's load spectrum applied in increasing order the crack growth initially is quite low compared with the case when the same load spectrum is applied in decreasing order. For the 30 miles’ load spectrum applied in repeated blocks of 2000, which is a more realistic application of the load spectrum, the crack growth occurs at a constant rate. No effect was found when 30 miles’ load spectrum was applied in increasing or decreasing orders.
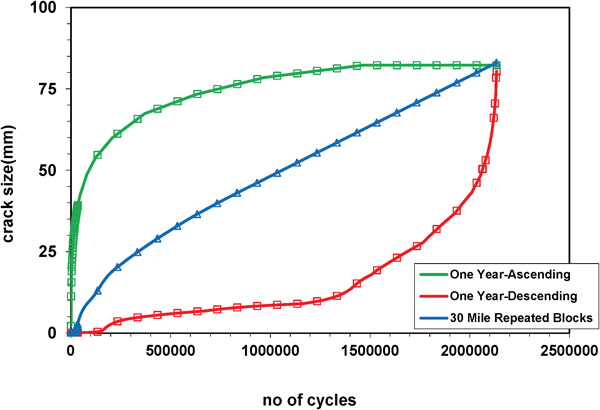
Predicted crack growth for 30 miles’ load spectrum applied 2000 times
Validation of predicted life with measured life
New spherical bearings were also tested under longitudinal loads of 200 kN for 10 000 cycles and these were then sectioned and the resulting cracks were examined and compared with the predicted cracks from the FEA.
For the ex service bearings, after ∼1 year's service, crack growth is extensive with total crack lengths approaching 100 mm long. This may have been several smaller cracks that have joined together. If all cracks are treated separately, the lengths are in the range of 15–50 mm.
Several new spherical bearings were tested in the longitudinal direction at ±200 kN for 10 000 cycles. Images of typical sections through the bearings are given in Fig. 13. The cracks in the rubber were found to be at the same position as the maximum principal strains predicted by the FEA. In general, these cracks closely follow the contours of the inner, spherical, metal member, especially in the area closest to the flange plate, but are all cracks in the rubber. The cracks were measured and found to be between 10 and 35 mm long at the surface of the cut section. The FEA predicted that crack growth up to 40 mm long would occur after 10 000 fatigue cycles (at ±200 kN). Thus the level of damage seen in the ex service bearings is similar to that predicted for 10 000 cycles at ±200 kN, thus validating the accelerated test conditions predicted by the FEA. Typical fatigue scatter in natural rubber compounds may result in a factor of ±2 being applied to the crack length for this load condition resulting in cracks of 20–60 mm long after 10 000 cycles to ±200 kN. This is also consistent with what was observed from the fatigue tests.
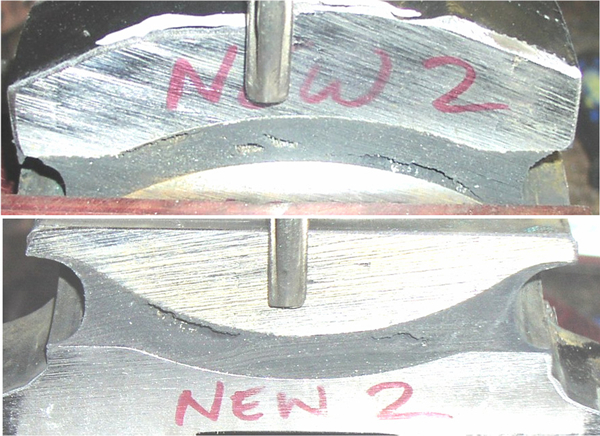
Internal cracking of new original bearing after 10 000 cycles
Good correlation was therefore achieved between predicted and measured crack depths from the comparative laboratory tests under longitudinal loading.
Design changes
The results of baseline fatigue analysis and experimental testing showed that existing design of the bearing could not provide the design life expected and changes to the design were required. Owing to their particular design the spherical bearings will always result in areas of high strains from which fatigue crack growth could initiate and major changes to the design could not be undertaken due to the in service loading requirements and the space envelope in which the bearing has to operate. Reducing the maximum strains through minor design changes to the inner shaft and using a more fatigue resistant compound were the two options considered.
One aspect that was not initially included into the analysis is the shrinkage of the elastomeric layer during cooling after moulding. The coefficient of thermal expansion of rubber is 15–20 times that of steel. Owing to this large differential in coefficient of thermal expansion, high strains can be developed in the elastomeric layer during cooling as it is constrained between the two steel parts. A thermal–stress analysis was performed to model the cooling of the spherical bearing from a moulding temperature of 170°C to an ambient temperature of 23°C. The analysis predicted that maximum tensile strains of nearly 70% will be present in the rubber layer after cooling. The presence of high tensile pressure stresses in the highly confined rubber can lead to cavitation, especially at high temperatures when the strength of the rubber is low. Small and large voids/holes have been found in the unused spherical bearing when sectioned. Any small flaw that develops during shrinkage will increase the propensity of crack initiation and subsequent growth during the loading of the bearing in service.
One way to reduce the tensile stresses developed due to shrinkage is to mechanically expand the inner shaft. An FEA carried out predicted that an expansion of inner by about 4–5% would completely relieve the tensile stresses in the rubber layer.
A more fatigue resistance elastomeric compound was also developed and characterised. The crack growth model for the revised compound is compared with the original compound in Fig. 14. The revised compound generally exhibits a lower crack growth rate for a given tearing energy as well as exhibits a similar lower threshold limit.
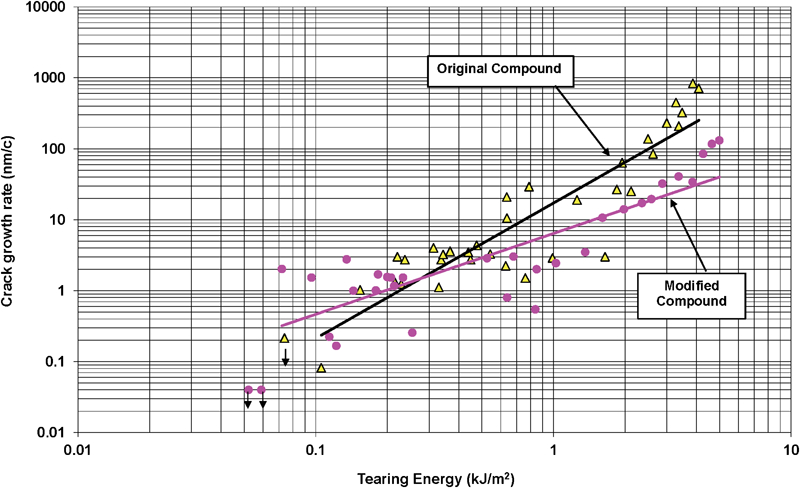
Comparison of fatigue crack growth model for original compound (triangles) versus new rubber compound (circles)
Comparison of original design with new design
Prototype spherical bearings were manufactured using the same mould as for the original bearing but with the revised elastomeric compound. After moulding and while the rubber layer was still warm the inner steel was expanded mechanically to reduce the tensile stresses produced due to shrinkage. Approximately 10% precompression over thickness was applied.
Quasi-static tests were performed on selected prototype units in the longitudinal direction to determine the stiffness characteristics of the units. The bearings were tested in a universal test machine at a loading rate of 10 mm min−1 for 5 cycles to a maximum load of ±200 kN. The changes to the design including a new rubber compound and the expansion of the inner metal resulted in the elimination of the ‘dead band’ that was seen with the original design and hence a stiffer bearing in the longitudinal direction.
Owing to the effects of the increase in stiffness and the elimination of the ‘dead band’, the load spectrum was remeasured on trains using the same track and bogie conditions as used previously. Hence, a new load spectrum was generated for prototype bearings.
The prototype bearings were then experimentally tested to 200 kN for 200 000 cycles (compared with 10 000 cycles for the original bearings) and sectioning of the spherical bearings was performed. A comparison of the measured load–displacement response of the new design prototype bearing with the original design bearing is shown in Fig. 15, which shows a significant increase in the stiffness with the new design. Sections through a typical bearing after 200 000 cycles indicated that some cracks are still present, as predicted by the fatigue life predictions, but they are significantly shorter than was seen from the ex service original bearings and the original design of bearings tested on the test rigs at MERL to 10 000 cycles. During the fatigue tests, the prototype bearings did not develop a ‘dead band’ as was seen in the original bearings.
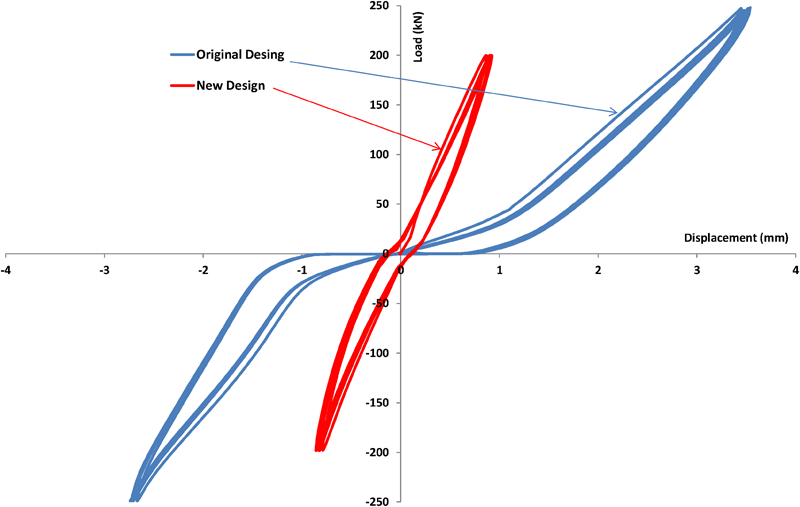
Comparison of measured load–displacement response of new design prototype bearing with old design bearing
The success of the development was based on measured crack depths in laboratory tests and it was not considered necessary to reanalyse the bearing with new design, new rubber compound and new load spectrum if the laboratory tests exhibited a significant improvement. A comparison of the cracks in the original bearing after 10 000 cycles and the cracks in the prototype bearings after 200 000 cycles is given in Fig. 16. The tests show that a significant improvement in the fatigue life of the bearing has been achieved since the crack depths in the prototype bearings after 200 000 cycles are less than those in the original bearings after 10 000 cycles. Hence, there is an improvement in terms of life under these simulated conditions of at least a factor of 20 times.
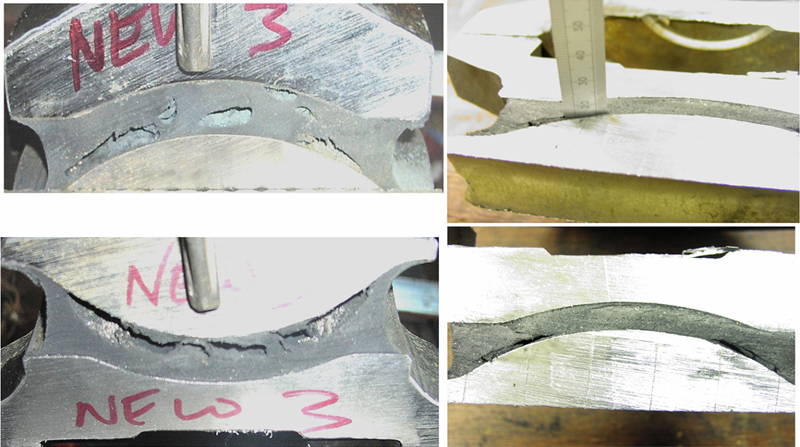
Comparison of cracks in original bearings (left) after 10 000 cycles at ±200 kN and new prototype bearings (right) after 200 000 cycles at ±200 kN
Conclusions
Materials Engineering Research Laboratory was initially approached to look at life extension of spherical coupler bearings but soon discovered serious failures of bearings in service. A fracture mechanics approach was used to assess the fatigue life of the original design of bearing and to propose design changes to improve the life of the bearing.
A baseline stress analysis of an undamaged component was performed to investigate the likelihood of failure and to determine the predicted locations by interrogation of the predicted stresses and strains.
A crack analysis was then performed by introducing cracks in the model at locations where cracks are predicted to initiate and propagate. The criterion for the crack growth in this approach is the maximum tearing energy or strain energy release rate; crack growth will occur in the location and direction of the maximum strain energy release rate.
The finite element stress and fatigue analysis of the original design under combinations of longitudinal, pitch and roll loadings suggested that the longitudinal loading case was the most severe. The original design of bearing was then analysed using a comparative test (10 000 cycles to ±200 kN) as well as in a simplified track test load spectrum in the longitudinal direction only. The crack predictions from the comparative test conditions were compared with data from fatigue tests and good correlation was found in terms of crack depth and location. This defined the test for assessing the relative performance of the original design and any design changes.
Using the predictions for the stress analysis of the original bearing, various minor design changes were analysed. The potential changes were limited due to the space envelope in which the bearing operates and the loading conditions. The design changes proposed were minor geometrical changes to the inner shaft profile, expansion of the inner metal to reduce shrinkage and changes to the rubber formulation to improve the fatigue resistance of the rubber.
Prototype bearings were manufactured using the original mould and incorporating the proposed design changes. Significant improvement in the stiffness of the bearing has been recorded compared with the original design. These bearings were then tested in fatigue to 200 000 cycles at ±200 kN of longitudinal load. The tests show that a significant improvement in the fatigue life of the bearing has been achieved since the crack depths in the prototype bearings after 200 000 cycles are less than those in the original bearings after 10 000 cycles. Hence, an improvement in the life of the bearings of ∼20 times has been achieved through the use of stress and fatigue crack growth analysis combined with materials characterisation and rig fatigue testing.