
Abstract
Powder metallurgical (PM) steels with elemental Ni additions exhibit non-homogenous microstructures with soft Ni rich areas, lean in C, after conventional sintering. Though, the exact correlation between the distribution of Ni and mechanical properties is not well known and depends on the conditions, e.g. the load state, it is desirable to be able to control the distribution of Ni since it plays a major role in the properties of Ni PM components. By introducing other alloying elements, the microstructure homogeneity of Ni containing PM steels, can be influenced. Thus, the effect of common alloying elements on the homogeneity of sintered microstructures has been investigated in the present work. It is found that additions of either C or Mo have minor effect on Ni distribution in the Fe–Ni system. However, addition of both C and Mo to Fe–Ni improves the Ni distribution. In addition, a strong interaction between Ni and Cu is observed and it enhances the Ni homogeneity. Furthermore, the influence of Cu is more pronounced in presence of C.
Introduction
The final microstructure of sintered powder metallurgical (PM) steel components depends upon factors such as handling and mixing of the powders, alloying additions, alloying method and sintering conditions. There are three basic methods of introducing alloying elements in PM steels; admixing, pre-alloying, and diffusion alloying. Admixing of elements might result in segregation and as a consequence, variations in composition of sintered parts. Segregation is not a problem for pre-alloyed powders but due to solution hardening, compressibility is decreased. To overcome segregation without a decrease in compressibility diffusion alloying method is used. Elemental additives are then in a heat treatment, by diffusion, bound to the surface of the iron particles. However, the as sintered microstructure of these powders is usually not homogenous due to insufficient diffusion of alloying elements during conventional sintering. Moreover, in the case of PM steels containing Ni, regardless of alloying method used, an inhomogeneous microstructure containing Ni rich and Ni lean areas is produced after conventional sintering practice. This is due to the slow diffusion of Ni in iron as compared to other alloying elements such as C, Cu and Mo. 1 The Ni rich areas are located at the original iron particle surfaces, i.e. in sintering necks and on pore surfaces.
The addition of Ni is known to improve the mechanical properties of PM steel components by increasing strength, impact resistance, abrasion resistance and fatigue performance.2,3 Some previous studies have, however, reported that presence of the soft austenitic phase, i.e. Ni rich areas, can be detrimental to mechanical properties such as tensile and fatigue strength.4–6 On the other hand, Tougas et al. 7 recently explained that even though Ni PM steels may contain a significant fraction of retained austenite, they may still have enhanced mechanical properties due to strain-induced martensitic transformation during deformation. Though the contribution by the austenite may depend on the exact loading situation and the austenite phase stability, the literature seem to suggest that a certain degree of inhomogeneity may be favourable for obtaining good mechanical properties. Furthermore, the degree of inhomogeneity can be influenced by the alloying additions. Hence, in the present work, an effort has been made to improve the understanding of interaction between alloying elements during sintering and their effect on microstructure homogeneity in Ni PM steels.
Many researchers have studied the phenomenon of heterogeneous distribution of Ni during sintering and have indicated that a strong repulsion between Ni and C is a reason for non-uniform distribution of Ni.6,8–12 Through thermodynamic calculations, Sozinov and Gavrilijuk 5 showed that the presence of Ni increases the chemical potential of carbon and thus results in decreased carbon content in Ni rich areas. This indicates that the distribution of carbon will be inhomogeneous in case Ni is inhomogeneous. Wu et al. 9 reported that addition of Cr and Mo helps to homogenise Ni and C distributions by reducing the chemical potential of carbon. Moreover, due to complete solubility between Ni and Cu at temperatures above 355°C, 13 a strong interaction between these two elements exists, which gives rise to Ni–Cu alloying in sintered compact. It is not surprising that the final distribution of both Ni and Cu will be influenced by this interaction. It has been shown that in Ni and Cu containing alloys, Ni rich and Cu rich regions are associated with each other. 14 Furthermore, interaction between Cu and C exists and when both elements are added to base powder, C inhibits the Cu spreading into Fe particles and grain boundaries.15–18
Though there are a number of previous reports on the distribution of alloying elements during sintering of PM steels, the complicated interactions of elements is not well known. Thus, the purpose of the present work is to investigate the effect of Cu, Mo and C on the distribution of Ni in sintered microstructure of PM steels. An understanding of individual and combined interactions between alloying elements is developed by using model alloys. Furthermore, commercial alloys are investigated to verify the interactions.
Experimental
The experimental work was carried out in two trials. The first trial concerns model alloys to isolate the alloying element effects and the second trial concerns commercial alloys to verify the observations on model alloys. In the first trial the base powder used was commercial Fe powder grade ASC100·29 produced by Höganäs AB, Sweden. The Fe powder was admixed with alloying elements to achieve the compositions given in Table 1. Ni powder type 3, Cu 100 mesh metal powder and −75 μm Mo metal powder were used in trail 1. The nominal compositions of commercial alloys used in trial 2 are presented in Table 2. The amount of lubricant added to all compositions was 0·6 wt-%. Carbon added, in both trials, was graphite grade F-10. The mixes were made by mixing in a rotation blender for 8 min. The compaction of test specimens was performed by uniaxial pressing. All specimens were compacted to a density of 7·0 g cm–3. Specimens were sintered at 1120°C in 95/5 N2/H2 using a mesh belt furnace. Under these sintering conditions the specimens were sintered for two different holding times; 15 and 40 min. Standard metallographic practices were employed for preparation of samples for microstructural observation. Etching was done by using 4% nital. To examine the diffusion of additives and homogeneity of microstructure, analytical line scans, point analysis and elemental mappings were obtained using scanning electron microscopy and energy dispersive X-ray spectroscopy (SEM–EDS). For these analyses a field emission scanning electron microscope (Hitachi SU6600) equipped with an EDS system (Bruker Quantax) was used. X-ray maps, acquired using an energy window positioned over the Kα lines, were used to determine the location of Ni rich regions. Thereafter, analytical line scans and multipoint analysis were carefully performed to obtain quantitative results. The acceleration voltage applied was 20 and 15 kV for model and commercial alloys respectively.
Nominal chemical compositions of investigated model mixes/wt-%
Nominal chemical compositions of investigated commercial alloys/wt-%
Thermo-Calc 19 was used to perform thermodynamic calculations. The database TCFE6 has been accessed to calculate chemical potential of carbon in Fe–0·6C–xNi (wt-%), Fe–0·6C–xCu (wt-%) and Fe–0·6C–xMo (wt-%).
Results and discussion
Distribution of Ni in model alloys
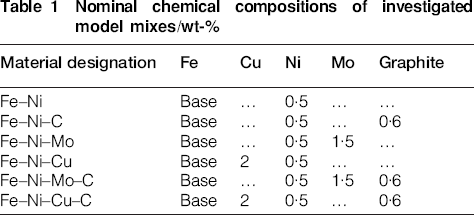
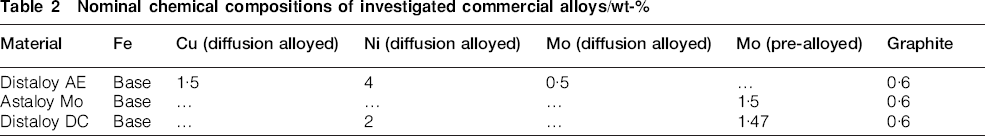
The effect of alloying elements on the distribution of Ni in Fe matrix during sintering at 1120°C for 15 and 40 min is shown in Figs. 1 and 2 respectively. It is seen that addition of C or Mo to Fe–Ni does not give a pronounced effect on Ni distribution (see Figs. 1b, 1e, 2b and 2e). However, addition of both Mo and C to Fe–Ni improves the distribution of Ni to some extent, as shown in Figs. 1f and 2f. The influence on Ni distribution by Cu addition to Fe–Ni is evident in the case of 15 min sintering, which can be seen in Fig. 1c. The effect is not as clear for the samples sintered for 40 min. However, by careful EDS analysis of a few selected regions it was indicated that the Cu addition enhances Ni distribution (Fig. 3). Moreover, the effect of Cu is much more pronounced when added to Fe–Ni–C as seen in Fig. 2d.
a Fe–Ni; b Fe–Ni–C; c Fe–Ni–Cu; d Fe–Ni–Cu–C; e Fe–Ni–Mo; f Fe–Ni–Mo–C
a Fe–Ni; b Fe–Ni–C; c Fe–Ni–Cu; d Fe–Ni–Cu–C; e Fe–Ni–Mo; f Fe–Ni–Mo–C
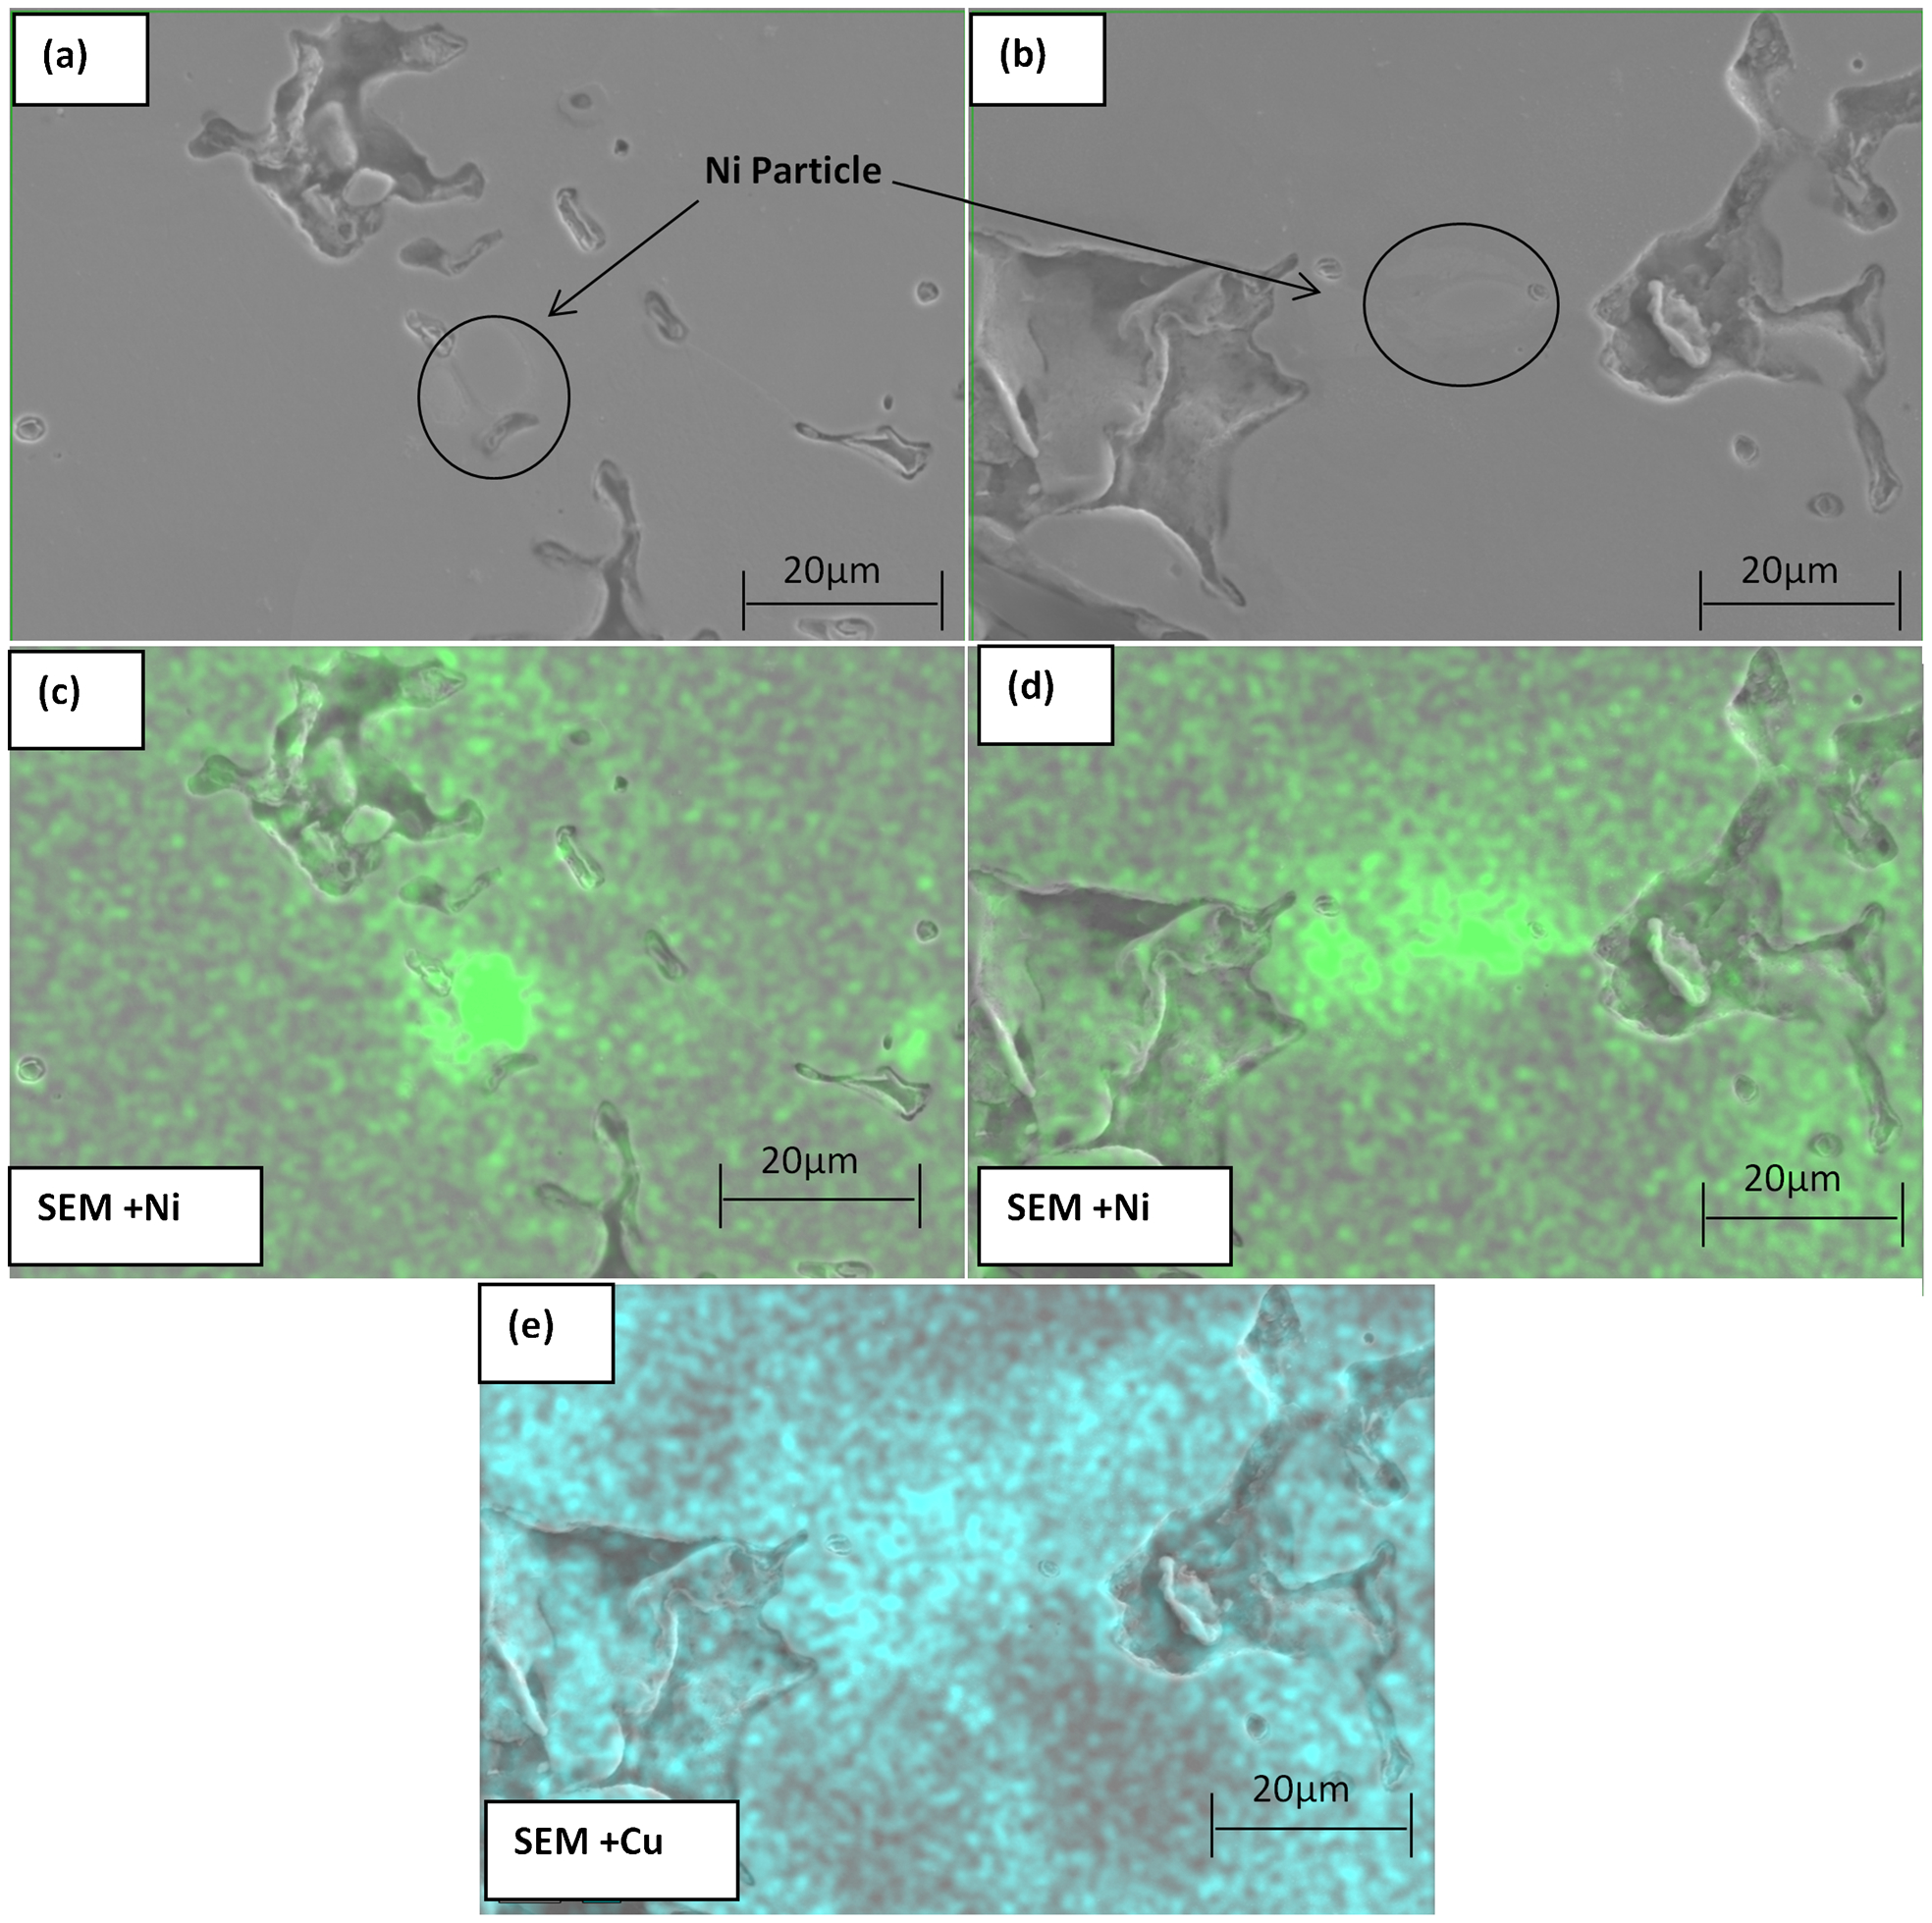
a microstructure Fe–Ni; b microstructure Fe–Ni–Cu; c Ni mapping in Fe–Ni; d Ni mapping in Fe–Ni–Cu; e Cu mapping in Fe–Ni–Cu
To further quantify the influence of alloying additions on Ni distribution, the Ni content in the centre of original Ni particles was measured using line and point analysis. While performing the analysis, it was assumed that the maximum Ni concentration is representative of the centre of a Ni particle. The point of maximum Ni concentration in a Ni rich area was determined by means of line scans, exemplified in Fig. 4. It is to be noted that the values on Y axis in Fig. 4 represent the relative concentration/counts for alloying elements. Therefore, after determining the centre of particle, point analysis were performed to determine the Ni content and average values of measurements made on seven different particles in each sample are presented in results. The results of these measurements are presented in Fig. 5. The measurements gave considerably lower values of Ni content than expected. This is probably due to the rather large interaction volume also probing the matrix phase underneath the particles. The results can still be used for relative comparisons between samples. The maximum amount of Ni found in Fe–Ni, Fe–Ni–C and Fe–Ni–Mo alloys is almost the same after 15 min of sintering. After 40 min of sintering, there is a slightly higher Ni content for alloys Fe–Ni–C and Fe–Ni–Mo as compared to Fe–Ni; however, it is not statistically verified. On the other hand, addition of Cu to either Fe–Ni or Fe–Ni–C gives a substantial decrease in Ni content. This decrease in Ni content due to Cu is more pronounced for 15 min sintering. A similar behaviour is observed when Mo is added to Fe–Ni–C.
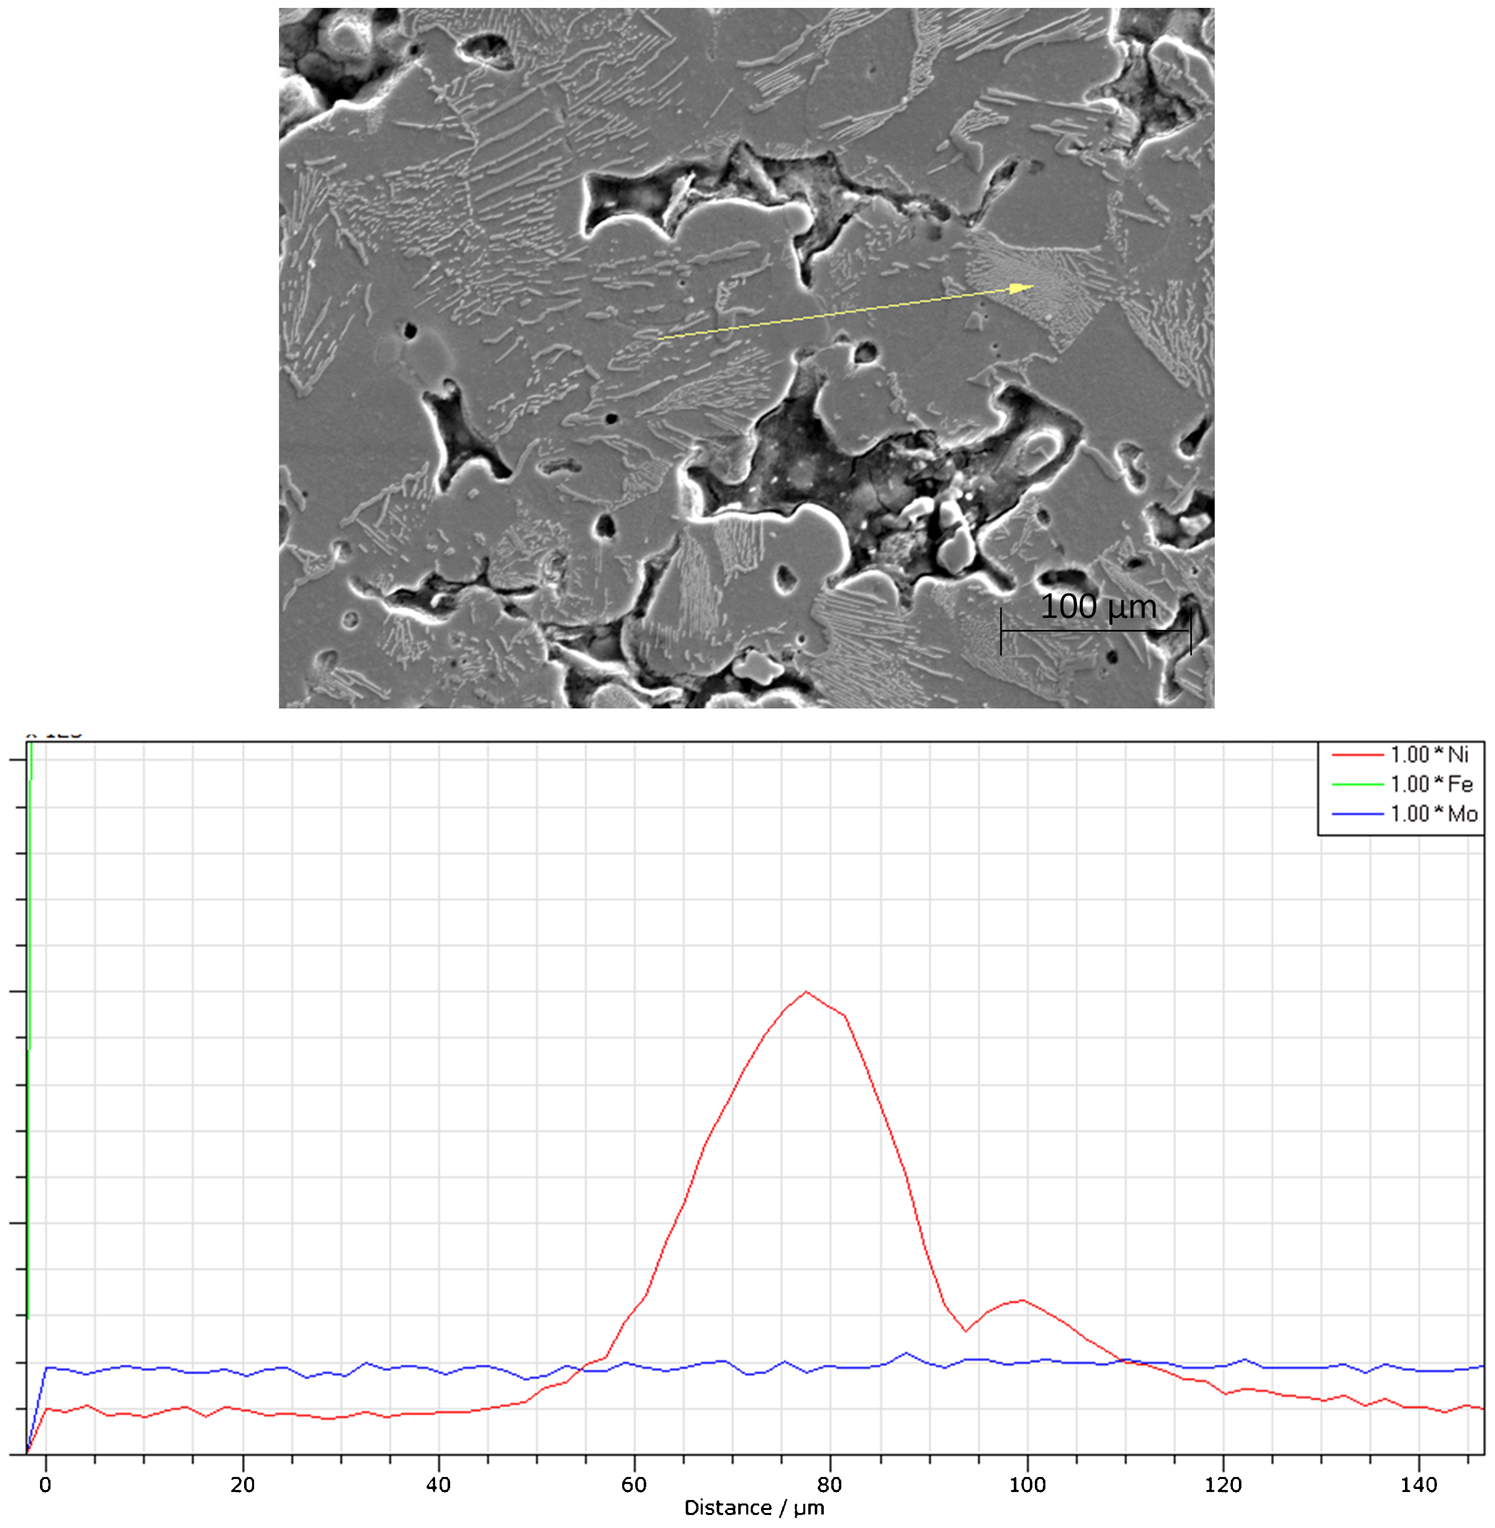
Illustration of line scan performed to determine centre of Ni particle
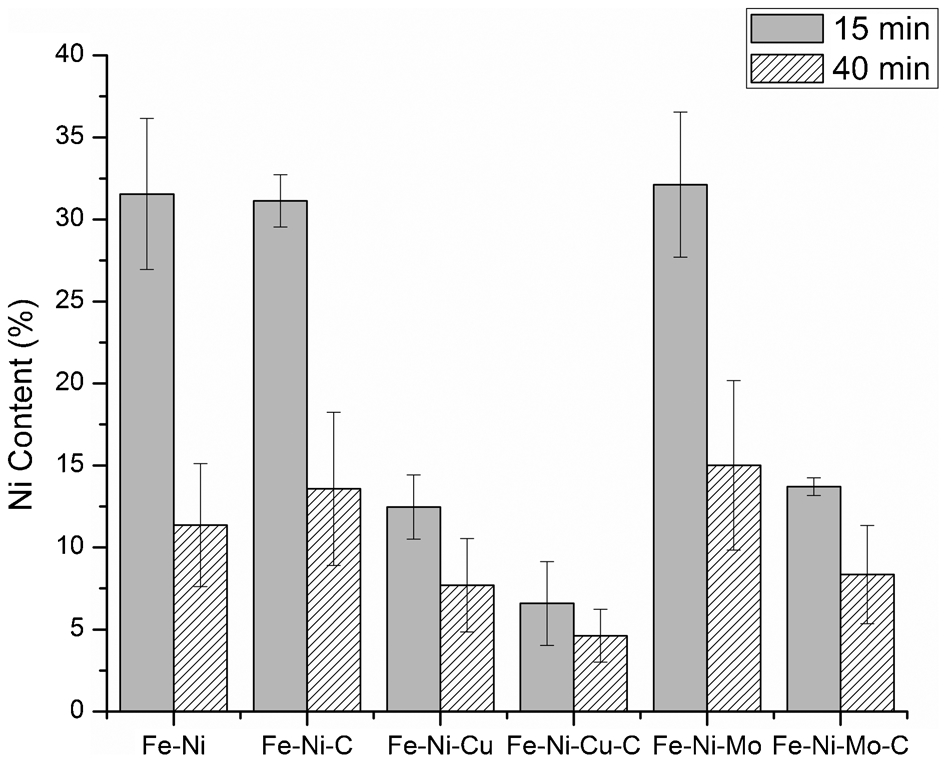
Ni content analysed in original Ni particle after sintering
The influence of Cu addition on homogeneity of Ni is further illustrated in Fig. 3. In the SEM images, it can be seen that the Ni particles are located in the sintering neck. In the Fe–Ni alloy it is seen that only a very low amount of Ni has diffused into the Fe particle. However, comparatively a higher amount of Ni has spread towards the pore system present above the Ni particle. It is due to relatively fast surface diffusion of Ni on iron powder as compared to inward diffusion of Ni into the Fe particle.20,21 An important behaviour to be noticed is the location of Ni and Cu concentrated areas. The Cu concentrated regions have accumulated in the Ni rich areas (Fig. 3d and e). In Cu containing PM steels, formation of transient liquid phase at the sintering temperature is well known. Owing to capillary force it can easily penetrate into the pores between particles. Hence, the spreading of Cu liquid phase formed takes place by covering the Fe powder surface, migrating to Fe inter particle boundaries and diffusing into Fe particle which results in formation of solid solution with Fe. When both Ni and Cu are present, liquid Cu interacts with Ni and due to complete solid solubility of Ni and Cu, a Cu–Ni liquid is formed. Singh et al.14,22 also reported that Ni and Cu preferentially interact with each other during sintering. This Cu–Ni liquid has lower surface energy than liquid Cu. 23 This means that the liquid has a lower wetting angle with Fe and it penetrates more into Fe grain boundaries. The net result is better spreading of Ni in Fe matrix.
As mentioned in the introduction, it has been reported that repulsion exists between Ni and C which results in non-uniform distribution of Ni.9,10 Through thermodynamic calculations it has been shown that addition of Ni to Fe–C changes the chemical potential of C in the system. 8 The influence of Ni and other alloying addition on chemical potential of carbon in Fe–0·6 wt-%C was calculated in the present work using Thermo-Calc and the results are shown in Fig. 6. The calculation showed that Ni and Cu increase the chemical potential of C, whereas, addition of Mo results in lowering of the carbon potential. It has previously been explained that an increased chemical potential of C in presence of Ni leads to repulsion between Ni and C.11,12 Since Cu also increases the chemical potential of C, a repelling effect between Cu and C is expected. Moreover, when both Cu and C are added to Fe powder, C inhibits the Cu spreading into Fe particle as well as along grain boundaries by decreasing the wettability of Cu with Fe.
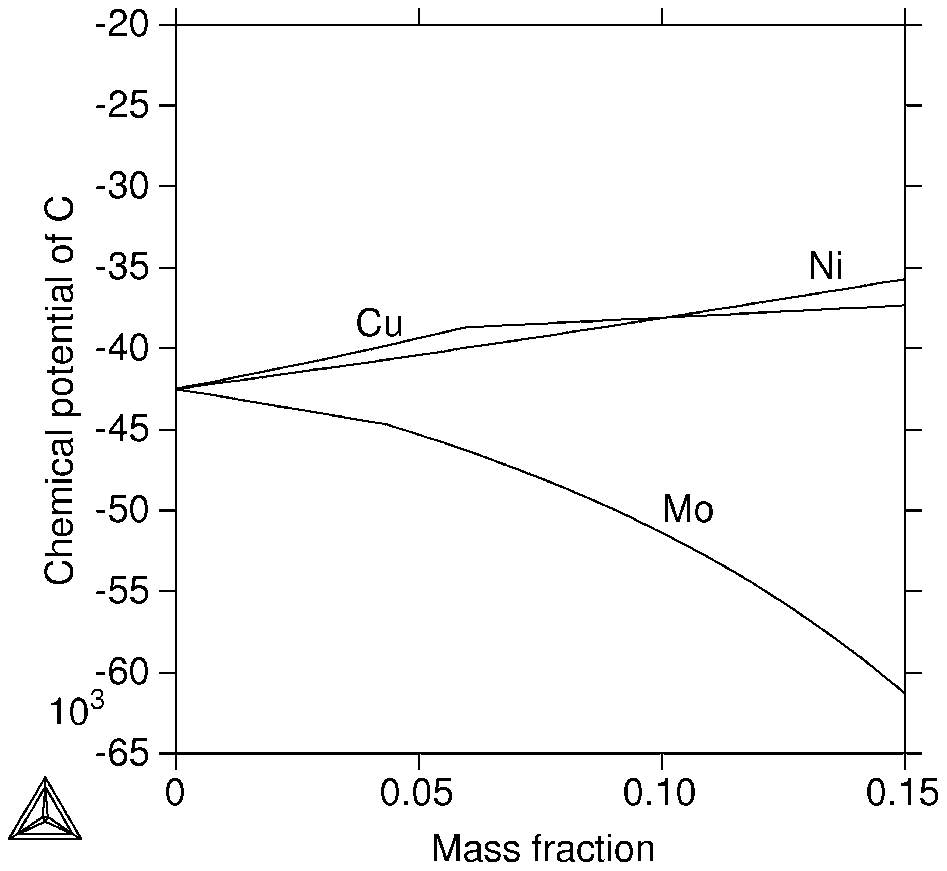
Effect of Ni, Cu or Mo addition on chemical potential of C in Fe–0·6 wt-%C
Taking into consideration the effects of C on Ni and Cu distribution, it can be anticipated that distribution of Ni will be more inhomogeneous in Fe–Ni–Cu–C as compared to Fe–Ni–Cu. However, the experimental results showed that Ni distribution was better in case of Fe–Ni–Cu–C. This behaviour can be explained in context of the interaction of Ni and Cu and that of Cu and C. In the presence of carbon the movement of Cu into inter particle boundaries is impeded. Therefore, an increased volume of liquid Cu, which cannot spread into grain boundaries, is available to interact with Ni to form Cu–Ni liquid. The increased amount of Cu–Ni liquid, having better wettability with iron, is probably responsible for the enhanced homogenisation of Ni.
It is noteworthy that the distribution of Ni is improved when Mo is added to Fe–Ni–C. Previous studies have also reported the improvement in homogeneity of Ni in PM steels due to addition of Mo. 6 The improvement is attributed to a decrease in chemical potential of carbon because of the Mo addition (see Fig. 6). Thus in presence of Mo, gradients in carbon concentration is reduced and hindrance to Ni diffusion by C is reduced.
Distribution of Ni in commercial alloys
The sintered microstructure of commercial alloys was observed to verify the interaction of Ni with C and Cu. Astaloy Mo, which contains 1·5% Mo pre-alloyed to Fe base powder, was selected as reference alloy. In Fig. 7 the microstructures of Astaloy Mo (Fig. 7a) and Distaloy DC (Fig. 7b) with 0·6% graphite sintered for 40 min are presented. The microstructure of Astaloy Mo contains a combination of coarse and fine bainite together with some coarse ferrite. The microstructure of Distaloy DC with 2%Ni (Fig. 7b), contains coarse bainite along the surface of the base powder particles and fine bainite structure in the interior of the particles. This change in microstructure, as compared to the reference alloy, indicates an increased hardenability in the interior of particles. This is related to inhomogeneous distribution of alloying elements. Ni enhances the hardenability12,24 but the Ni concentration is higher at the original particle surfaces, and the increased hardenability in the centre of the particles is instead owing to higher carbon content. This observation can be justified by considering the increase in the chemical potential of carbon in Ni rich regions, hence, gradients in carbon concentration, inverse to the gradients in Ni, are developed. These gradients are reflected in the microstructure, where coarse, low carbon bainite is present close to the original particle surfaces and towards the centre of the particles a finer, high carbon bainite is found.
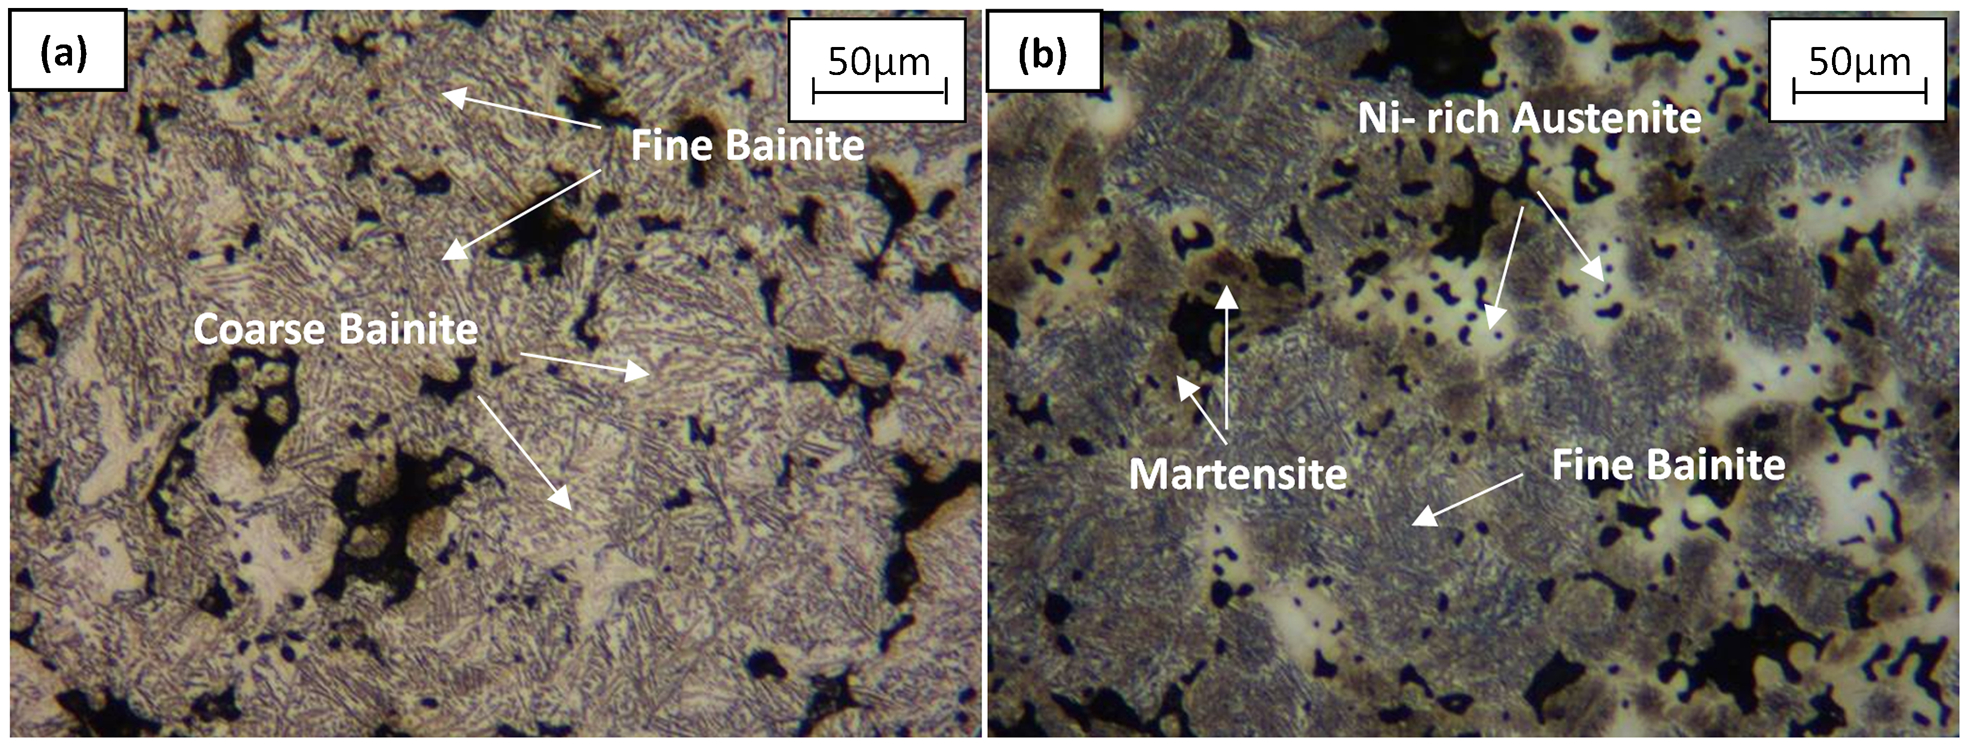
Microstructure of a Astaloy Mo–0·6 wt-%C and b Distaloy DC–0·6 wt-%C sintered for 40 min
The development of a gradient in carbon concentration clearly indicates that a repelling effect exists between Ni and C, which eventually results in more inhomogeneous sintered microstructure. However, this effect was not observed in model alloys. It can possibly be explained by the higher Ni content in commercial alloys and thus the larger increase in chemical potential of carbon as indicated in Fig. 6.
The interaction between Ni and Cu, which has a vital role in the distribution of Ni, is demonstrated by Distaloy AE in Fig. 8. The elemental mappings in characteristic microstructures of Distaloy AE after sintering for 40 min are presented. Figure 8b indicates that most of the Ni remained in the original particle. However, some quantity of Ni has spread along the surface of Fe particles. Similar to the observations in model alloys, the interaction between Ni and Cu is also observed in commercial alloy (Fig. 8b and d). The association of Cu concentrated regions with Ni concentrated regions confirms that during sintering the molten Cu interacts with Ni and accumulates in Ni rich areas. The role of Ni–Cu interaction in the distribution of Ni has been discussed previously and the observed association of Cu concentrated regions with Ni concentrated regions in the present work confirms the role of Cu to increase homogeneity of Ni.
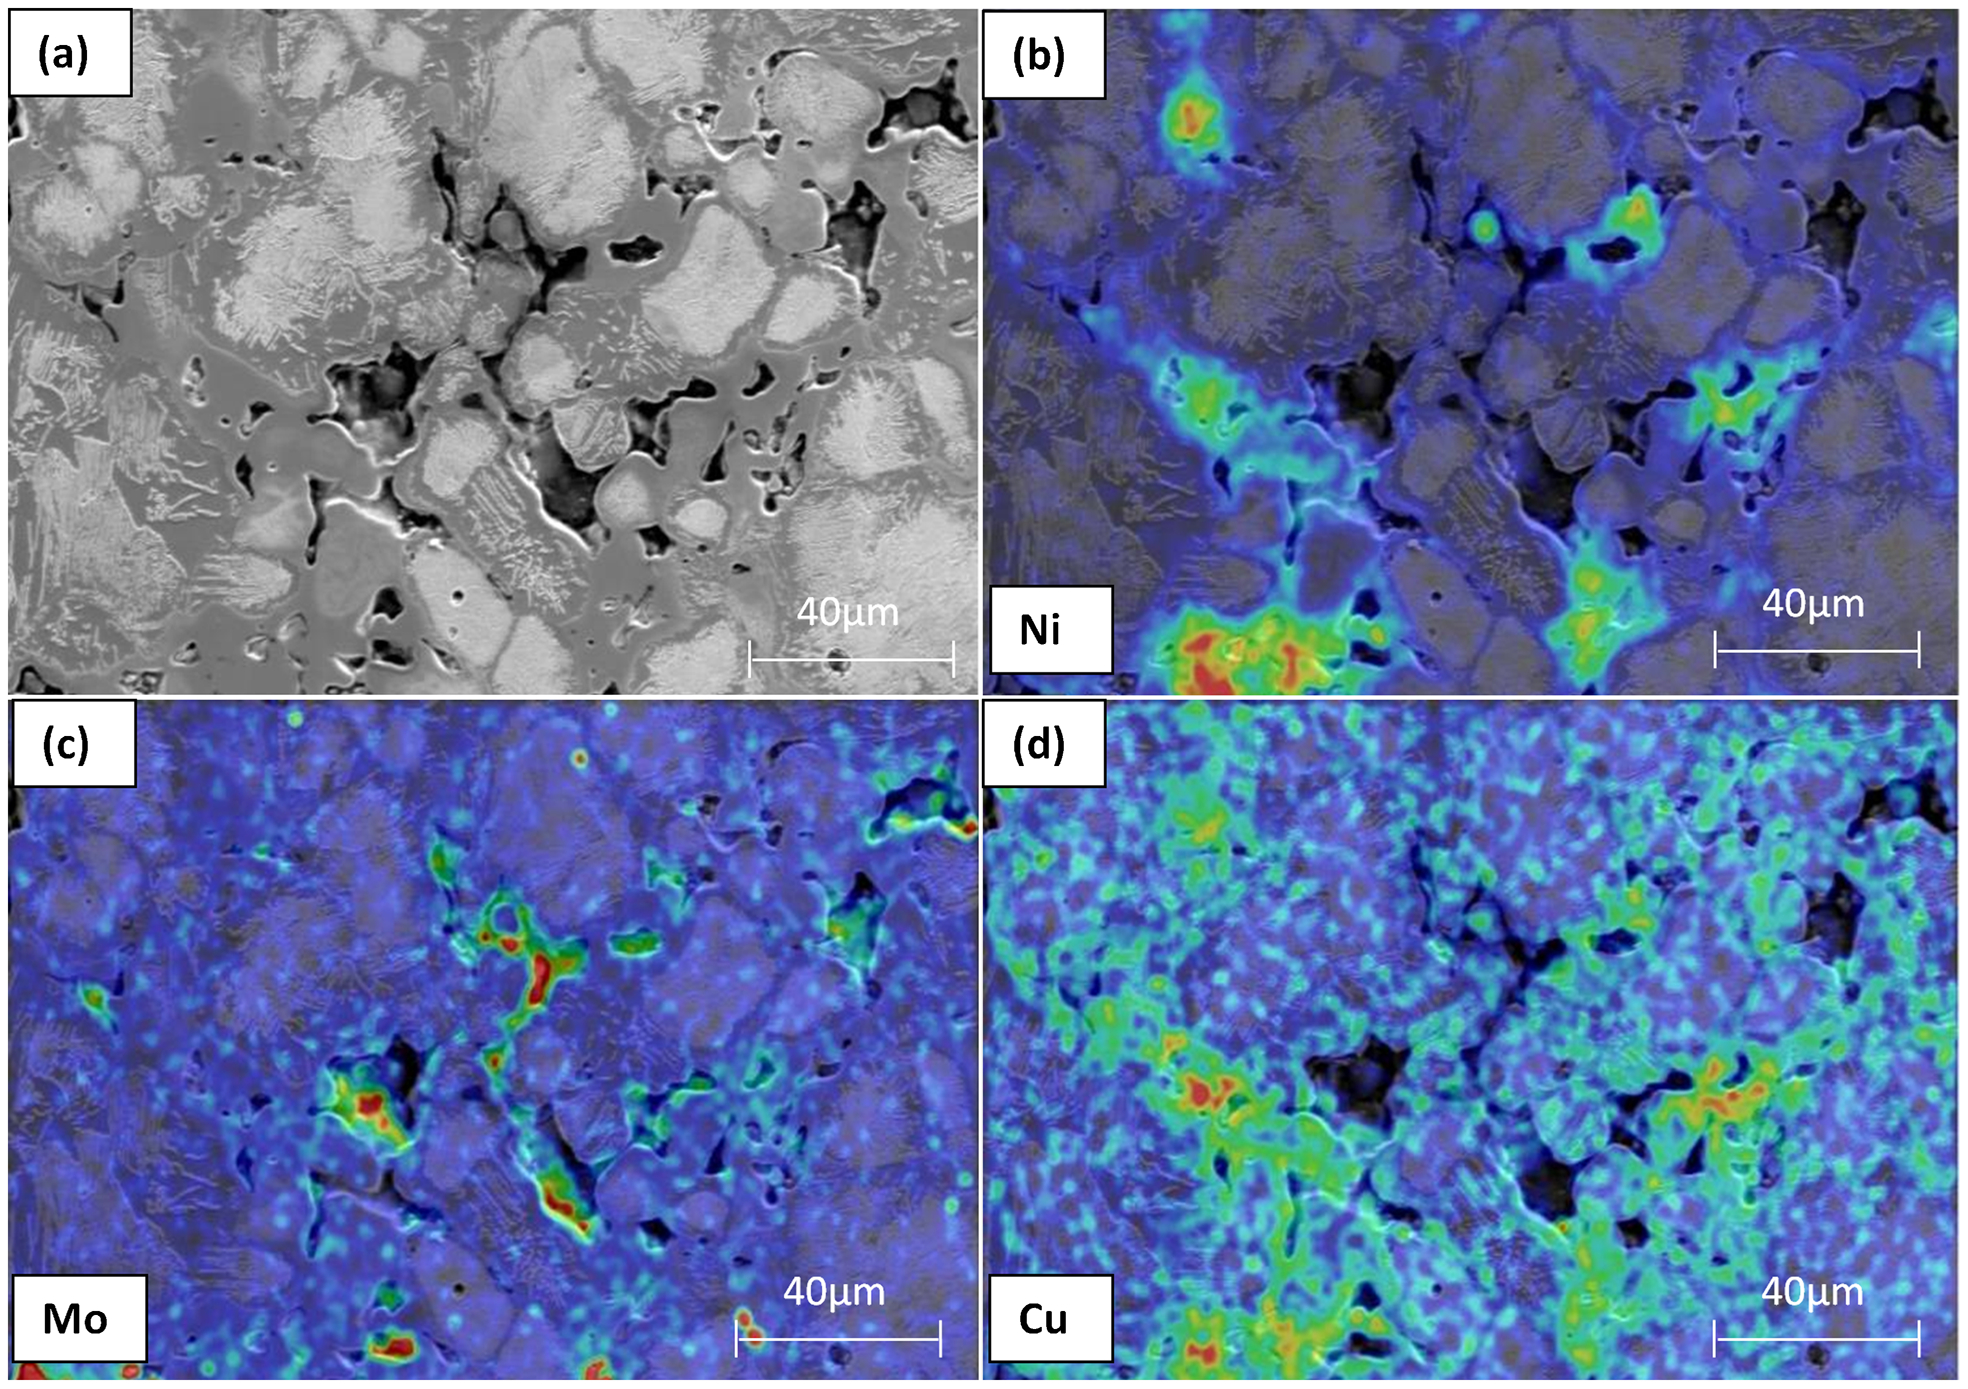
a microstructure; b Ni mapping; c Mo mapping; d Cu mapping
Conclusions
The addition of Mo to the Fe–Ni system did not show any considerable effect on the distribution of Ni.
The Ni distribution was improved by Mo when added to Fe–Ni–C.
Addition of Cu to Fe–Ni enhances the distribution of Ni due to solubility of Ni in the liquid phase during sintering. The distribution of Ni can be further improved by lowering the surface tension of the Ni–Cu liquid by introducing other elements.
There is an interaction between Ni and C which has a negative influence on the distribution of Ni. This effect was clearly seen for the commercial alloys, but it was not found in the model alloys. The reason for the difference between commercial and model alloys is due to the presence of higher Ni content in commercial alloys.
Footnotes
Acknowledgements
The authors would like to thank Höganäs AB for financial support and opportunity to use the research facilities. The authors are grateful to Ola Litström for useful discussion and Marja Haglund for assistance with SEM–EDX analysis.