
Abstract
This study investigated the surface hardening of AISI 4340 steel by linear oscillation scanning with a fibre laser. Various frequencies and amplitudes of oscillation were used under laser power of 2020 and 3020 W. Microscopic evaluation was done, and the effect of oscillation frequency on the hardened depth was examined. Hardness profiles were measured along the centre of the irradiated track toward the feeding direction of the laser, across the irradiated width and into the depth below the irradiated surface. The homogeneity of hardness and hardened depth with different processing parameters was investigated. The hardness profiles were compared with the results obtained with conventional single track hardening.
Introduction
Laser surface transformation hardening is a process of producing hard, wear resistant regions on the workpiece while retaining the base material unaffected,1 – 3 which typically uses a defocused laser beam with the laser energy density in an order of magnitude of 103–104 W cm−2.1, 4 A focusing lens can be simply used to produce an out of focus laser beam profile, while the width of the irradiated track is limited by the laser spot size, and the laser energy distribution is mostly inhomogeneous. Multitrack hardening has been investigated for the purpose of large area treatment, but the decrease in hardness in the overlapping zone due to tempering remains to be a problem.5, 6 Various types of special shaping optics have been developed as an advanced solution to produce a desirable shape (e.g. rectangle) and size of the laser spot with relatively homogeneous energy distribution.7 – 9 However, such optics are relatively expensive, and their flexibility in use is considered to be limited.
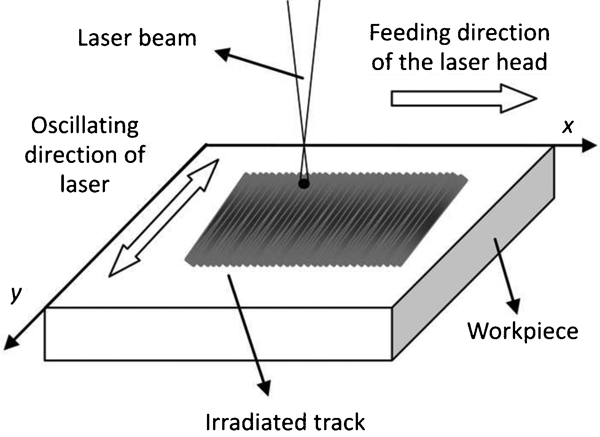
Laser linear oscillation scanning (LLOS) provides an alternative method for generating laser irradiated track with customisable width, as described in Fig. 1. A raw laser beam is converted by the oscillation scanner to a linearly oscillating beam that scans the sample's surface back and forth in the direction of the y axis. As the oscillating laser beam moves along the x axis, a laser irradiated track in a zigzag pattern is produced on the workpiece. This process is, in nature, a continuous multitrack surface irradiation in which the treated region consists of a number of overlapped laser irradiated tracks. Such studies as LLOS are thought to have good potential for practice, yet such studies have been rarely available so far.
Scheme of LLOS process
In recent years, diode pumped fibre laser systems have been developed and proved to be applicable in the surface treatment of steel.10 – 13 Owing to the simplicity and integratability of fibre laser, an oscillation scanning head can be installed easily with an external controller unit connected.14
Experimental
Material and methods
The tested material was AISI 4340 steel, which was a quenched and tempered low alloy steel composed of tempered martensite structures.15 The composition of the material is 0·347C–0·331Si–0·007V–1·397Cr–0·697Mn–1·355Ni–0·169Mo (wt-%). The initial hardness of the base material was 329 HV. The surface roughness of the samples, Ra, was 2·5 μm.
This study used a work cell consisting of a CNC XY work table, a YLR-5000-S multimode fibre laser system and an ILV DC scanner installed as the laser head. The fibre laser produced a laser beam with a wavelength of 1070–1080 nm and a maximum nominal output power of 5 kW. An output fibre core with the diameter of 200 μm was used. The DC scanner, which was primarily designed for laser welding applications, contained a parabolic scanner mirror with focal length of 250 mm and a controller unit connected to it. The distance off the focus was 60 mm, producing a laser spot of 2·1 mm in diameter. The oscillation speed was affected by the oscillation frequency and followed the sine waveform. The parameters are given as tests A1–A6 in Table 1. For comparison, a conventional single track scanning test was done, shown as tests B1 and B2 in Table 1. To produce laser power densities of 15136 and 22629 W cm−2, 2020 and 3020 W laser power with 75 mm off focus distance were used respectively. The feeding speed was constantly 15 mm s−1 in the whole test.
Processing parameters
Modulation of laser power profile
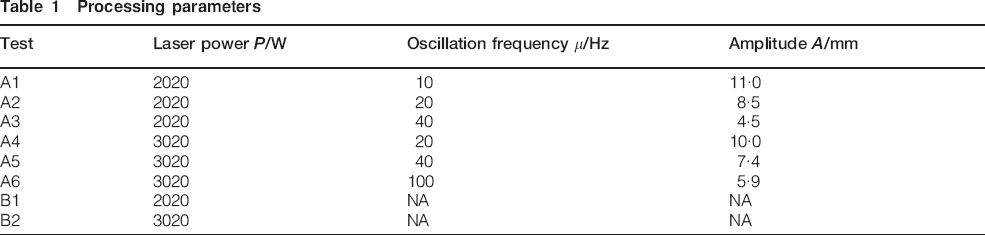
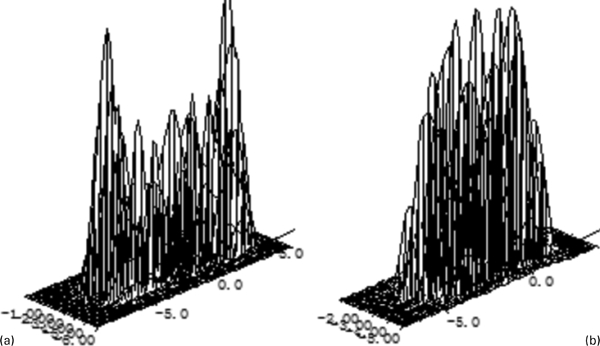
Figure 2a shows the laser energy distribution with oscillation frequency of 100 Hz and amplitude of 6·2mm produced by the DC scanner. Since the oscillation speed was reduced to 0 at the edge of oscillation, in order to avoid melting, the output laser power was modulated by programming via the controller unit. As shown in Fig. 3, the output laser power was programmed at 19 positions with equal spacing across the irradiated width, producing an approximated sine wave laser power profile with peak laser power of 2020 and 3020 W respectively and with 300 W laser power at both edges of oscillation. Since the oscillation speed followed the sine waveform as mentioned above, the ratio of oscillation speed to output laser power could be regarded as constant. Figure 2b shows a controlled laser beam profile featuring reduced laser power density near the edge of oscillation. The average laser power densities measured were 14 483 and 21 691 W cm−2 under 2020 and 3020 W laser power respectively, which were close to those produced by the single track scanning mentioned above.
Laser energy distribution produced by DC scanner with oscillation frequency of 100 Hz and amplitude of 5·9 mm: a without power control; b with power control via controller unit
Programmed laser power output via controller unit of DC scanner
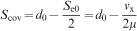
Calculations
Scanning speed
The scanning speed is the combination of the oscillation speed and the feeding speed of the laser. Since the oscillation speed (vy) is in sine waveform, it can be written as
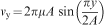
Moreover

The scanning speed (v) is therefore
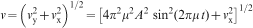
The average oscillation speed (
 ) is
) is

 are calculated for the parameters of oscillation test in Table 1 using equations (2) and (4). The oscillation speed of the test is described in Fig. 4, obtained on the basis of equation (1). It can be markedly seen that
 is dramatically higher than vx (15 mm s−1) in this study, and thus, v can be treated as v = vy in equation (3), although at the edges of oscillation vy = 0 and v = vx.
Oscillation speed of test
Overlap width of adjacent tracks
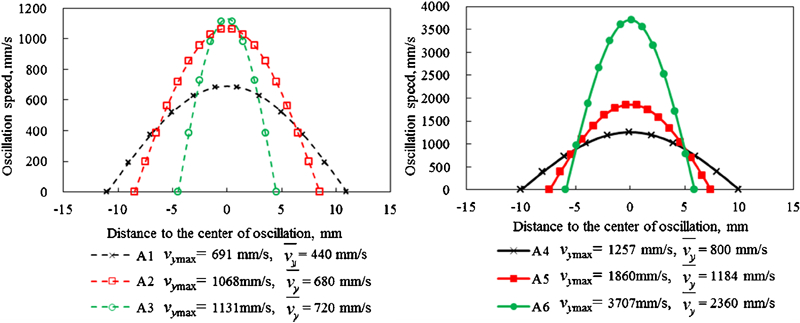
Figure 5 schematically describes the overlapped neighboring tracks of LLOS. The laser spot starts from position O1 and reaches O2 in one period of oscillation. At the edge of oscillation, the laser spot moves along the feeding direction with a distance, which can be calculated as

Schematic diagram of overlapped adjacent tracks in LLOS
Thus, the overlap width at the edge of oscillation Seov can be expressed as

Substituting equation (5) with equation (6) gives

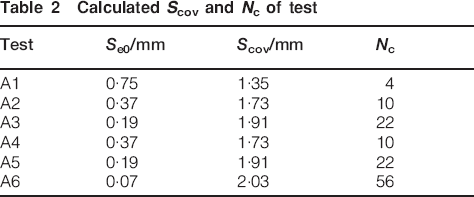
Number of scans spot experiences in centre of oscillation
During the oscillation scanning process, a position in the middle of the oscillation width may experience multiple times of laser irradiation. According to Fig. 5, the number of scans Nc is the integral part of the ratio of d0/Se0, which can be expressed as


Calculated Scov and Nc of test
Hardness measurement
The hardness measurement was done on a Vickers hardness tester with a load of 100 g. Three series of positions in the tested samples were measured (Fig. 6). Series 1 was along the centre of the irradiated area toward the feeding direction. The starting point was randomly selected. Series 2 was across the whole irradiated width of the cross-section. Series 3 was along the depth below the centre of the irradiated track. Measurements of series 1 and 2 were done at 0·05 mm depth below the surface, which was assumed to have nearly identical hardness to the surface. In this study, the hardened depth is defined as the depth where the measured hardness decreases to below 400 HV.
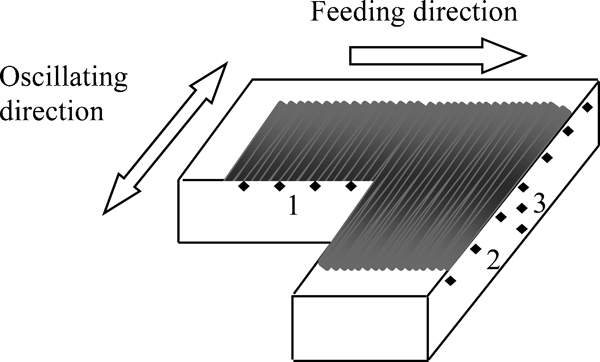
Hardness measurement positions of samples
Results and discussion
Figures 7–9 show the hardness profiles measured along the centre of the irradiated track, across the irradiated width and into the depth below the surface. Results obtained with various frequencies and amplitudes of oscillation are shown under 2020 and 3020 W laser power respectively. Hardness profiles acquired with single track scanning are included as well for comparison.
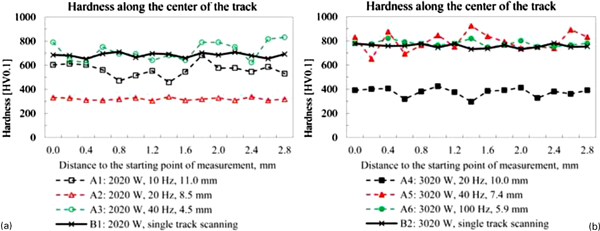
Hardness profile along centre of irradiated track with laser power of a 2020 W and b 3020 W
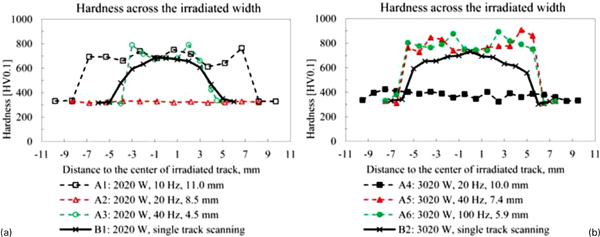
Hardness profile across irradiated track with laser power of a 2020 W and b 3020 W
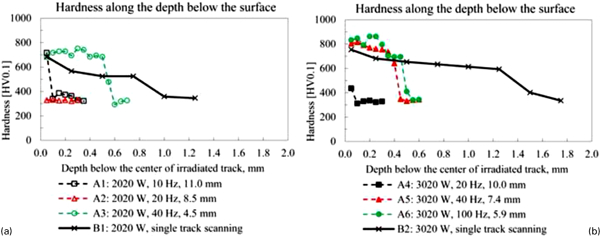
Hardness profile along depth below irradiated track with laser power of a 2020 W and b 3020 W
Hardness profile along centre of irradiated track
As shown in Fig. 7a, tests A1 and A3 produced surface hardness values of 460–703 and 652–831 HV respectively, which were relatively inhomogeneous. Test A2 did not cause hardening of the material. Test B1 resulted in relatively homogeneous surface hardness of ∼684 HV, which was close to the average hardness of 717 HV caused by test A3. Figure 7b shows that test A4 caused little hardening effect, while individual scans might be distinguished by the variation of hardness. The marked hardness variation caused by A1 and A4 can be explained by the tempering effect.16 According to Table 2, the distances between adjacent tracks of A1 and A4 at the edge of oscillation were 0·75 and 0·37 mm respectively, which were much larger than A6 (0·07 mm). Test A6 with oscillation frequency of 100 Hz produced an overlap width of 2·03 mm, which was 96·7% of the whole laser spot diameter (2·1 mm). This might have resulted in massive tempering covering almost the whole irradiated area and thus resulted in homogeneous surface hardness. Tests A5 and A6 caused respective average hardness of 795 and 777 HV, which were similar to the hardness of 767 HV produced by test B2. As markedly noticed, the hardness variation by test A6 was much smaller than that by test A5, which was caused by the higher scanning frequency of A6 (100 Hz), compared to A5 (40 Hz).
Hardness profile across irradiated width
Figure 8 indicates hardness across the width of the irradiated track. Noticeably, in the results of tests A1, A3, A5 and A6, the highest hardness was not achieved in the centre of the track but millimeters away from it. The maximum hardness values obtained were 764, 790, 909 and 892 HV for tests A1, A3, A5 and A6 respectively. For tests A3, A5 and A6, the maximum hardness was achieved at ∼2·5, 4 and 2 mm respectively, considerably higher than the average of the measured hardness along the centre of the track (Fig. 7). According to Fig. 5, this was possibly caused by the tempering effect, which was stronger in the centre of oscillation than elsewhere. According to equation (2), reducing the oscillation frequency and/or the amplitude can decrease the maximum oscillation speed. Compared with test B1 with 2020 W laser power, tests A1 and A3 produced similar hardness in the centre of the track, as shown in Fig. 8a. However, test A1 generated a much larger irradiated width, and test A3 markedly produced higher average hardness across the track. Similarly, as denoted in Fig. 8b, tests A5 and A6 both produced wider hardened tracks with higher average hardness than test B2. Figure 8a shows that test A2 did not cause hardening at all but retained the hardness values of the base material. Figure 8b denotes that test A4 caused very slight hardening, indicating that a small amount of martensite might have formed on the surface.
Hardness profile along depth below irradiated track
Figure 9 compares the hardness profiles along the depth beneath the irradiated track. As seen in Fig. 9a, test A2 did not cause hardening. Tests A1 and A4 produced very small hardened depth of <∼0·1 mm. As compared in Fig. 9a, tests A3 and B1 produced hardened depth of ∼0·55 and 0·9 mm respectively. However, between the surface and 0·5 mm depth, test A3 generated fairly consistent hardness of 682–751 HV, markedly higher than single track scanning test B1 that caused 524–683 HV. Similar phenomena were noticed in Fig. 9b. Regarding the hardness from the surface to 0·4 mm deep, tests A5 and A6 generated 641–803 and 693–831 HV respectively, which were higher than the hardness of 593–753 HV acquired by test B2. Tests A5 and A6 produced hardened depth of 0·4 and 0·5 mm respectively, which were much smaller than the 1·5 mm hardened layer by test B2. This is believed to be due to the high scanning speed in the middle of oscillation, which did not allow sufficient heating in a large depth of the material.
Microscopic evaluation
Microscopic observation on the microstructure of the tested samples provided a direct and qualitative way to visually evaluate the experimental effect. Samples tested with different laser power, frequency and amplitude of oscillation are compared in Fig. 10, which shows the microscopic view below the centre of the irradiated area toward the feeding direction of the laser beam.
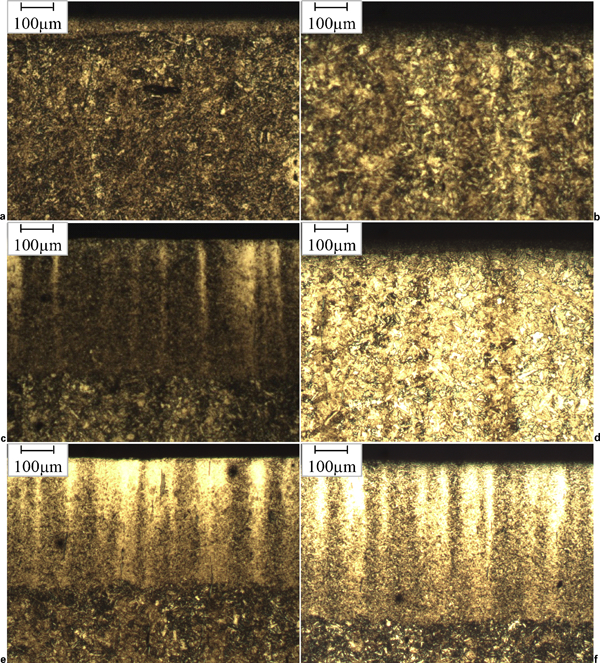
Microscopic view below centre of irradiated surface of samples tested with different laser power, frequency and amplitude of oscillation respectively: samples were etched with 5% nital: a A1: 2020 W, 10 Hz, 11·0 mm; bA2: 2020 W, 20 Hz, 8·5 mm; c A3: 2020 W, 40 Hz, 4·5 mm; d A4: 3020 W, 20 Hz, 10·0 mm; e A5: 3020 W, 40 Hz, 7·4 mm; f A6: 3020 W, 100 Hz, 5·9 mm
As measured in Fig. 10, the depths of the heat affected zone (HAZ) produced by tests A1–A6 were respectively ∼0·05, 0, 0·45, 0·05, 3·8 and 4·5 mm, which were well in accordance to the hardened depth indicated in Fig. 9. Figure 10c, e and f shows that HAZ acquired with 40 and 100 Hz were much deeper. No HAZ was observed in Fig. 10b, meaning that phase transformation did not occur on the sample. According to equation (2), the oscillation speed produced with 20 Hz and 8·5 mm amplitude might be too high to allow sufficient absorption of laser energy. Tests A2 and A3 were done with both 2020 W laser power and, according to equation (2), with very close oscillation speed. However, the depths of HAZ were dramatically different by comparing Fig. 10b and c. A possible explanation is that with higher oscillation frequency, the scanned surface experienced more cycles of irradiation, which meant more absorption of laser power. Figure 10a and d with 10 and 20 Hz respectively shows very small and inhomogeneous HAZ depths, which might be caused by the distinguishable adjacent tracks. Differently, the individual scans could not be distinguished with 40 and 100 Hz in Fig. 10c, e and f. As shown in Table 2, this can be explained by the large overlap width and large number of overlapped scans under the frequencies of 40 and 100 Hz.
Conclusion
The LLOS test was done on AISI 4340 steel with different frequencies and amplitudes of oscillation. The results were investigated and compared with single track hardening process. A local position in the centre of oscillation might receive up to tens of times of scanning, depending on the laser spot size, oscillation frequency and feeding speed of the laser head. The hardened depth could be increased by applying higher oscillation frequency of scanning. Under the feeding speed of 15 mm s−1, individual scans could be distinguished with 10 and 20 Hz. Along the centre of the irradiated track, the hardness profile with oscillation frequency of 100 Hz was more homogeneous than with 10, 20 and 40 Hz and was close to single track scanning. With LLOS, the maximum hardness might be acquired at millimeters away from the centre of the track. A higher overall hardness on the laser irradiated surface was produced with LLS than with single track hardening, and LLOS with the oscillation frequencies of 40 and 100 Hz caused higher hardness in the hardened layer. Furthermore, LLOS was proved to be suitable for surface hardening in a relatively large rectangular area with considerable depth of hardening. Within the hardened depth of 0·6 mm, LLOS at 40 and 100 Hz produced higher hardness than single track hardening. However, the maximum achievable hardened depth produced by LLOS was notably limited in comparison to conventional single track scanning.
Footnotes
Acknowledgements
The authors are very much grateful to Mr A. Anonen of Ovako Oy who kindly provided the tested materials, Mr I. Poutiainen and Mr P. Kokko of LUT who arranged the experiment and Mr E. Lappalainen of LUT who gave instruction on making the measurements. Without their support, this study would not have been completed.