
Abstract
This study investigates the microhardness and microstructure of different steels hardened by a fibre laser. Rolled steel, quenched and tempered steel, annealed alloyed steel and conventionally through hardened steel were tested. Microhardness (HV0·01) was measured in martensite, pearlite, ferrite and cementite structures at different depths below the laser irradiated surface. The microhardness results were compared with the conventional macrohardness (HV5) results. The grain size of rolled ferritic–pearlitic steels had distinct effect on microhardness. The macrohardness of quenched and tempered steel might be markedly influenced by the homogeneity of alloy contents. In high carbon steel, cementite is ∼150 HV harder than pearlite. Annealed alloyed steels achieved high surface hardness but poor hardened depth. Dispersed granular pearlite did not affect the microhardness of soft annealed steel. The macrohardness of the base material was close to the microhardness of the softer phase structure. The measured microhardness was about 100–250 HV higher than the macrohardness.
Introduction
Laser transformation hardening is a well known process of producing hard, wear resistant areas on the workpiece while retaining the bulk material unaffected. A defocused laser beam is usually used to heat up the material surface above its austenisation temperature, allowing formation of austenite. The base material surrounding the laser irradiated area acts as a heat sink, causing quick self-quenching and phase transformation to martensite.1 – 4 Surface hardening of steel has been mostly studied with conventional hardness measurement, which typically uses a load of several kilograms. However, metallographic analysis of specific phases and microstructures frequently demands local hardness measurement within a small scale such as tens of micrometres. Unfortunately, such investigations on phase transformation and microstructural transition of laser surface hardened steel are not much available. A microhardness test device uses a very small load (down to a few grams) and is capable to produce indentations within a few micrometres in diameter, making precise local and even in grain hardness measurement possible.5 – 7 Microhardness measurement also provides a basis for quality control of thin metallic material and small parts of precision instruments.
In recent years, diode pumped fibre laser systems have been quickly developed for industrial applications.8 – 11 Fibre lasers are expected to be suitable for surface treatment of carbon steels, as the wavelength of radiation produced by laser diodes can be efficiently absorbed by iron based materials.12 – 14
This study investigated the microhardness of martensite, pearlite, ferrite and cementite on various laser irradiated carbon steel samples. Microhardness was measured at the irradiated surface at different depths of the heat affected zone (HAZ) and in the base material. Macrohardness measurement was performed for comparison regarding carbon and alloy content and grain size. Quenched and tempered steels were compared with other materials on the microhardness and homogeneity with respect to the initial microstructures.
Experimental
The experiment was performed in a work cell consisting of a CNC XY table and a YLR-5000-S fibre laser equipment that produces a laser beam with a wavelength of 1070–1080 nm and a maximum nominal output power of 5 kW. The experiment used a focusing lens with a focal length of 150 mm and an output fibre core diameter of 200 μm. All the tests were performed with a constant laser power of 1875 W and a distance off the focus of 80 mm, producing a laser power density of 12 735 W cm−2. A constant traverse rate of 8·0 mm s−1 was used. The angle between the optical axis and the surface of the sample was 90°. No shielding gas was used. The samples were air cooled after the treatment.
The hardening tests were performed on low, medium and high carbon steel samples with various alloy contents, grain sizes and initial microstructures as given in Table 1. Sample 1 (case hardening steel) and sample 3 (as rolled high silicon steel) contained ferrite and pearlite with distinct grain boundary. Sample 4 (ball and roller bearing steel) consists of pearlite and cementite grains. Sample 2 (alloyed steel) and sample 5 (vacuum degassed Cr–Ni–Mo alloyed mould steel) were composed of tempered martensite structures. Sample 6 (alloyed tool steel) and sample 7 (hot work die steel) contained ferrite and fine granular pearlite.15 The ASTM grain size number was measured in samples 1, 3 and 4 via the mean grain diameter method.16 As samples 2, 5, 6 and 7 did not contain distinct grain boundaries in their microstructures, their grain sizes were not available. The surface roughness of all samples Ra was ∼2·5 μm.
Samples used in test*
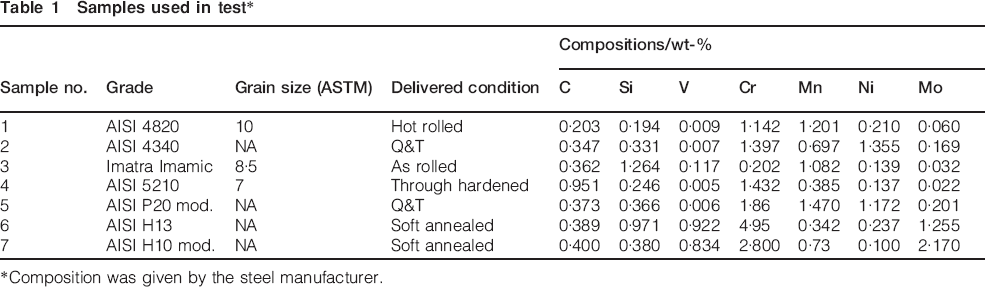
Composition was given by the steel manufacturer.
The macrohardness (HV5) of the samples was measured with a conventional Vickers hardness tester using a 5 kg load. A CSM microhardness tester with a 10 g load was used for microhardness (HV0·01) measurement. Five random measurements were performed at each of the measured depths in each appropriate phase structure. Besides measurement of martensite, in grain microhardness measurement was performed in pearlitic and ferritic grains of samples 1 and 3 and pearlitic and cement grains of sample 4. For samples 2, 5, 6 and 7, the microhardness was measured according to the depth only. The average value was used as the macro- and microhardness at this depth. Hardened depth in this study was defined as the depth where measured macrohardness was >500 HV below the centre of the laser irradiated track. Besides, carbon and alloy content were measured on samples 2 and 5 with energy dispersive spectroscopy method (EDS) combined with a scanning electron microscope.
Results and discussion
Figures 1–3 contain the measured hardness profiles along the depth below the laser treated surface of the materials. The micro- and macrohardness of various phase structures at different depths are compared. The microscopic views of the microstructures at the surface, in the HAZ and in the base material are shown in Figs. 4–6.
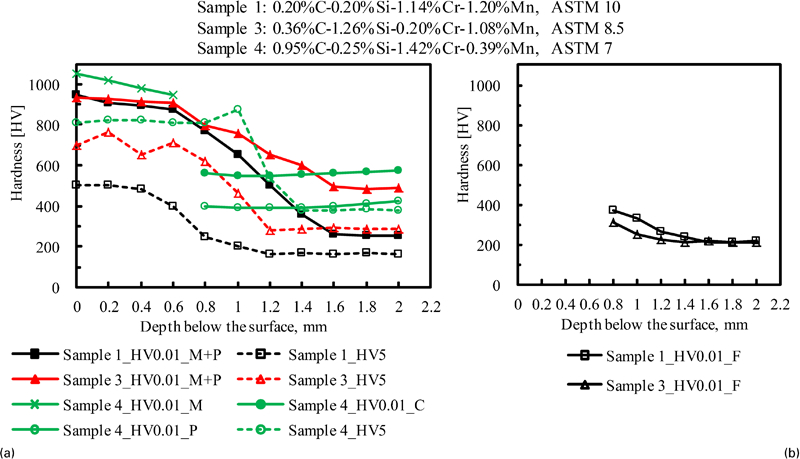
Hardness profiles along depth of samples 1, 3 and 4
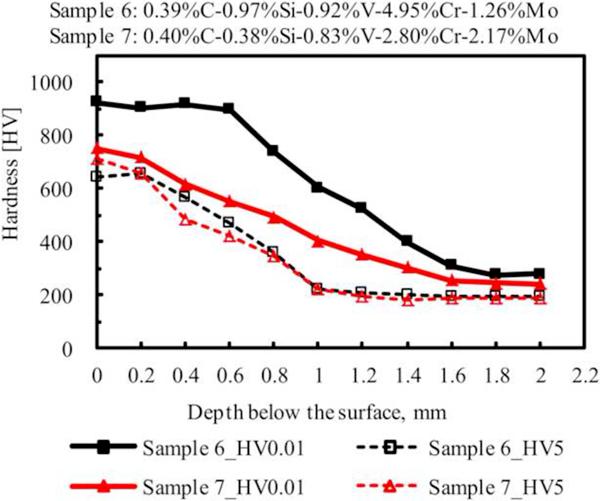
Hardness profiles of samples 6 and 7 along depth of material (microhardness: HV0·01; macrohardness: HV5)
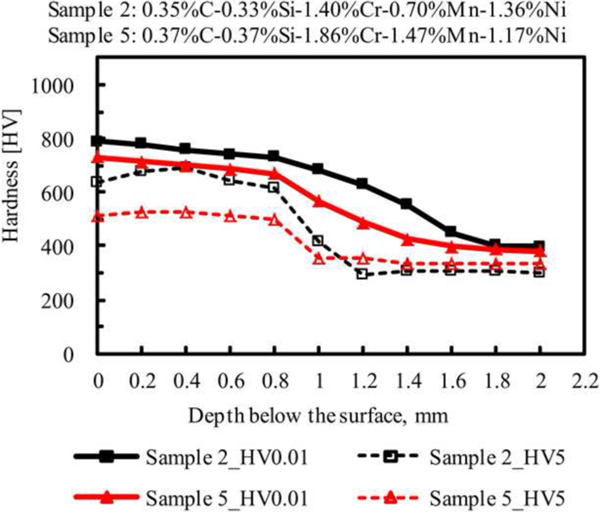
Hardness profiles of samples 2 and 5 along depth of material (microhardness: HV0·01; macrohardness: HV5)
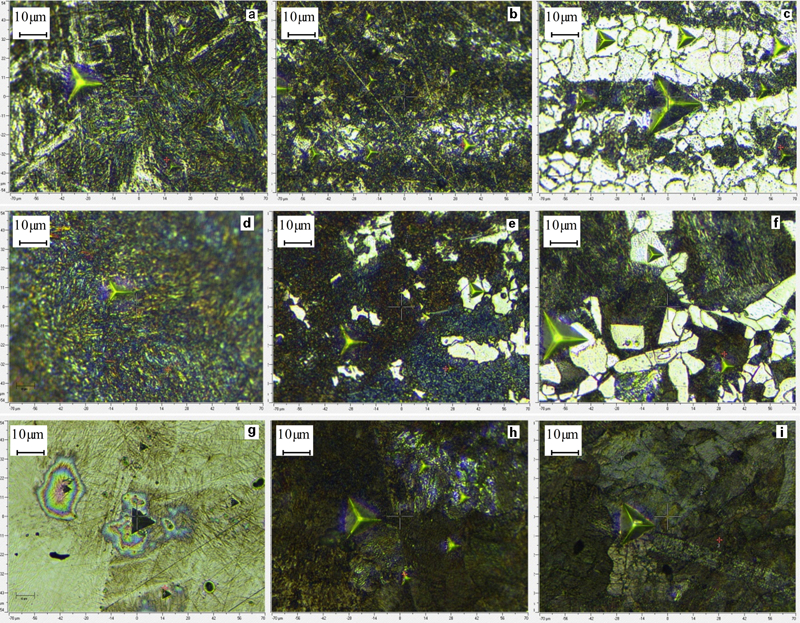
Microstructures of samples 1, 3 and 4 at various depths (etched by 5% nital)
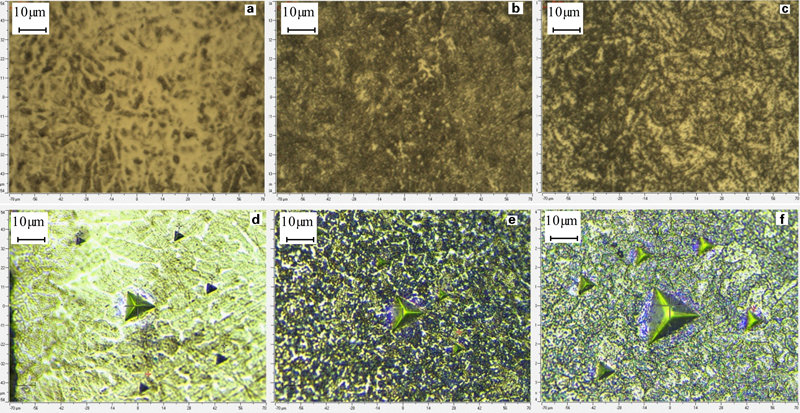
Microstructural comparison of sample 6 (etched by 20% nital) and sample 7 (etched by 10% nital) at various depths
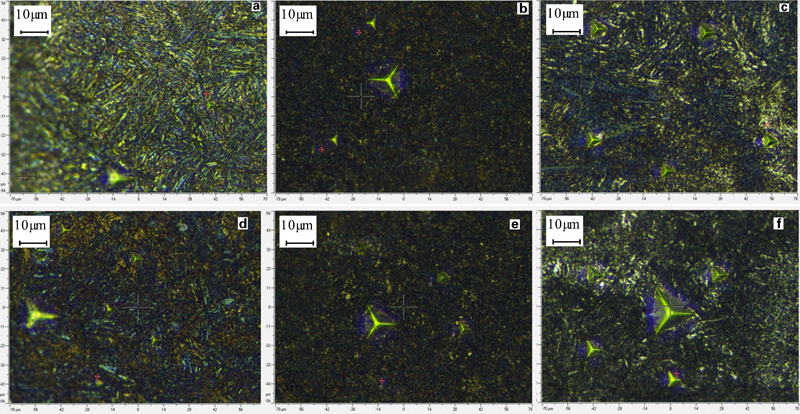
Microstructural comparison of samples 2 and 5 at various depths (etched by 5% nital)
Hardness and microstructure of rolled medium carbon steel and through hardened high carbon steel
Figure 1 describes the micro- and macrohardness of rolled medium carbon steels (samples 1 and 3) and the through hardened high carbon steel (sample 4). The corresponding microstructure in different depths of the samples is seen in Fig. 4. The surface microstructure of samples 1, 3 and 4 is fully martensitic as can be noticed in Fig. 4a, d and g. As expected, the surface macrohardness is fully dependent on the carbon content. The macrohardness of samples 1, 3 and 4 is 505, 704 and 812 HV with 0·20, 0·36 and 0·95% C respectively (Fig. 1a). However, interestingly, the microhardness of martensite grains in the same structures is not much different. The microhardness on the surface of samples 1, 3 and 4 are 945, 938 and 1051 HV respectively. The difference in the behaviour between micro- and macrohardness is discussed in more detail in the section on ‘Microhardness (HV0·01) versus macrohardness (HV5)’. Deeper from the surface, the ferritic–pearlitic structures in samples 1 and 3 can be distinguished, and in sample 4, pearlite and cementite grains can be seen (Fig. 4c, f and i).
As Fig. 1a shows, the microhardness of samples 1, 3 and 4 starts to dramatically decrease between 0·6 and 0·8 mm deep, which can be presumed to be the depth of fully martensitic layer. For samples 1 and 3, partially martensitic structure may be present between 0·6 and 1·6 mm, causing gradually reduced microhardness. In sample 1, pearlite at 0·8 mm deep (HAZ) shows higher microhardness (761 HV) than the base material (252 HV). This is possibly caused by homogenisation with decreased grain size and can be noticed by comparing Fig. 4b and c. Similarly, in sample 3, at the depth of 0·8 mm, pearlite gives markedly high microhardness of ∼796 HV compared with the base material (490 HV). Comparison of grain size can be seen in Fig. 4e and f. Different from samples 1 and 3, sample 4 shows respectively constant microhardness of cementite and pearlite at 0·8 mm deep and beneath. Because of the high carbon content and the presence of ferrite only in the pearlite grains, carbon diffusion may have been largely restrained, and the original grain size is not much changed. As the in grain indentation shows, the microhardness of cementite (∼559 HV) is distinctly higher than pearlite (∼413 HV) because cementite consists of pure iron carbide.
As seen in Fig. 1b, the microhardness of ferrite of samples 1 and 3 at 0·8 mm deep is respectively 376 and 315 HV, which is considerably higher than in the base material (216 HV at 2 mm deep). As exhibited in Fig. 4b, this is likely due to the reduced grain size of ferrite caused by recrystallisation. In deeper structures, microstructural grains remain larger since less grain boundaries are formed inside the original ferrite grains (Fig. 4c and f). At the depth of 0·8 to 1·6 mm, sample 1 shows higher microhardness of ferrite than sample 3, although sample 3 contains much higher Si content that aids to increase the hardness of ferrite.16 This is likely due to the markedly larger ferritic grain size of sample 3 compared with sample 1, as seen in Fig. 4b and e. See the explanations of microhardness measurement in the section on ‘Microhardness (HV0·01) versus macrohardness (HV5)’.
Figure 1 also indicates that the macrohardness of the base material is close to the microhardness of the softer phase structure. For samples 1 and 3, the microhardness of ferrite is close to the macrohardness. For sample 4, the macrohardness is approximately equal to the microhardness of pearlite. An explanation is the plastic deformation of different structures as macrohardness indentation is performed. A load of several kilograms used in Vickers hardness test drives the diamond indenter into the material, causing plastic deformation of a number of micrograins nearby the produced marker. In ferritic–pearlitic structure, ferrite contains almost pure α-iron, and pearlite includes 88% ferrite and 12% cementite. Owing to the body centred cubic crystal lattice structure of α-iron, ferrite grain is thought to have lower yield point than cementite (Fe3C) that features orthorhombic structure.17 Thus, ferrite grains could be more plastically deformed than pearlite grains, and this might significantly affect the measured macrohardness value.
Hardness and microstructure of soft annealed alloyed steel
In Fig. 2 the micro- and macrohardness of the soft annealed samples 6 and 7 are shown. The corresponding microstructure in different depth of the samples can be seen in Fig. 5. Sample 7 shows a bit higher macrohardness on the surface than sample 6 (Fig. 2). The macrohardness values are 647 and 716 HV for samples 6 and 7 respectively. Yet, sample 6 exhibits drastically higher microhardness than sample 7 on the surface and until 1·6 mm deep. Consistent microhardness of >850 HV between the surface and 0·6 mm deep is noticed. These are believed to be caused by the high Cr (4·95%) and Si (0·97%) contents in sample 6. Figure 5 shows the microstructures of samples 6 and 7 at the treated surface, at 0·6 mm deep and in the base material. Owing to the soft annealing treatment in the manufacturing process, samples 6 and 7 consist of ultra fine granular pearlite structure, which is dispersed in the ferrite grains, and therefore grain boundary is hardly distinguishable. Grain growth can be noticed on the treated surface of both materials, showing visible ferrite boundaries among the formed martensite areas. The transitional layer at the depth of 0·6 mm indicates that carbon diffuses from the fine granular pearlite to the surroundings and causes local homogenisation. A similar HAZ to the depth of ∼1·8 mm is produced in both samples.
Hardness and microstructure of quenched and tempered steel
Figure 3 gives the micro- and macrohardness of quenched and tempered steel (samples 2 and 5). The corresponding microstructure in different depths of the samples can be seen in Fig. 6. As compared in Fig. 3, sample 2 shows higher micro- and macrohardness and larger hardened depth, although sample 5 contains similar carbon and higher alloy contents. In order to find an explanation for this discrepancy, EDS was used. The results of EDS element content analysis are shown in Fig. 7. In the base material of samples 2 and 5, 15 circular areas of 5 μm in diameter were randomly selected, and the weight percentages of C, Cr and Mn were measured. The variation of the mass percentage indicates that Cr and Mn are markedly more homogeneous in sample 2, which is likely due to the process of production by the manufacturer. Figure 6a and d also shows visible difference on the samples’ irradiated surfaces. It is suspected that the inhomogeneity might have caused the formation of retained austenite in sample 5. Yet, this is not conclusive before X-ray diffraction test of the microstructures is performed. The macrohardness profiles exhibit a heat affected depth of ∼1 mm on both samples.
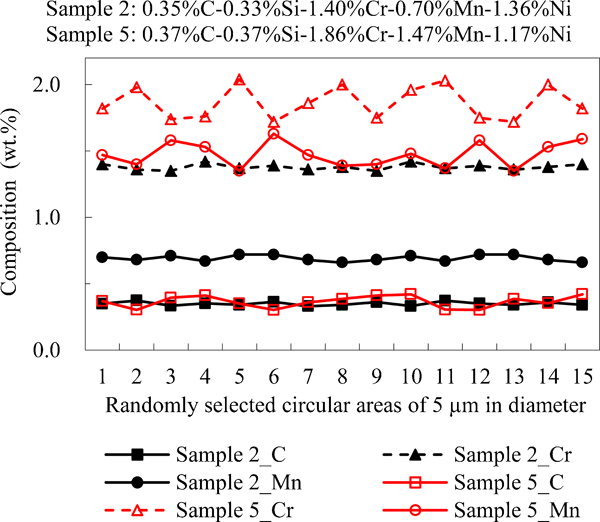
Element analysis (SEM) of C, Cr and Mn on samples 2 and 5
Comparison among sample 2 (quenched and tempered steel), sample 3 (rolled steel) and sample 7 (soft annealed alloyed steel)
Samples 2, 3 and 7 are compared based on Figs. 1–3. Samples 3 and 7 give similar surface macrohardness of 704 and 718 HV respectively, while sample 2 shows markedly lower surface macrohardness (635 HV). Despite high alloy content, sample 7 shows a smaller hardened depth of ∼0·4 mm than samples 3 and 2 (both ∼0·9 mm). With similar carbon content, sample 3 shows the highest surface microhardness. Compared in Figs. 4d and 5d, sample 7 shows some bright grain boundaries on the surface, which are suspected to be ferrite. This means large grain size in contrast to sample 3 that has apparently more homogeneous martensite. The microhardness in the base material of sample 7 is nearly equivalent to the in grain microhardness of ferrite in sample 3, showing that the dispersed granular pearlite has little effect on the microhardness.
Microhardness (HV0·01) versus macrohardness (HV5)
The microhardness (HV0·01) results are compared with macrohardness (HV5) of the tested samples in Figs. 1–3. Comparisons show that measured microhardness values are around 100–250 HV higher than macrohardness. An earlier developed model revealed the influence of indentation size on the measured hardness of crystal materials, as shown in equation (1).18 This model was later used as a base for microhardness simulations.19 Comparing indentations using a very small load (e.g. 10 g) and a conventional one (5 kg), Hd can represent the microhardness and H0 the macrohardness. Equation (1) indicates that the microhardness is constantly higher than macrohardness

The dislocation theory also provides a qualitative explanation for this phenomenon. It is summarised in generally known Petch–Hall relationship, as given in equation (2)

Compared with microhardness test, macrohardness indentation produces a deeper and wider mark that crosses a number of grains. Plastic deformation initiates at some of the sliding dislocations while new dislocations are created as well.20 Differently, microhardness indentation generates a much smaller marker, and thus, fewer grains are affected, meaning that fewer slidable dislocations are present as plastic deformation occurs. Therefore, Ri for microhardness indentation is expected to be higher, and Re is accordingly higher than that for macrohardness. In in grain microhardness measurement, since the indentation marker is smaller than the grain size, d can be regarded as infinitely large, and thus, in equation (2), Re is approximately equal to Ri. This means that the yield point for in grain indentation is basically determined by the properties of the in grain material. Equation (2) also indicates that a fine grained material with a smaller d may exhibit higher yield point and hardness than a coarse grained one.
Conclusions
This study investigated the microhardness of laser hardened medium carbon rolled steels, annealed alloyed steels, quenched and tempered steels and a high carbon through hardened steel. Microhardness was measured in martensite, pearlite and ferrite structures at different depths below the irradiated material surface. The micro- and macrohardness profiles of the samples were compared. Five random measurements of microhardness were performed at each of the measured depths in each appropriate phase structure. The average value was used as the result for discussion.
For rolled ferritic–pearlitic steels, grain size distinctly affected the homogeneity of martensite and the microhardness. Ferrite in the HAZ exhibited higher microhardness due to smaller grain size caused by carbon diffusion. By in grain indentation, the microhardness of ferrite (∼216 HV), pearlite (∼413 HV) and cementite (∼559 HV) were obtained. In ferritic–pearlitic and pearlitic–cement steels, the macrohardness of the base material was close to the microhardness of the softer phase structure. The homogeneity of Cr and Mn contents might have significant effect on the macrohardness of tempered martensitic steel.
Rolled steel, quenched and tempered steel and soft annealed alloyed steel of the same carbon content were compared. Rolled steel could achieve higher microhardness of martensite on the surface. Quenched and tempered steel showed similar hardened depth to rolled steel but lower macrohardness on the surface. The micro- and macrohardness of soft annealed alloyed steel were relatively high on the surface but markedly decreased along the depth, producing a relatively small hardened depth. The microhardness of the base material was similar to ferrite, indicating that dispersed granular pearlite had little effect on the microhardness.
In this study, the measured microhardness values were about 100–250 HV higher than macrohardness. This was explained by a model of indentation size effects and the dislocation theory.
Footnotes
Acknowledgements
The author is grateful to Mr A. Anonen of Ovako Oy, who kindly provided the tested materials, and to Mr A. Heikkinen and Mrs P. Hovila for their instructions on making the measurements. Without their support, this study would not have been possible.