
Abstract
Timber exposed in the ground faces most severe conditions in terms of exposure to wetting and fungal decay in the terrestrial environment, therefore wood durability tests are often conducted in test fields preferably ensuring the occurrence of all relevant decay organisms. One can also expect differences in decay within an individual field test site due to localised distribution of certain organisms. Therefore, relevant decay parameters were examined on the newly prepared in-ground test field in Herrenhausen, Hannover: Scots pine sapwood and European beech were exposed to record distribution of decay types, decay intensity and soil parameters. Soft and white rot were found to be dominating. Significant differences of the intrasite variability of decay intensity were observed between wood species and over time. In contrast, differences in decay intensity by different rot types were small. It was concluded that spatial differences in decay intensity were due to localised established fungal flora.
Introduction
Timber structures in ground contact are exposed to conditions that promote decay by a large number of decay types. Generally, the moisture conditions in soil provoke a continual decay hazard to wood, since wood moisture content in contact with the soil is normally well above fibre saturation. In natural forests, the high decay potential under in-ground conditions is the basis for cycling of matter, i.e. the decomposition of deadwood, and is therefore beneficial in terms of releasing nutrients necessary for new growth in living trees. In contrast, when timber in service is exposed in ground contact (UC 4), decay intensity leads to shorter service lives compared to exposing the same timber in situations above ground (UC 3).
Wood durability is traditionally tested in the ground. In so called ‘graveyard tests’, wood specimens of standard cross-section are buried to at least half of their length and exposed to natural microflora including soil inhabiting fungi and bacteria. Based on this principle, different standardised test methods are well established in numerous countries around the world (e.g. ASTM 2006, CEN 1989, GB/T 1992). Furthermore, laboratory decay tests have been developed which include exposure of wood to unsterile soil taken from the field (CEN 2001, 2005; Edlund 1998).
While it is without controversy that exposure in ground is the most severe environment for timber with the exception of marine testing, recently there has been debate about variations of in-ground decay potential and how this needs to be considered when assigning service lives. For instance, the latest version of the European standard EN 335-1 (CEN 2006) now recognises two subclasses (4·1 and 4·2) referring to different levels of severity within UC 4 (contact with ground or fresh water). However, the specific differences between the subclasses, which had previously been considered as one class, are not described in the standard. Solely a higher moisture induced decay risk is indicated for subclass 4·2.
Numerous studies have reported on the factors that influence wood durability in the ground: soil moisture content has a direct influence on wood moisture content and depends itself on the climatic conditions as well as on the soil substrate (Rahman and Chattopadhyay 2007). While high wood moisture contents (above fibre saturation) generally promote decay as do high temperatures, stagnant water has the opposite effect (Augusta 2007). Optimum conditions for decay can therefore be expected from warm, moist, but well ventilated soils. Furthermore, pH value, salinity, chemical composition and the amount of available nutrients play an important role on the decay intensity of a field as they determine the fungal flora, which can be established in the ground (Rayner and Boddy 1988; Schmidt 2006; Rahman and Chattopadhyay 2007). Decay rates strongly depend on the decay type, whereby soft rot, which can be found frequently in the ground, is normally considered to develop more slowly than white and brown rot. Consequently, in-ground test fields are known to provide different dominating decay types, e.g. brown rot in the ‘old field’ at Simlangsdålen (Sweden), but soft rot and tunneling bacteria in Ultuna (Sweden), and soft rot in Viikki (Finland), Tåstrup (Denmark) and Sørkedalen (Norway) as reported for these Nordic fields by Edlund (1998) and Edlund and Nilsson (1998). For determining wood durability and the relative protective effectiveness of wood preservatives, it is recommended that in-ground tests are undertaken at a minimum of three different test fields to include the full range of potential decay organisms (e.g. CEN 1989; Edlund and Nilsson 1998; Augusta 2007; Brischke et al. 2009). Beyond this biological parameter, the site specific decay potential depends on numerous physical and chemical factors, which have been intensively examined in the past (Nilsson and Daniel 1990; Johnson and Thornton 1991; Edlund et al. 2006; Brischke et al. 2009). As reported by Edlund (1998), differences in decay activity and intensity can be expected between fields which are located close to each other and presumably one can expect differences within one test field due to certain organisms being established locally. However, data on the intrasite variability of decay intensity are not readily available and variations in decay influencing soil factors within a field site have not been quantified in relation to the decay patterns before. The aim of this study was therefore to examine all factors known to influence wood decay on a newly prepared in-ground test field at Leibniz University Hannover: Scots pine sapwood (Pinus sylvestris L.) and European beech (Fagus sylvatica L.) specimens were exposed to record distribution of decay type and intensity and various soil parameters were examined.
Experimental methods
Test field: Physical data
Wood specimens were exposed on the new in-ground test field at Leibniz University Hannover, Institute of Vocational Sciences in the Building Trade in Herrenhausen, Hannover, Germany (geographic coordinates: 52°23′42·21″N; 9°42′06·95″E). The field is at an elevation of 50 m above sea level and has a total area of ∼244 m2 (Fig. 1). The field was surrounded by small trees and bushes to the north, west and south sides. Before the tests, the area was an old garden containing a variety of herbs, flowers and small bushes. Bushes and older roots of trees had been removed from the field before smaller herbs and grass were mulched down to a depth of ∼20 cm, which represented fresh biomass added to the ground. Afterwards, the whole area was planed using a rotary cultivator, and after initialisation of the durability tests the grass was regularly cut between the test specimens. Climate data for the Herrenhausen site are given in Table 1.
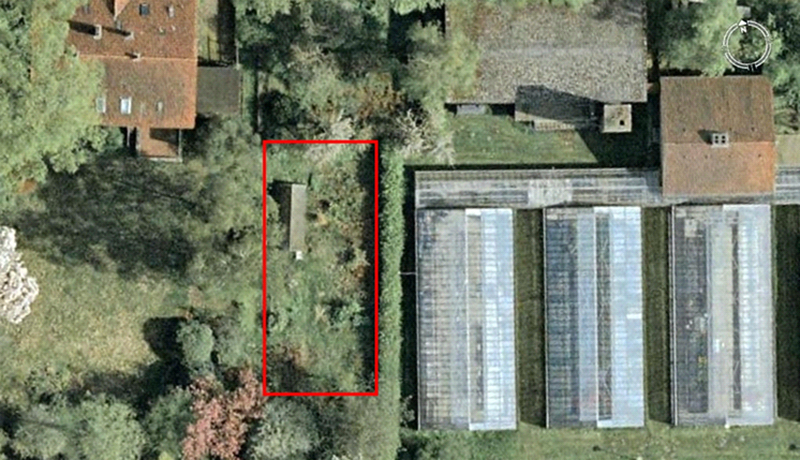
Satellite picture of in-ground test field (red rectangle) in Herrenhausen, Hannover, Germany (Google 2011), and surrounding
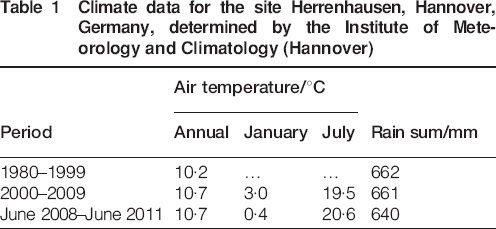
Climate data for the site Herrenhausen, Hannover, Germany, determined by the Institute of Meteorology and Climatology (Hannover)
An area of 21·8×11·2 m2 was allocated to in-ground field tests and this was divided into segments according to the scheme given in Figs. 2 and 3. The requirements of EN 252 (CEN 1989) for testing wood preservatives in ground contact served as basis for the layout. In total 1818 test positions with a minimum distance of 30 cm between each were arranged in 18 rows separated by 60 cm to allow for grass cutting and inspection. Before starting long term durability testing at this site, the decay activity of the test field soil was examined within this study to assure an adequate interpretation of future test results.
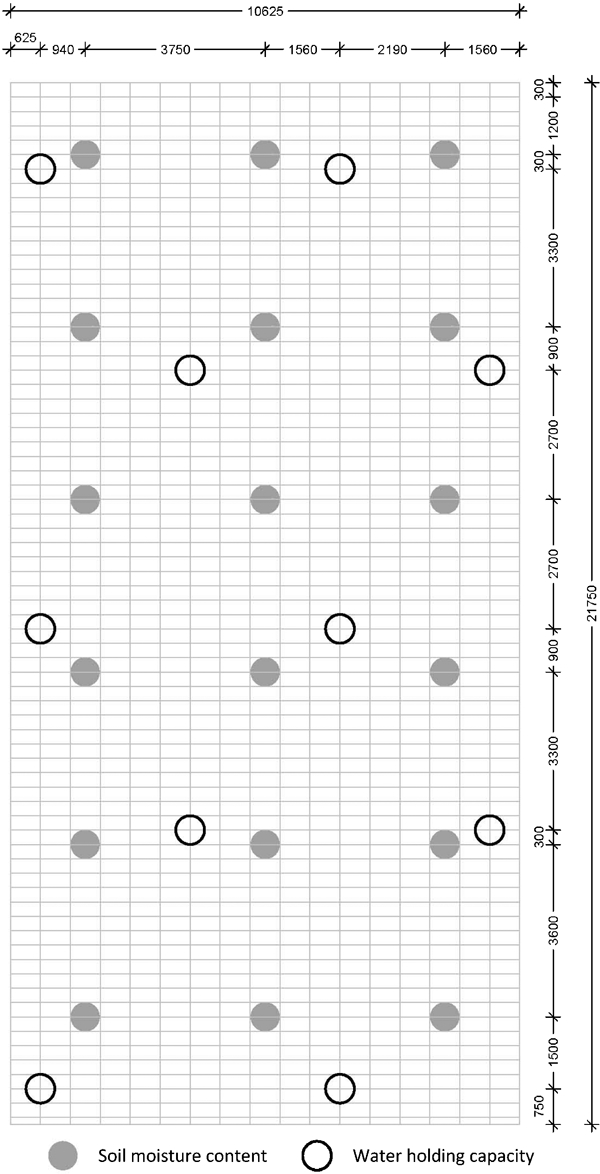
Position plan of ground contact test field with segmentation into test positions and location of sampling positions for soil analyses (all dimensions in mm)
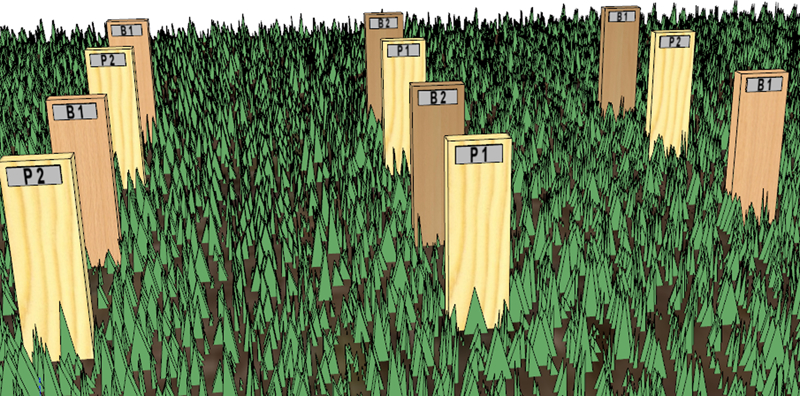
Position of specimens: P1, Scots pine sapwood exposed in the first year; P2, Scots pine sapwood exposed in the second year; B1, beech exposed in the first year; B2, Beech exposed in the second year
Test field: Soil analyses
Determination of water holding capacity
The initial water holding capacity of the field soil was determined according to ISO 11268-2 (ISO 2000). Soil samples were taken at 10 measuring points on the field at 0–5 cm and 20–25 cm depth (Fig. 2). The soil samples were air dried and sieved (2 mm mesh). Afterwards the soil was inserted into PE cylinders of 4 cm diameter. The bottoms of the cylinders were covered with a fine polymer grid and filter paper (MN 640W, 70 mm). All cylinders were placed in a vat for 12 h, which was filled with water to a height 1 cm above the soil filling height of 7 cm. After water soaking of the soil the cylinders were placed on a water saturated sand bath for 2 h to allow unbound water to drain. The soil samples were then weighed wet and after oven drying at 105°C and the water holding capacity of the soil calculated according to equation (1).
Calculation of water holding capacity (WHC, %)

Determination of soil moisture content
The soil moisture content was determined initially and at monthly intervals from March 2009 and for the remaining exposure period at different measuring points on the field (Fig. 2). The soil substrate was taken at 0–5 cm and 20–25 cm depths with a cone penetrometer. The soil samples were weighed before and after oven drying at 105°C and the moisture content was determined according to equation (2).
Calculation of soil moisture content h (%)
Determination of pH value and analyses of carbon, nitrogen and sulphur content
Subsamples of soil from the WHC tests were used to determine soil pH and the content of carbon, nitrogen and sulphur. For determining pH, 10 g of the sieved soil substrate were added to 0·01 mol CaCl2 and deionised water respectively. After 2 h, the pH was determined with a pH meter. Analyses of carbon, nitrogen and sulphur were conducted at the Institute of Soil Science, Hannover, using an elemental analyser (Vario EL). Hereby, the soil samples were heated at 1150°C and based on the exhaust gases the content of carbon, nitrogen and sulphur was determined.
Wood specimens
For initial decay tests 500×50×25 mm specimens were used for the in-ground field trials according to EN 252 (CEN 1989). Specimens were cut from European beech (Fagus sylvatica L.) and Scots pine sapwood (Pinus sylvestris L.), which are considered to be ‘non-durable’ according to EN 350-2 (CEN 1994). The specimens were consistent in growth rate and matched to avoid substrate differences. A first set of specimens (×171 beech, ×162 pine) were exposed immediately after completion of the test field in June 2008. To further examine a potential positive effect of accumulated biomass in the ground on the decay intensity, a second set of specimens (×171 beech, ×162 pine) was exposed 1 year later in June 2009. The test rows were filled alternately with pine and beech specimens; the second set of specimens was set in the gaps between the first set of specimens. Thus, a uniform grid pattern was obtained, where both wood species were distributed almost homogenously across the total field as can be seen from Fig. 2.
Exposure and decay assessment
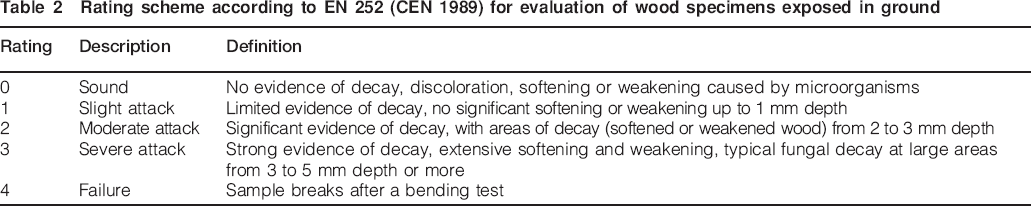
According to EN 252 (CEN 1989) the specimens were buried in the ground to half of their length and evaluated with respect to decay four times a year using the rating scheme offset out in EN 252 (CEN 1989), i.e. 0 = no attack, 1 = slight attack, 2 = moderate attack, 3 = severe attack and 4 = failure. Therefore, the specimens were removed from the ground and depth and distribution of decay were assessed with the help of a so called ‘pick-test’ using a sharp pointed knife. In cases where severe decay was present, a manual impact bending test was applied to the specimens. The rating scheme is illustrated in Table 2. In addition, the specimens were visually inspected for the presence of brown rot, white rot, soft rot and wood destroying insects. Furthermore, samples were taken from specimens for microscopic diagnosis according to CEN/TS 15083-2 (CEN 2005) to determine the type of decay if necessary.
Rating scheme according to EN 252 (CEN 1989) for evaluation of wood specimens exposed in ground
The results of the decay ratings were used to determine the intensity of decay in terms of decay rate (decay velocity) according to equation (3). To assess the decay intensity distribution within the field independently from the wood species the relative decay rate was also determined (equations (4) and (5)). Therefore, the decay rate of a single specimen was related to the mean of all specimens of the same wood species and set exposed at the same time. Thus, this relative value can be between 0 and ∞.
Calculation of decay rate v (per year)

Calculation of relative decay rate vr

Calculation of mean decay rate vmean (per year)

Results and discussion
Decay intensity
Decay proceeded rapidly for both wood species, but was faster in beech, which failed completely after 1·5 and 1·75 years respectively (Fig. 4). The pine sapwood specimens survived one more year, this correlates with findings from laboratory terrestrial microcosm tests as reported by Mieß (1997) and van Acker et al. (1999). However, the decay of the stakes planted at the beginning of the second year was not consistently faster or slower than the decay of the stakes planted at the beginning of the first year, and so it appears that the additional biomass added to the soil when the site was established did not have any exceptional short term effect (Fig. 5). While the decay rate of the second set of beech specimens was lower than those exposed in the first year, the decay rate of Scots pine sapwood specimens increased from the first to the second year. Furthermore, considerable variation in decay intensity was found within the test field for both species for specimens exposed for both time intervals.
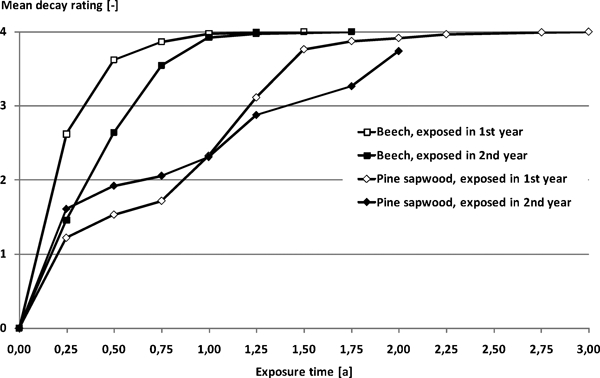
Mean decay rating according to EN 252 (CEN 1989) over exposure time for beech and Scots pine sapwood specimens exposed in June of the first and second years after setting up of the test field in Herrenhausen, Hannover
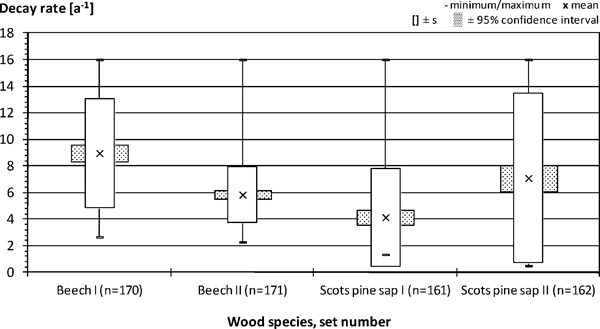
Decay rates for beech and Scots pine sapwood specimens exposed in June of the first and second years after setting up of the test field in Herrenhausen, Hannover
The decay intensity – expressed as relative decay rate vr – has been determined separately for both wood species. The corresponding mapping for selected exposure intervals is shown in Figs. 6 and 7. For Scots pine exposed in the first year, no clear spatial differentiation became visible, but several ‘hot spots’ with up to five times higher decay intensity compared to the average intensity have been identified. The general distribution of decay intensity remained over the whole exposure period for specimens exposed in the first year. However, a completely divergent decay intensity distribution was obtained for the second set of specimens, which led to a clear differentiation between the northern part (low intensity) and the southern part (high intensity; up to vr = 3) of the test field. No ‘hot spots’ emerged.
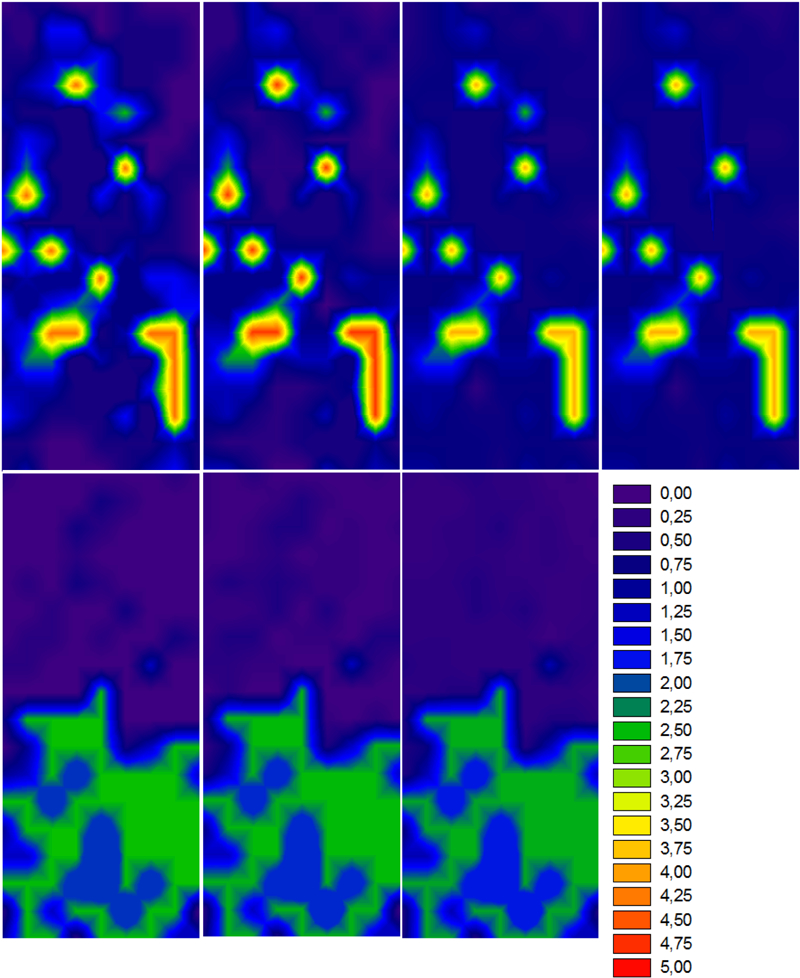
Intrasite variation of decay intensity expressed as relative decay rate vr for Scots pine sapwood on the test field in Herrenhausen, Hannover. Top: specimens exposed in the first year; from left to right: results after 0·5, 1·0, 2·0 and 3·0 years. Bottom: specimens exposed in the second year; from left to right: results after 0·5, 1·0 and 2·0 years
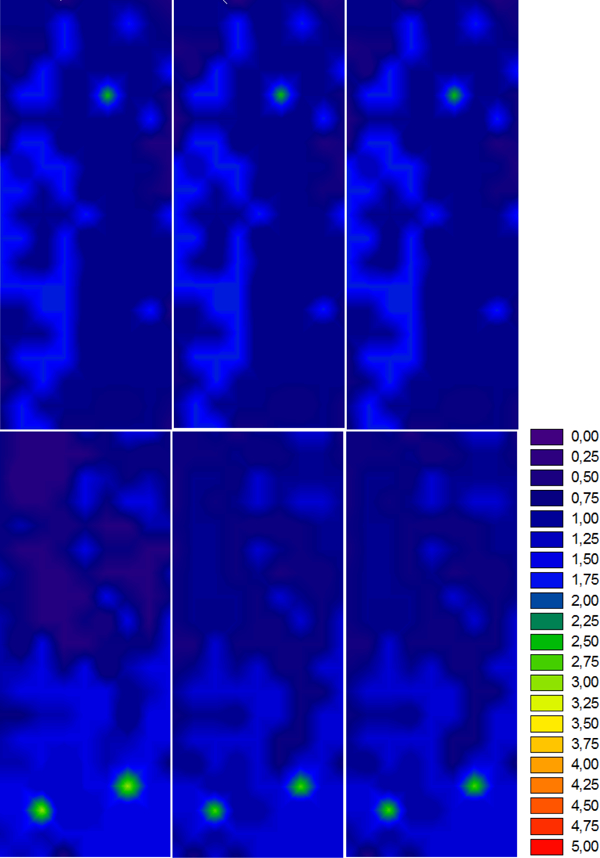
Intrasite variation of decay intensity expressed as relative decay rate vr for beech on the test field in Herrenhausen, Hannover. Top: specimens exposed in the first year; from left to right: results after 0·5, 1·0 and 1·5 years. Bottom: specimens exposed in the second year; from left to right: results after 0·5, 1·0 and 1·75 years
In contrast to pine sapwood, the rate of decay of beech was higher and a more homogenous distribution in decay intensity was observed (Fig. 7). However, while the first set of specimens revealed no clear distribution pattern at all, the decay intensity for the second set of beech specimens was higher in the southern part of the field as was observed for pine sapwood. Only two small spots (single specimens) caused by soft rot in the southern part of the field demonstrated far higher decay intensity.
Decay type distribution
The three main fungal decay types, brown, white and soft rot, were found on specimens of both wood species, but varied significantly in frequency and spatial distribution in the field (Fig. 8 and Table 3). Therefore, the different decay types present in each of the stakes were determined after failure or at the time of last assessment of the specimens respectively. In general, while decay of beech was dominated by soft rot, decay of pine sapwood was mainly caused by white rot. However, a significant number of samples showed different decay types in the same specimen. Thus, combinations of soft and white rot were frequently observed, but also brown rot with or without additional white and soft rot were found on both species. In addition, the brown rot Leucogyrophana spp. was detected on numerous pine specimens (as observed by Huckfeldt 2009a), often in conjunction with larvae and occasionally adult wood borers (Fig. 9).
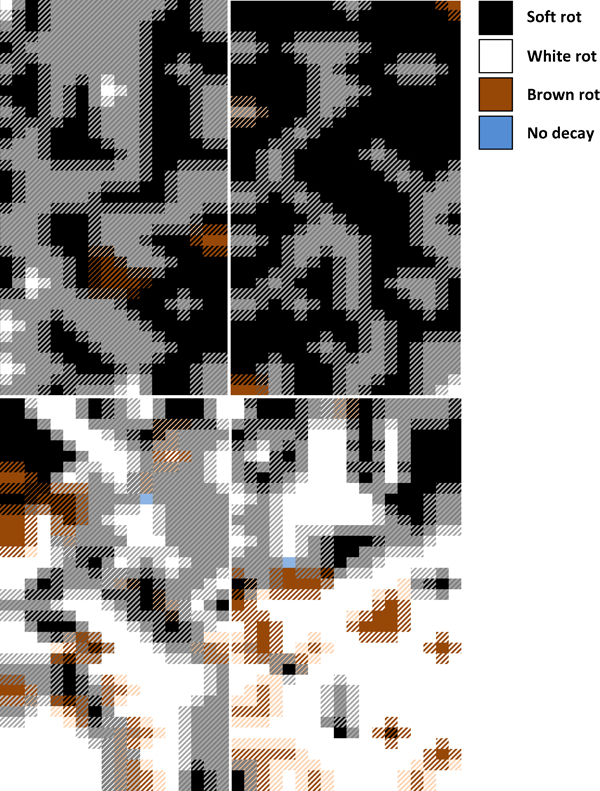
Intrasite variation of decay types in the test field in Herrenhausen, Hannover. Top: beech specimens after 1·5 years exposed in the first year (left) and after 1·75 years exposed in the second year (right). Bottom: pine sap after 3·0 years exposed in the first year (left) and after 2·0 years exposed in the second year (right). Hatching and mixed colors indicate combined presence of more than one decay type
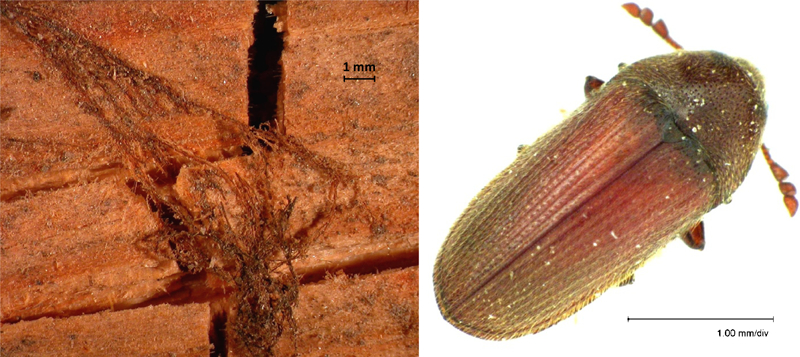
Decay organisms identified on the test field in Herrenhausen, Hannover Left: strands of brown rot causing Leucogyrophana spp. found on numerous pine sapwood specimens (photo: Huckfeldt 2009a). Right: wood boring Anobiidae
Frequency and corresponding decay rates for different decay types occurring on pine sap and beech wood specimens exposed in the first (1st set) and second years (2nd set): standard deviation in parentheses
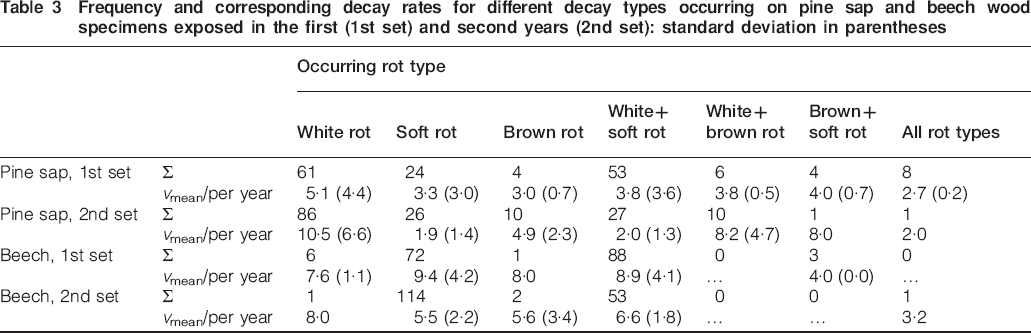
In general, no significant differences between the decay rates of different decay types were observed due to high variation of decay progress between specimens, spatial distribution of the different decay types (Fig. 8) and the combined occurrence of more than one decay type on the same specimen. Furthermore, it became evident that the wood species also had a significant effect on the decay intensity. While white rot on pine tended to result in faster decay, beech wood suffered a similar rate of decay from all decay types. The general ranking of decay velocity ‘brown rot>white rot>soft rot’, as previously reported (e.g. Savory and Carey 1979; Huckfeldt and Schmidt 2006; Augusta 2007; Huckfeldt 2009b), was not confirmed in this study. In contrast, white and soft rot had the potential to cause decay rates up to 10 rating steps per year.
A more detailed analysis of the decay intensity distribution with respect to the different decay types also indicated the predominant role of white rot on pine sapwood. The most pronounced hot spots were found for the first set of pine sapwood specimens (see Fig. 6). In total, 13 specimens showed decay rates of 16 rating steps per year, which corresponds to a relative decay rate of 3·88 (cf. red orange areas in Fig. 6), whereby 12 specimens suffered from white rot, partly associated with soft rot, and only one showed soft rot exclusively, none of them revealed brown rot. Second, the clear south–north differentiation of the field, which could be observed for the second set of pine and beech specimens (Figs. 6 and 7), was not evident through the distribution of decay types (Fig. 8).
Soil parameters
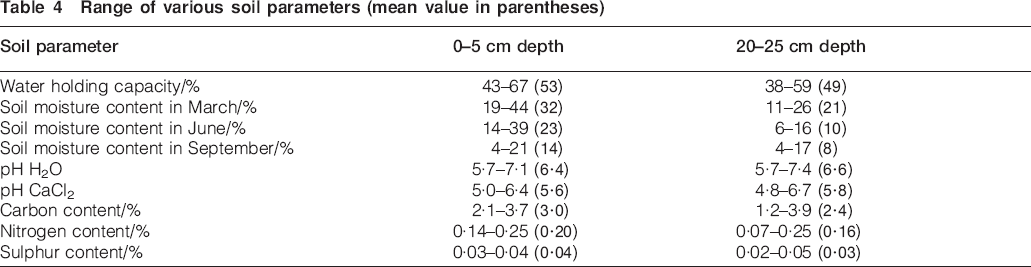
Most soil parameters, which were measured initially and during the test period, showed only marginal differences within the field and were therefore not useful to explain the observed differences in decay intensity (Table 4). Only the water holding capacity and the corresponding soil moisture content were found to be correlated with the decay intensity within the field. As shown in Fig. 10, WHC and moisture gradient were found to vary between the northern and the southern part of the field. In general, the moisture content was slightly higher in the layer close to the surface, where there are higher amounts of organic matter from previous use were available and the WHC was therefore also higher. Significant differences in pH and carbon, nitrogen and sulphur content were not found in samples from different locations across the site. Differences in decay intensity could therefore be attributed in part to moisture differences of the soil. In addition, the decay intensity variation is likely to depend on the in-ground microflora at certain locations in the field.
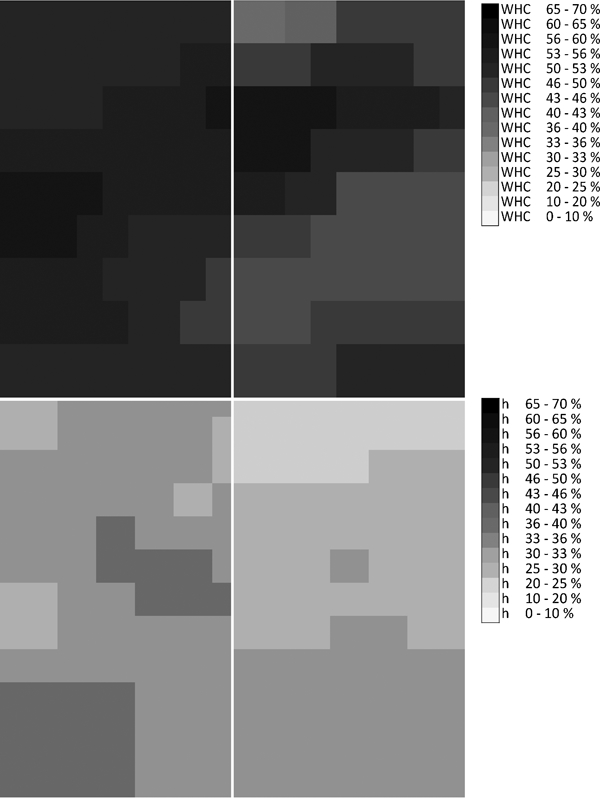
Intrasite variation of WHC and soil moisture content h on the test field in Herrenhausen, Hannover. Top: WHC in 0–5 cm depth (left) and 20–25 cm depth (right). Bottom: soil moisture content in June in 0–5 cm depth (left) and 20–25 cm depth (right)
Range of various soil parameters (mean value in parentheses)
Conclusions
Soft rot and white rot are the dominant decay types in the newly established in-ground test field in Herrenhausen, Hannover. Initial decay trials showed intrasite variability which should be considered when conducting in-ground tests. For wood durability testing, it is essential to expose wood to a broad range of decay organisms. In terms of fungal decay, this means to assure the presence of the three decay types – brown, white and soft rot. It is necessary to include several test sites with different dominating decay types. Most likely, one will not find all three decay types on the same test site showing equal inoculum potential.
As the assessment showed for the Herrenhausen site, it can furthermore easily happen that small areas with high decay intensity of a certain type can be included or excluded; therefore, randomised distribution of test specimens needs to be assured even on a relatively small site.
With rising soil moisture content, the speed at which decay progresses also increased. Furthermore, this study shows a time factor needs to be considered in case of newly cultivated test fields to account for different succession steps. The succession itself depends on various further factors, e.g. availability of nutrients, soil moisture regime, vegetation and maintenance measures. Periodic inspections of the field with respect to prevailing decay types and decay activity will be helpful for interpreting the test results.
Footnotes
Acknowledgements
The authors would like to express their special thanks to Professor Jürgen Böttcher and Dr Holger Ciglasch from the Institute of Soil Science, Hannover, for technical support with the soil analyses, as well as to all helping hands taking care of the field trials.