
Abstract
Addition of urea to a melamine modified urea formaldehyde resin in the surface and core layer reduces significantly the formaldehyde release of the particleboards bonded therewith. Under the used boundary conditions (long press time) urea addition seems to have no noticeable negative impact on the physical–mechanical properties of the boards. The reduction of formaldehyde release due to urea addition as a scavenger can be followed by measuring the emission in the chamber according to EN 717-1, the perforator method according to EN 120 and the flask method as described in EN 717-3. The results reveal that under the used conditions a good correlation exists between the emission in the chamber and the corrected perforator values (R2 = 0·865), as well as between the chamber value and the formaldehyde emission measured by the 3h-flask method (R2 = 0·792) according to EN 717-3, a slightly better correlation was found between the measured flask values after 24 h and the emission in the chamber (R2 = 0·869). The correlations seem to hold in the emission range between 0·06 and 0·016 ppm.
Keywords
Introduction
Since many decades the formaldehyde release from wood-based-products like particle- and fibreboards generated a great deal of concern. As a consequence research work started on this issue (Wittmann 1962) aiming to develop methods for assessing the liberation of formaldehyde from wood-based panels, to study the different endogenic and exogenic factors influencing the emanation of formaldehyde and to find suitable techniques for reduction of formaldehyde release. There is an untold number of publications over the course of the last decades covering this subject (Myers and Koutsky 1987; Boehme 2000; Petersen et al. 1974). At the beginning of the eighties regulations have been enacted in countries like Germany and the USA to classify particleboards designed for use in buildings (e.g. ETB-guideline, Committee on Harmonized Prescriptions for Construction 1980/1981 in Germany). This guideline has been revised in Germany and substituted 1994 by the guideline of the Institute of Bautechnik (DIBt-100). Emission from particle- and fibreboards meeting the DIBt-100 has to be ≤0·1 ppm, as measured according to the chamber method technique, described in EN 717-1. The California Air Resources Board (CARB) adapted a new regulation to reduce formaldehyde emission from wood-based panels in steps (effective in 2009 and 2011). The CARB II limit values effective from 1st January 2011 require that the emission from particleboards are below or equal to 0·09 ppm according to ASTM E 1333, for fibreboards of more than 8 mm thickness the limit value is 0·11 ppm. In France a much hard-line view is taken towards formaldehyde aiming to classify it as 1A (carcinogenic)
As emission measurements according to EN 717-1 are expensive and time consuming different surrogate methods have been developed and standardised in Europe correlating the measured formaldehyde release in the laboratory with the emission values measured in the chamber. The most important derived method in Europe is the perforator method (EN 120). The perforator method is a dynamic method to measure the extractable formaldehyde content of the boards; the accuracy of the method depends among others on the moisture content of the boards (Roffael and Johnsson 2012). The results of the perforator method correlate quite well with the chamber method in the region near or above 0·1 ppm (Sundin et al. 1987). However, recently doubt has been cast on the reliability of the perforator method to differentiate among boards in the emission level well below E1 (Meyer and Schwab 2011; Roffael and Johnsson 2012). Nowadays, the credibility of the perforator method as a tool for characterisation of boards with very low emission and wide range of density and thickness is regarded to be threadbare. The flask method (EN 717-3) has also attracted attention in the past due to its simplicity and its proven capability to detect subtle differences among boards (Roffael 1978).
In 1999, the World Health Organisation has issued a guideline with 0·1 mg m–3 (0·08 ppm) formaldehyde as a limit (Indoor formaldehyde concentration). The debate on the health issues associated with formaldehyde found its climax in 2004 as the International Research Agency on Cancer declared formaldehyde as a cancerogenic chemical for humans. This declaration has been taken seriously and marked a major turning point in the controversial discussion on the health effects of formaldehyde, which is still ongoing and nobody knows definitely what the outcome will be. In the wake of International Research Agency on Cancer-declaration the industry of wood-based products has been targeted by a successive wave of regulations intending to reduce the formaldehyde release of resin bonded boards to the level of untreated wood or very near to it. There is also a proposal from the French Environmental Health Authority to classify formaldehyde as a category 1A carcinogen (Botting 2012).
To meet the tight regulations issued in the different countries like the requirements of F**** given in JIS A 5908 in Japan or the requirements of CARB II in the USA (93120 California Code of Regulations) active research work has focused on practical methods to mitigate formaldehyde release. One of the techniques adopted in the industry is to use different formaldehyde reacting chemicals (Park et al. 2011; Salem et al. 2012), the so called formaldehyde scavengers. One of the well-known effective scavengers used in the industry is urea. Many publications cover the use of urea as a formaldehyde catcher (Weinkoetz 2012), it is also included in the so-called scavenger resins (Sauter 1998). Other formaldehyde scavengers are also well-known with high chemical reactivity towards formaldehyde (Francis 2010).
Objective of the work
The research work intends to find out whether the influence of adding urea to a melamine modified urea formaldehyde resin with very low molar ratio (F/NH2) can be assessed using the common surrogate methods, perforator method (EN 120) and flask method (EN 717-3). Furthermore, it was the objective of the work to find out how both laboratory methods correlate with the measurement of the formaldehyde emission at steady state in the chamber according to EN 717-1.
Experimental work
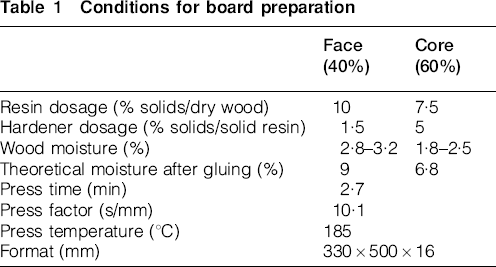
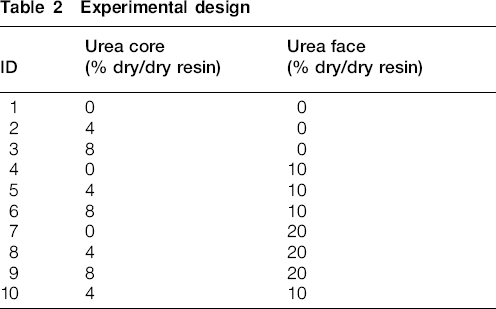
Particleboards (16 mm) with a target density of 0·65 g cm–3 were prepared using a melamine modified, low molar ratio (F/NH2 ∼1∶0·5) urea formaldehyde resin (MUF-resin). The conditions of board preparation are presented in Table 1. Urea, as a fine powder, was added to the resin in solid form as a scavenger either in the core layer or in the surface layer or in both of them, as shown in Table 2, to study the responsiveness of the emission to adding the scavenger in the surface and core layer. As a hardener ammonium nitrate was used in amounts mentioned in Table 1. The boards were conditioned at 20°C and 50% rel. humidity prior to cutting and testing. The boards were tested for bulk density (EN 323), thickness swelling (EN 317) and internal bond strength (EN 319). The formaldehyde emission from the boards was evaluated according to the chamber method (EN 717-1) as a reference method. Moreover, as surrogate methods both, the flask method (EN 717-3 with 3 and 24 h reaction time) and the perforator method (EN 120) were used to assess the formaldehyde release from the boards.
Conditions for board preparation
Experimental design
Results and discussion
The results of testing the physical–mechanical properties [internal bond strength (IB), thickness swelling (TSW) and water absorption (ABS) after 24 h soaking of the boards as well as their formaldehyde emission according to the chamber method (EN 717-1)] are compiled in Table 3. Moreover, the table contains the measured and corrected perforator values according to the current EN 120 as well as the flask values after 3 h reaction time (EN 717-3). Additionally, in the table the flask values after 24 h are recorded; previously published work by Sundin and Roffael (1991) and Roffael (1978) used the 24 h value to differentiate among different boards with subtle differences in their formaldehyde release. Derman and Roffael (1989) found a strong correlation between the 24 h-flask value and the perforator value in the high emission range in case of MDF.
Summary of results*
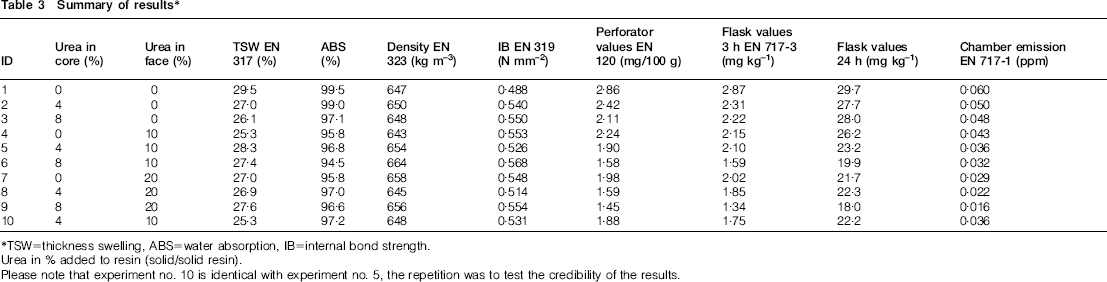
*TSW = thickness swelling, ABS = water absorption, IB = internal bond strength.
Urea in % added to resin (solid/solid resin).
Please note that experiment no. 10 is identical with experiment no. 5, the repetition was to test the credibility of the results.
As the results in Table 3 reveal, addition of urea to the slightly melamine modified resin (MUF-resin) under the used boundary conditions has no significant impact whatsoever on the internal bond strength, which has been measured on 16 pieces for each set of boards with an average standard deviation of 0·068 N mm–2 and a standard deviation of the average values between the sets N1 to N10 of 0·023 N mm–2. This result is likely due to the modification of the UF-resin with melamine on the one side and probably also due to the relatively long press time factor of 10·1 s mm–1 on the other side. Industrial trials using notably shorter press cycles could lead to somewhat different results. Therefore, there is still dire need to investigate the influence of press time and resin modification on the responsiveness of the internal bond strength and thickness swelling to the urea addition. This, however, was not the objective of the present research work. The results of measuring the thickness swelling show also no clear trend related to the influence of adding urea to the resin.
As far as the formaldehyde emission from the boards in the chamber (EN 717-1) is concerned, the results clearly indicate a tremendous impact of urea addition. The emission of formaldehyde decreases from 0·06 ppm for the reference boards made with no addition of urea to 0·016 ppm after addition of urea in an amount of 20% (based on solid resin) in the surface layer and 8% (based on solid resin) in the core layer. This means that the emission can be decreased to more than 60% by addition of urea to the resin. The results of measuring the emission in the chamber are plotted in Fig. 1 against the measured and corrected perforator values (EN 120) showing a correlation factor (R2 = 0·865), which means that using the same furnish and the same resin the influence of urea can still be detected by measuring the perforator values instead of measuring emission in the chamber according to EN 717-1.
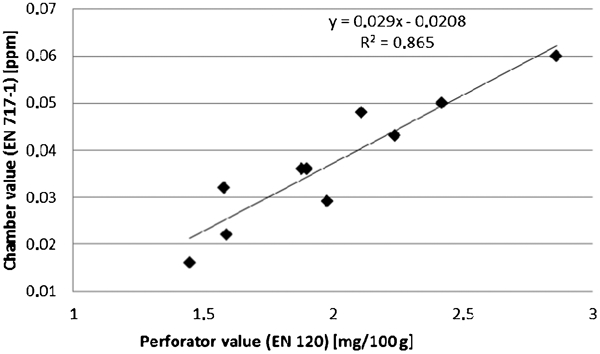
Chamber value = f(Perforator value)
Also the results of measuring the formaldehyde release of the boards using the flask method (EN 717-3) after 3 h correlate quite well (R2 = 792) with the emission of the boards using the chamber method (according to EN 717-1); slightly better correlation with the emission in the chamber has been found between the flask values after a reaction period of 24 h (R2 = 869), as can be seen from Figs. 2 and 3.
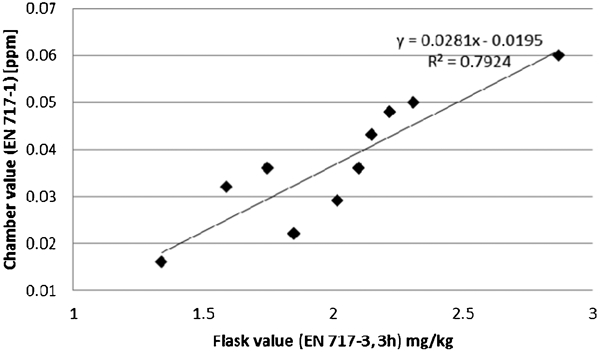
Chamber value = f(Flask value, 3 h)
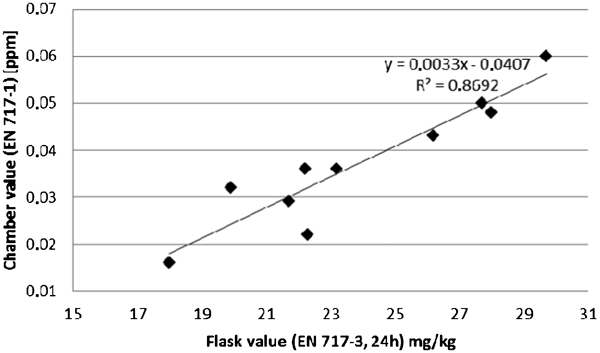
Chamber value = f(Flask value, 24 h)
This may be due to the fact that the results obtained by extending the reaction time to 24 h using the flask method are nearer to the steady state emission. In summary, it can be concluded that the perforator method as well as the flask method are highly responsive to changes in the emission induced by urea addition to a well-defined resin system in a manner correlating with the behaviour of the boards in the chamber. Moreover, the results show clearly that the 24 h flask value differentiate much more clearly between the boards compared to the 3 h values as the absolute values of small differences measured after 3 h increase after 24 h.
Moreover, the results show that a high correlation coefficient between the perforator and the flask value after 3 h (Fig. 4) and after 24 h (Fig. 5) exists. The correlation coefficients found in this study are of the same order of magnitude as previously found by Flentge and Marutzky (1988) as well as by Sundin and Roffael (1991). The results confirm, in general, also the previous results published by Sundin (1988), who found a high correlation coefficient between the rapid emission method value and the perforator value. The rapid emission method used by Sundin (1988) is based on measurements using the flask method (3 h reaction time at 40°C as described in EN 717-3) using a photometer which allows to read the formaldehyde emission directly.
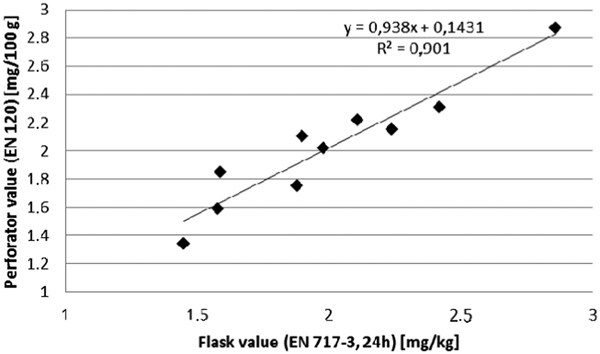
Perforator value = f(Flask value, 3 h)
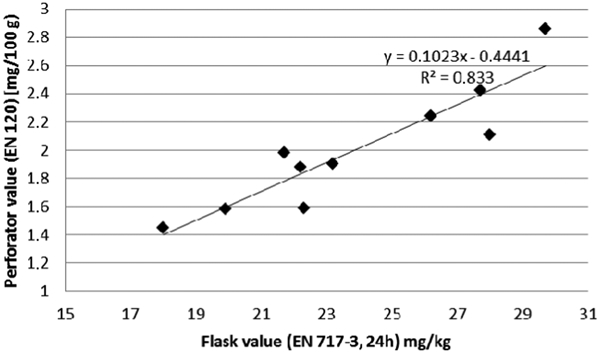
Perforator value = f(Flask value, 24 h)
Based on the experimental design, the possibility to build mathematical models that describes emission based on the urea dosages was investigated.
The results from least squares regression models with urea in core and face as the variables and the emission methods respectively as the responses are summarised in Table 4. The correlation coefficients (R2, referring to fit of measured versus predicted emission from each method) indicate the fit of strong models for the four responses. The model for EN 717-1 chamber (Fig. 6) shows the best fit among the four methods investigated. In this case 99% of the variation in emission was explained by the variation in urea dosage, indicating a low experimental error. In Table 4 the coefficients, C1 and C2 in equation (1), from least squares fit of the four emission measurement methods are presented

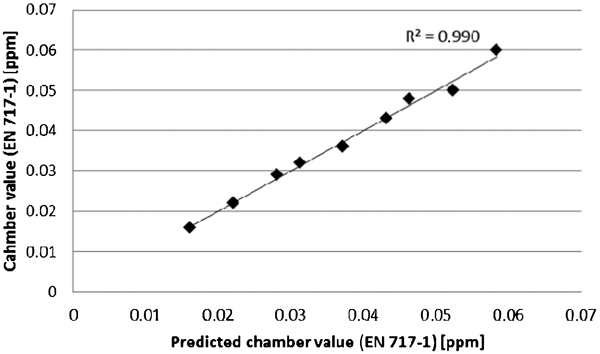
Chamber value = f(Predicted chamber value)
Coefficients for urea dosage in core and face, and correlation coefficients from least squares fit of the four emission measurements methods respectively
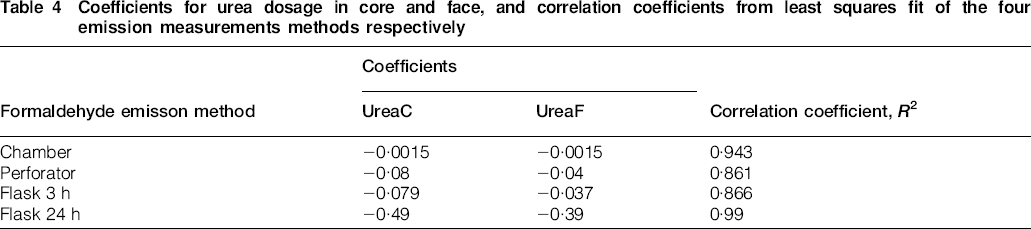
These phenomenological differences between the methods will influence any attempt to improve the correlation between them. As a consequence, perfect fit of the correlation between for example emission in the chamber and perforator data can hardly be reached, as the perforator method measures the extractable formaldehyde content of the boards under definite boundary conditions and the perforator value depends on several factors with mutual dependence (Roffael and Johnsson 2012). On the other hand, the correlation between chamber and 24 h flask methods has the potential of increased correlation coefficient by for example making the analyses in an increased number of replicates. The fact that perforator and flask 3 h methods are rapid and the test pieces have a high fraction of open board edges might be of relevance. The flask (24 h) and chamber methods, on the other hand, are slower and the test pieces does have the possibility to reach equilibrium, where the impact from the more compact face layer will possibly show a greater impact on the detected formaldehyde emission.
Conclusions
The influence of urea as a scavenger was assessed using the chamber method (EN 717-1), the perforator method (EN 120) and the flask method (EN 717-3) after incubation time of 3 and 24 h. The results reveal that under the boundary conditions used a good correlation was found between the measured emission using the chamber method and the perforator values (R2 = 0·865) as well as between the emission and the flask values after 3 h (R2 = 0·792). A little bit better correlation was found between the emission in the chamber and the flask values after 24 h (R2 = 0·869).