





Abstract
In this paper, a new energy-based pushover procedure is presented in order to achieve an approximate estimation of structural performance under strong earthquakes. The steps of the proposed methodology are quite similar to those of the well-known displacement modification method. However, the determination of the characteristics of the equivalent single-degree-of-freedom (E-SDOF) system is based on a different rational concept. Its main idea is to determine the E-SDOF system by equating the external work of the lateral loads acting on the multi-degree-of-freedom (MDOF) system under consideration to the strain energy of the E-SDOF system. After a brief outline of the theoretical background, a representative numerical example is given. Finally, the accuracy of the proposed method is evaluated by an extensive parametric study which shows that, in general, it provides better results compared to those produced by other similar procedures.
Introduction
In the last decades, many research efforts have focused on developing simple procedures for the approximate estimation of the inelastic performance of buildings under seismic excitation, in order to avoid the significant computational cost and the various inherent disadvantages of an accurate inelastic dynamic analysis. As a result of these efforts, the idea of pushover analysis has been born. Recently, a series of more or less similar inelastic static pushover procedures have been developed, some of which have been already adopted by several seismic codes and prestandards (ASCE 41-06, ATC-40, EC-8, etc.). All of these procedures are based on the assumption that the inelastic response of a structure can be related to the response of an equivalent single-degree-of-freedom (E-SDOF) system. As a first step, the structure is subjected to incremental lateral forces with constant distribution along the height and the base shear versus roof displacement diagram is plotted (capacity or pushover curve). The capacity curve is then idealized to a bilinear curve from which the fundamental properties of an E-SDOF system are determined. On the basis of several additional simplifying assumptions, the peak roof displacement of the structure (target displacement) is correlated to the peak response of the E-SDOF system which is determined with the aid of a selected design or response spectrum. All other response quantities are determined by conducting pushover analysis up to the already calculated target displacement.
Static pushover analysis, or nonlinear static procedure (NSP) as it is referred in seismic codes, seems to be a useful tool for engineering practice. Nevertheless, it has already been stressed by many researchers (e.g., Krawinkler and Seneviratna 1998) that this procedure involves many shortcomings and can provide reasonable results only for low- and medium-rise planar systems. This is mainly due to the fact that the determination of the structure's response is based on the assumption that the dynamic behavior depends only on a single elastic vibration mode. In addition, this elastic mode is supposed to remain constant despite the successive formation of plastic hinges during the seismic excitation. Also, the choice of roof displacement instead of any other displacement is arbitrary and it is doubtful whether the capacity curve is the most meaningful index of the nonlinear response of a structure, especially for irregular and spatial systems. Thus, many researchers have proposed modified pushover procedures to overcome these shortcomings (e.g., Chopra and Goel 2001, Hernadez-Montes et al. 2004, Parducci et al. 2006, Oliveto et al. 2001). Some of them (Hernadez-Montes et al. 2004, Parducci et al. 2006, Oliveto et al. 2001) are based on the energy equivalence between the multi-degree-of-freedom (MDOF) and the E-SDOF systems (energy-based procedures). According to the energy-based procedures, the strain energy of the structure or, equivalently, the work done by the external loads is considered to be the most representative index of its nonlinear response.
In order to account for the higher modes contribution to the nonlinear dynamic response of structures, Chopra and Goel (2001) introduced modal pushover analysis (MPA). MPA comprises a series of static pushover analyses, one for each of the vibration modes taken into account. However, the capacity curves of higher modes often present disproportionate increases and even outright reversals of roof displacements. To avoid this trouble, Hernadez-Montes et al. (2004) suggested an energy-based formulation of pushover analysis which uses a target-displacement derived from the work done by the lateral loads to establish the capacity curve, instead of using the roof displacement. In each step of the pushover procedure, the work done by lateral loads associated with each mode is computed using an incremental formulation. The corresponding increment in the energy-based displacement is calculated by dividing the increment of work at each step by the base shear at that step. The incremental displacements are accumulated to obtain the energy-based displacement of the E-SDOF system. Thus, a modified capacity curve is plotted for each mode, which is used in place of the conventional pushover curve. These modified curves resemble traditional first mode pushover curves and correct the anomalies observed in higher mode curves.
Parducci et al. (2006) proposed the determination of an equivalent energy-based displacement of the E-SDOF system. This displacement does not correspond to any actual point of the structural model, but it is a virtual value equalizing the work done by the lateral loads to the strain energy of the E-SDOF system. Then, a strain energy versus equivalent displacement diagram is plotted and in combination with a pseudo-energy response spectrum, a performance point of the structure is estimated.
Earlier, Oliveto et al. (2001) determined a displacement parameter based on power equivalence (which in finite terms translates into energy equivalence) between MDOF and E-SDOF systems. The properties of the E-SDOF system are then calculated as function of this energy-based displacement. Recently, this procedure was extended to include Modal Pushover Analysis (Biondi and Oliveto 2008).
The objective of this paper is the presentation and preliminary evaluation of a new energy-based NSP for the approximate estimation of the seismic response of structures. This procedure uses the strain energy which is considered as a more meaningful index of the structural response than the base shear. This is due to the fact that the strain energy depends on the values of all forces acting to the structure as well as on the values of the displacements of all the system's degrees of freedom. The steps of the proposed methodology are quite similar to those of the well-known displacement modification method (ASCE 41-06, EC-8). However, the determination of the characteristics of the E-SDOF system is based on a different concept. Specifically, the definition of the E-SDOF system is based on the equalization of the external work of the lateral loads acting on the MDOF system under consideration to the strain energy of the E-SDOF system. In contrast to other energy-based procedures, the energy equivalence is used to derive a modified resisting force of the E-SDOF system, instead of an energy-based displacement. Thus, a modified capacity curve is plotted. This curve is consistent with the strain energy versus displacement diagram of the E-SDOF system and it is used for the establishment of the E-SDOF system. As a first step, the procedure is formulated in a manner that takes into account only the predominant vibration mode and in its current form it can be rigorously applied to low- and medium-rise planar systems. Firstly, the theoretical background and the assumptions of the proposed methodology are presented and briefly discussed. Taking into account the basic assumptions and applying well-known principles of structural dynamics, some fundamental conclusions are derived and, on that basis, an alternative, energy-equivalent SDOF system is established, which can be used for the estimation of the target displacement. Secondly, both steps needed for the implementation of the proposed methodology along with the necessary equations are systematically presented. In order to facilitate comprehension, a clarifying numerical example is given. Finally, the accuracy of the proposed methodology is evaluated by an extensive parametric study. The whole investigation shows that, in general, it gives better results compared to those produced by other similar procedures. The paper closes with comments on results and conclusions.
Inelastic Response of Mdof System
Decomposition to Responses of Sdof Systems
The response of a MDOF system with N degrees of freedom to an earthquake ground motion üg(t) is governed by the following equation:

In the inelastic range of behavior some basic assumptions have to be made, keeping always in mind that our main intention and aim is the development of an approximate, simplified nonlinear static procedure. A major assumption is that the response of a MDOF system can be expressed as superposition of the responses of appropriate SDOF systems just like in the linear range. Of course, such an assumption violates the very logic of nonlinearity, as the superposition principle does not apply in nonlinear systems. However, it must be thought as a fundamental postulate, which constitutes the basis on which many simplified pushover procedures are built. Thus, each SDOF system corresponds to a vibration “mode” i with “modal” vector





External Work of “Modal” Forces F si
A MDOF system with N degrees of freedom which is subjected in the differential time interval dt to an excitation ü
g
has the differential displacements:
Modal displacements u
ji
and modal forces F
ji
for mode i.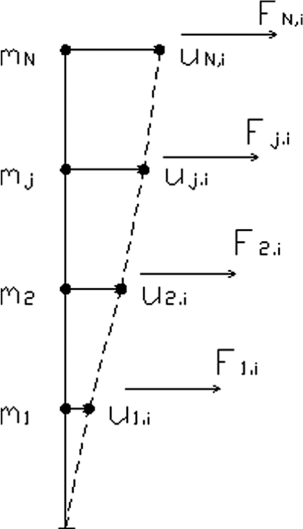



Characteristics of Inelastic Sdof Systems
An inelastic SDOF system is usually described by a bilinear force-displacement diagram V-D (Figure 2a), from which its most important characteristics can be derived. For the implementation of NSPs the characteristics of interest are the natural period T and the yield strength reduction factor R. The calculation of T and R is carried out successively as follows:
(a) Force-displacement V-D curve, and (b) strain energy-displacement E-D curve.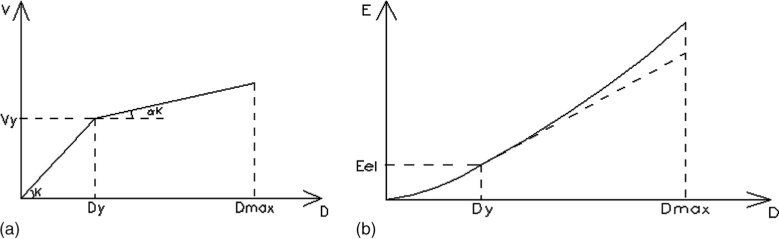



The Proposed Methodology
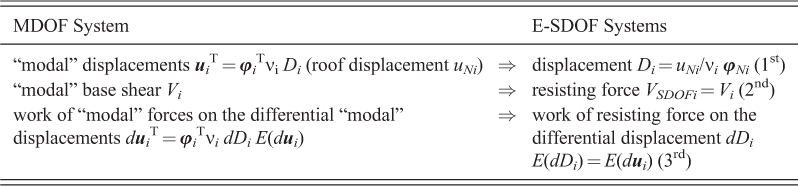
From the analysis presented above, some basic equations that correlate the properties of the “modal” E-SDOF systems to the properties of the MDOF system are derived and summarized in Table 1. However, these equations are derived on the basis of the aforementioned assumptions and cannot be true all together when a pushover analysis is conducted. Thus, Modal Pushover Analysis (Chopra and Goel 2001) leaves out the third equation and uses the two others to establish the “modal” E-SDOF systems. The conventional procedures adopted by codes follow a similar approach with some additional assumptions. In particular, they take into account only the predominant vibration mode and they permit modifications to the corresponding mode shape vector. The existing energy-based single or multimodal procedures keep the last two equations and determine the E-SDOF systems’ displacements from the energy equivalence between them and the MDOF system. Nevertheless, it must be stated that these two equations are derived as a consequence of the validity of the first. In fact, the modification of roof displacement violates the main assumptions the entire procedure is based. On the contrary, the proposed method keeps the first and the third equations and uses the energy equivalence to determine a modified resisting force of the E-SDOF system. This concept is more consistent with the aforementioned fundamental assumptions. As a first step, the proposed method is formulated in a manner that takes into account only the predominant vibration mode in the excitation direction, so in its current form it is suitable for structural systems with small contribution of higher modes, such as low- and medium-rise planar frames.
Definition of the E-SDOF systems
The steps needed for the implementation of the proposed methodology are as follows:
Step 1. Create the structural model.
Step 2. Apply to the model a set of lateral incremental forces proportional to the vector 
Step 3. Divide the abscissas of the E1-uN1 diagram by the quantity ν1ϕ N 1 = uN1/D1 and determine the E1-D1 diagram of the E-SDOF system (Figure 3b). By utilizing a graphic procedure, the E1-D1 diagram could be idealized to a smoothed diagram without curvature discontinuities (like the E-D diagram of Figure 2b) and the characteristics of the E-SDOF system could be derived directly from Equations 11 and 12. However, because of the complexity of the E1-D1 diagram this approach is difficult to apply, so follow step 4.
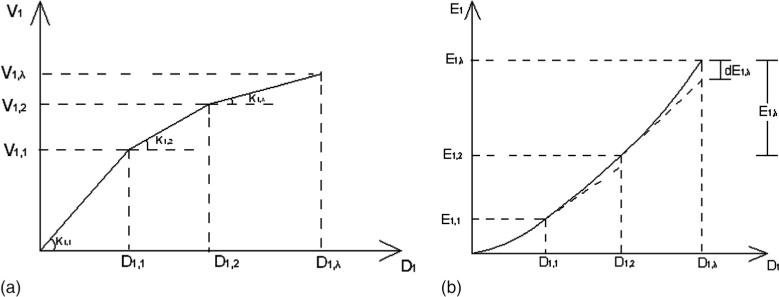
(a) Force-displacement V1-D1 curve, and (b) strain energy-displacement E1-D1 curve.
Step 4. Calculate the work E1,λ (Figure 3b) of the external forces in each of λ discrete intervals between the successive formation of plastic hinges. dE1,λ, as part of E1,λ (Equation 14), is considered to derive from Equation 15.



Step 5. Idealize V1-D1 to a bilinear curve using one of the well known graphic procedures (e.g., ASCE 41-06, Section 3.3.3.2.5) and calculate the period T and the yield strength reduction factor R of the E-SDOF system corresponding to mode 1 from Equation 10. It is stated that the mass m is equal to the effective modal mass M1* of mode 1 (Equation 6).
Step 6. Calculate the target displacement and other response quantities of interest (drifts, plastic rotations, etc.) of mode 1, using one of the well known procedures of displacement modification (e.g., ASCE 41-06, Section 3.3.3.3.2 / FEMA 440, Section 10.4). When the procedure is applied for research purposes using recorded earthquake ground motions, it is recommended to estimate the inelastic displacement of the E-SDOF system by means of nonlinear dynamic analysis, instead of using the relevant coefficients (e.g., C1 in ASCE 41-06 and FEMA 440). This is due to the fact that the coefficient values given by codes are based on statistical processing of data with excessive deviation and, therefore, great inaccuracies could result (Manoukas et al. 2006).
Step 7. Repeat Steps 2 through 6 applying the incremental forces in the opposite direction. It is obvious that this step is necessary to apply only for asymmetric structures.
Numerical Example
In order to explain how the proposed methodology (PM) should be applied, an analytical example is illustrated. In particular, PM is applied to a three-story R/C regular planar frame (Figure 4) for the 1940 El Centro NS ground motion multiplied by 0.5, 1.0 and 1.5 and the results are compared with those obtained by nonlinear response history analysis (NL-RHA).
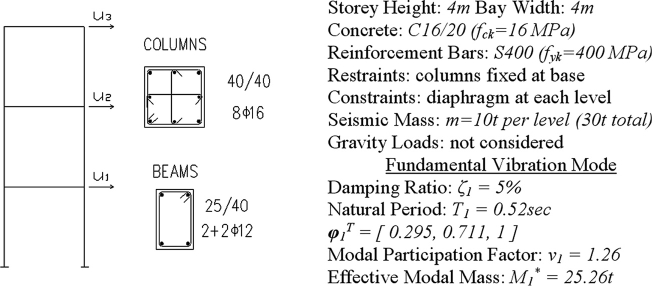
Three-story R/C planar frame.
Step 1. Structural Model Creation
Both PM and NL-RHA performed using the program SAP 2000 v10.0.7. The modeling of the inelastic behavior is based on the following assumptions:
Shear failure is precluded.The inelastic deformations are concentrated at the critical sections, i.e., at the ends of the frame elements (plastic hinges). Plastic hinges are modeled by bilinear elastic-perfectly plastic moments-rotations diagrams (M-θ). The bending moment-axial force interaction is taken into account by using the ACI 318-02 interaction surface which is available in the program SAP 2000 v10.0.7.
Step 2. Application of Forces and Determination of E1-UN1 DIAGRAM
The structural model is subjected to horizontal incremental forces with distribution along the height proportional to the vector
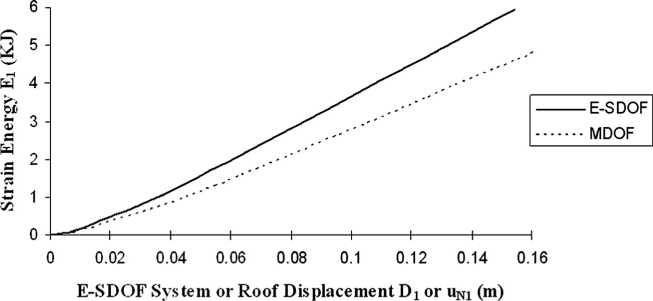
External work-roof displacement E1-uN1 and strain energy-E-SDOF system displacement E1-D1 diagrams.
Step 3. Determination of E1-D1 DIAGRAM
By dividing the abscissas of the E1-uN1 diagram by the quantity u N1 /D1 = ν 1 ϕ N 1 = 1.26 x 1.00 = 1.26 the strain energy-E-SDOF system displacement diagram for the first vibration mode E1-D1 is determined (Figure 5).
Step 4. Determination of V1-D1 DIAGRAM
The resisting force V1,λ at each step λ is calculated by applying Equations 14, 15, and 16, so the resisting force-E-SDOF system displacement diagram for the first vibration mode V1-D1 is determined (Figure 6a). In the same figure the corresponding diagram derived by the conventional pushover procedure (CP) is also plotted.
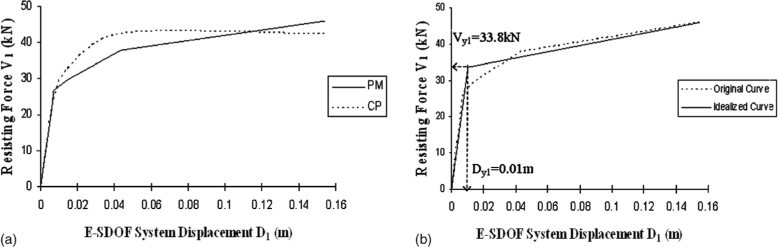
(a) Resisting force-E-SDOF system displacement diagrams V1-D1 for the first mode, and (b) idealization of resisting force-E-SDOF system displacement diagram for the proposed method.
Step 5. Idealization of V1-D1 DIAGRAM AND CALCULATION OF THE CHARACTERISTICS OF THE E-SDOF SYSTEM
The resisting force-E-SDOF system displacement diagram V1-D1 is idealized to a bilinear curve (Figure 6b). The idealization is based on the following assumptions:
The areas between each curve and displacement axis (i.e., the strain energy of the E-SDOF system) should be equal. It is assumed that the original and the idealized curves intersect each other at the maximum displacement.
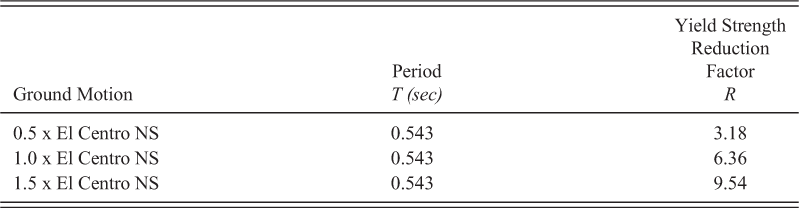
Of course, one may alternatively utilize another graphic procedure (e.g., ASCE 41-06, Section 3.3.3.2.5). The characteristics of the E-SDOF system are calculated from Equation 10 for each ground motion considered and they are shown in Table 2.
Characteristics of the E-SDOF system
Step 6. Calculation of Target Displacement and other Response Quantities
The target displacement is calculated by means of NL-RHA of the E-SDOF system and multiplication of the resulting displacement by ν 1 ϕ N 1 = 1.26. The remaining response quantities are determined by conducting pushover analysis up to the target roof displacement. The results determined by the PM are compared with those obtained by NL-RHA.
Table 3 shows the story displacements and drifts determined by PM and NL-RHA. It becomes clear that the two procedures give similar displacement profiles. However, PM is a little conservative. Specifically, in reference to the roof displacement, which is considered as representative of the seismic performance of structures, PM leads to an error from about 1% (1.0 x El Centro NS) to 40% (1.5 x El Centro NS). The story drifts are also overestimated, except the drift of third story for 1.0 x El Centro NS ground motion (underestimation 18%).
Floor displacements, story drifts and plastic rotations at critical sections of beams
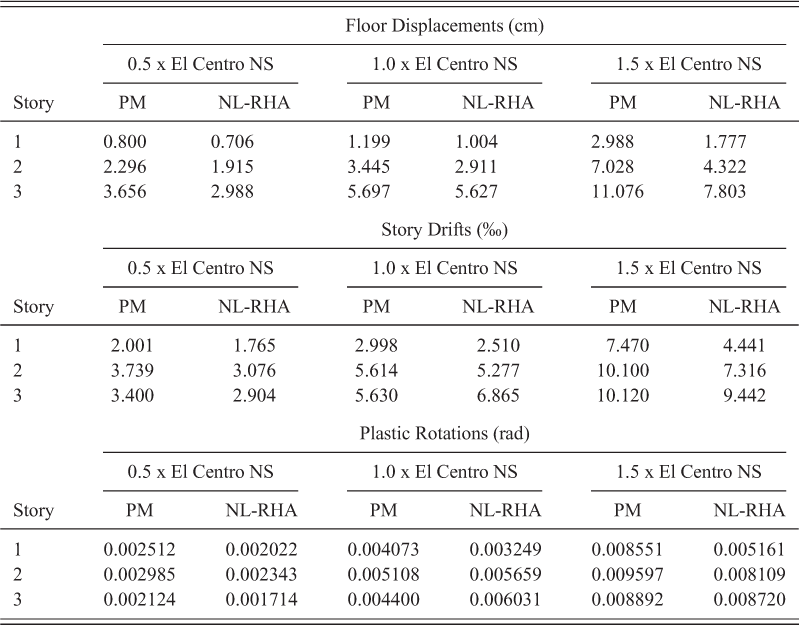
Locations of plastic hinges determined by PM and NL-RHA are identical. In particular, for 1.0 and 1.5 x El Centro NS excitations a plastic mechanism was created, while for 0.5 x El Centro NS plastic hinges were formed only at beams’ ends. In Table 3 plastic rotations at critical sections of beams determined by PM and NL-RHA are also plotted. Notice that the maximum plastic rotations at the left and right end of each beam are equal, because the considered frame is symmetric (see also Step 7). As it is shown, with only one exception, the errors range between -25% and 25%.
Step 7. Application of Steps 2-6 for Forces Acting in the opposite Direction
Because of the symmetry of the structural model, it is not necessary to apply the lateral forces in both directions, so this step can be skipped.
Evaluation of the Proposed Methodology
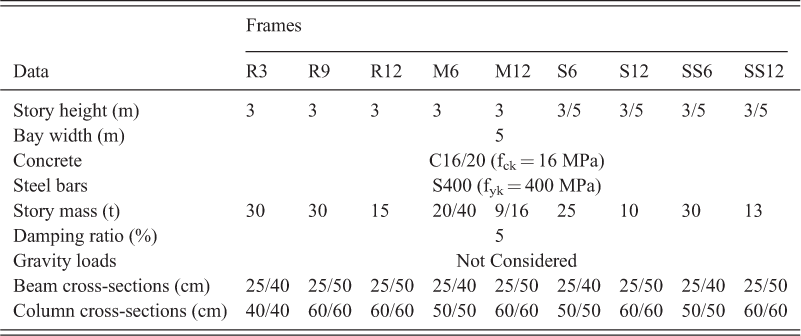
In order to evaluate the accuracy of the proposed methodology an extensive parametric study is carried out. In particular, the methodology is applied to a series of 3-, 6-, 9- and 12-story R/C planar frames designed according to old Greek codes (Figure 7, Table 4). Each frame is characterized by a string symbol comprising one or two letter(s) and a number which indicates the number of its stories. The meaning of the letter(s) is as follows:
Geometrical scheme of the analyzed frames. Data of the analyzed frames R – M – Frames with irregular distribution of S – Frames with irregular distribution of SS – Frames with 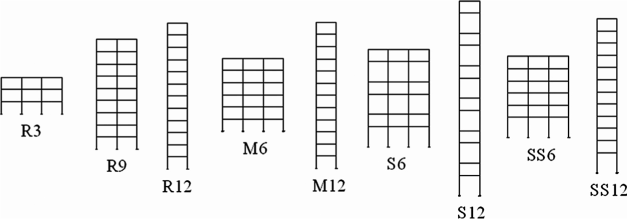
For each frame three sets of pushover analyses are performed: i) one based on the proposed methodology (PM), ii) a second based on a procedure similar to the existing energy-based methods, i.e., according to it the energy equivalence between MDOF and E-SDOF systems is achieved by modifying the displacements (EB) and iii) a third based on the conventional displacement modification procedure (CP). The only difference between the three applied pushover procedures is the determination of the V1-D1 diagram (step 4), while the rest steps and assumptions are identical (see also the previous numerical example). V1-D1 diagram affects the characteristics of the E-SDOF system (particularly the proposed method leads to shorter T and greater R) and as a consequence the estimation of the target displacement. Each set of analyses comprises 12 different accelerograms corresponding to strong earthquake motions recorded in Greece. The maximum response of the E-SDOF system is calculated by means of nonlinear dynamic analysis for each excitation. Then, the target roof displacement is either estimated by multiplication of the resulting response by the quantity ν 1 ϕ N1 (PM, CP) or obtained by the roof displacement–energy-based displacement correspondence (EB) (Hernadez-Montes et al. 2004).
The story displacements and drifts of the frames under consideration are compared with those obtained by nonlinear response history analysis, which is considered as the reference solution. In Figures 8 and 9 the mean errors for the 12 excitations (in relevance to the NL-RHA results) of story displacements and drifts are shown. Notice that the positive sign (+) means that the response parameters obtained by NSPs are greater than those obtained by nonlinear time-history analysis. Conversely, the negative sign (-) means that the response parameters are underestimated by NSPs. From Figures 8 and 9 becomes clear that the proposed concept for the determination of the E-SDOF system leads to more accurate estimation of the target roof displacement (only in the case of frame R12, EB gives a little lower mean error). Mean errors range from -1% to 17% for PM, from 1% to 45% for EB and from 5% to 52% for CP. Concerning the rest response quantities, the mean errors resulting from the PM are sufficiently smaller in most cases (80% and 73% of cases in relevance to CP and EB respectively). All the three applied procedures fail to provide a reasonable estimation for drifts at the upper stories of taller frames. Such failures have been observed in many similar investigations due to the higher mode effects (e.g., Manoukas et al. 2006).
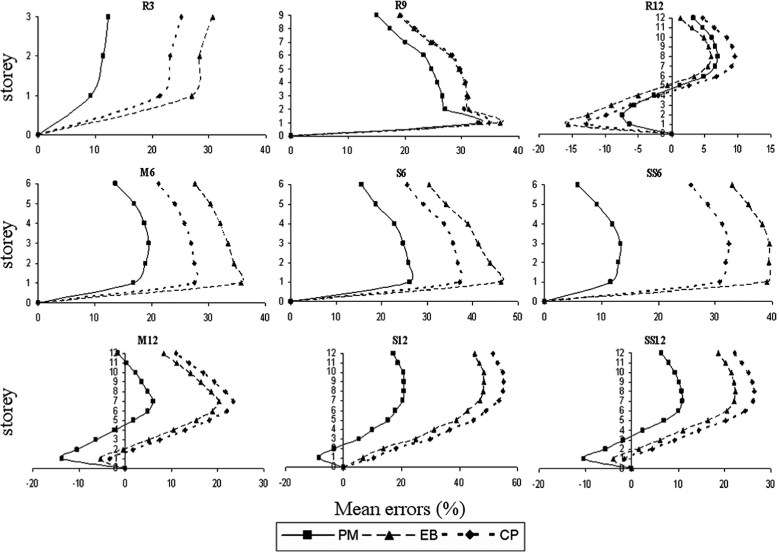
Mean errors (%) of story displacements.
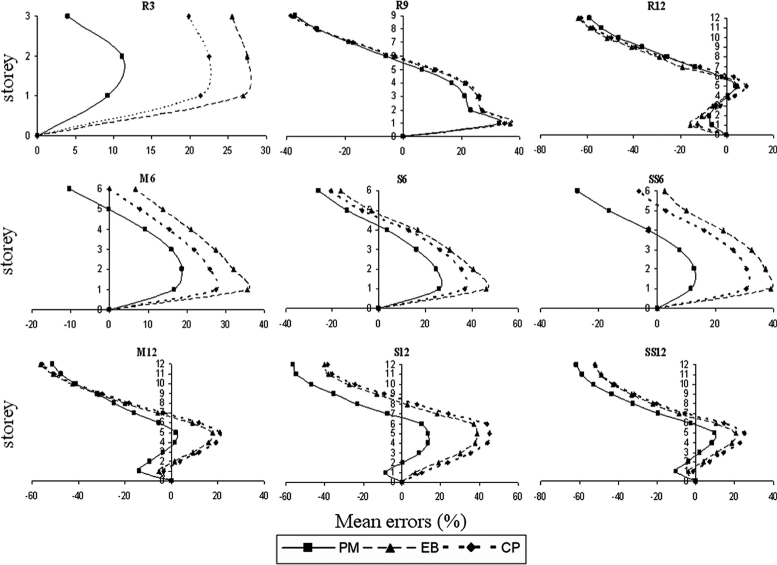
Mean errors (%) of story drifts.
Conclusions
A new energy-based nonlinear static procedure (NSP) is presented in this paper. According to this procedure the determination of the characteristics of the E-SDOF system is based on a different concept with regard to the methods adopted by seismic codes. Specifically, the characteristics of the E-SDOF system are determined by equating the external work of the lateral loads acting on the MDOF system under consideration to the strain energy of the E-SDOF system. This energy equivalence could be achieved by modifying either the displacement or the resisting force of the E-SDOF system. In contrast to other energy-based procedures, the proposed method follows the latter approach. The target displacement is then determined by using one of the well-known displacement modification procedures (e.g., ASCE 41-06). The preliminary evaluation of the proposed method shows that it leads to more accurate estimation of target roof displacement. Furthermore, in most cases the values of the remaining response parameters (story displacements and drifts) are more accurate too. None of the three applied pushover procedures can provide reasonable estimations of drifts at upper stories of tall buildings due to the higher modes effects. Conclusively, the whole investigation shows that, in general, the proposed methodology gives better results compared to those produced by the other applied procedures. However, the generalization of such conclusions is risky. In order to obtain secure generalized conclusions excessive investigations would be necessary comprising application of the proposed method to a large variety of structures and using an adequate number of earthquake ground motions.
For the present, the proposed method can be rigorously applied to low- and medium-rise planar frame structures with rather small contribution of higher mode effects. However, it can be easily expanded in a manner that allows its application to high-rise planar frames with significant contribution of higher modes, as well as to multistory asymmetric 3-D buildings. Relevant investigations are in progress and will be presented in a forthcoming paper.
Finally, it is worth noticing that the implementation of the proposed procedure in existing analysis software can be accomplished without particular difficulty.