





Abstract
This paper contains ground-motion prediction equations (GMPEs) for the vertical-to-horizontal spectral acceleration (V/H) ratio, and the methods for constructing vertical design spectra that are consistent with the probabilistic seismic hazard assessment results for the horizontal ground motion component. The GMPEs for V/H ratio consistent with the horizontal GMPE of Abrahamson and Silva (2008) are derived using the Pacific Earthquake Engineering Research Center's Next Generation of Ground-Motion Attenuation Models (PEER-NGA) database (Chiou et. al. 2008). The proposed V/H ratio GMPE is dependent on the earthquake magnitude and distance, consistent with previous models, but it differs from previous studies in that it accounts for the differences in the nonlinear site-response effects on the horizontal and vertical components. This difference in nonlinear effects results in large V/H ratios at short spectral periods for soil sites located close to large earthquakes. A method to develop vertical design spectra dependent on the horizontal component uniform hazard spectrum that accounts for the correlation between the variability of the horizontal ground-motion model and the variability of the V/H ratio ground-motion model is proposed.
Introduction
Vertical ground motions are often considered in the seismic design of critical structures such as nuclear power plants and dams, but not for standard structures; however, recent studies suggest that the effect of the vertical ground-motion component can also be significant for the seismic response of ordinary highway bridges on sites located within about 15 km of major faults (Kunnath et. al. 2008, Gülerce and Abrahamson 2010). There are two main approaches that can be used to develop the vertical design spectra in a probabilistic seismic hazard assessment (PSHA): (1) compute the hazard for vertical ground motions using vertical ground-motion prediction equations (GMPEs) following the same approach used for the horizontal component, or (2) use a vertical-to-horizontal spectral acceleration (V/H) ratio model to scale the horizontal spectrum that was developed using the results of the horizontal component PSHA.
A disadvantage of the first approach is the lack of availability of updated vertical GMPEs. Although a large number of researchers have developed GMPEs for the horizontal ground-motion component, vertical component equations have not been included except for a few cases: Abrahamson and Silva (1997), Campbell (1997), Sadigh et. al. (1997), Ambraseys and Douglas (2003), Bozorgnia and Campbell (2004), and Ambraseys et. al. (2005). The recently developed PEER-NGA models (Abrahamson and Silva 2008, Boore and Atkinson 2008, Campbell and Bozorgnia 2008, Chiou and Youngs 2008, and Idriss 2008) provide improved horizontal GMPEs that include recent large-magnitude earthquakes, but new GMPEs for the vertical components of the NGA models are currently not available.
Another disadvantage of conducting separate PSHAs for the horizontal and vertical ground motions is that it can lead to horizontal and vertical spectra that correspond to different earthquake scenarios. The different controlling earthquakes are a result of the different distance and magnitude scaling and different standard deviation values of vertical GMPEs compared to horizontal GMPEs. Using V/H ratios to scale the horizontal spectrum avoids this problem by developing a vertical spectrum that is consistent with the horizontal spectrum for the magnitude, distance, and epsilon (number of standard deviations above or below the median) that controls the horizontal hazard. For most structures, the seismic response is mainly due to the horizontal component. Therefore, we prefer using the V/H approach for developing a vertical design spectrum that is consistent with the horizontal design spectrum.
There are two approaches for estimating V/H ratios: 1) developing separate vertical and horizontal GMPEs and then computing the ratio for a given magnitude and distance or 2) developing a GMPE for the V/H ratio directly. In their recent studies, Bozorgnia and Campbell (2004) used the first approach (ratio of the two GMPEs) and Ambraseys and Douglas (2003) use the second approach (GMPE for the V/H ratio). In this paper, we follow the second approach and derive empirical models for the V/H ratio of peak ground acceleration (PGA), peak ground velocity (PGV), and 5%-damped spectral acceleration parameters using the subset of the PEER-NGA database selected by Abrahamson and Silva (2008). The functional form of the V/H model is consistent with the functional form used for the horizontal component of the NGA model developed by Abrahamson and Silva (2008). Following the development of the V/H ratio model, we present three alternative methods to compute the site-specific spectrum for the vertical component using the V/H ratio approach.
Selection of the Dataset
The Abrahamson and Silva (2008) ground-motion model is based on a subset of the PEER-NGA database described by Chiou et. al. (2008). The general approach used by Abrahamson and Silva (2008) for selecting the subset of data for use in the regression analysis was to include all earthquakes, including aftershocks, from shallow crustal earthquakes in active tectonic regions under the assumption that the median ground motions from shallow crustal earthquakes at distances of less than about 100 km are similar across the world. At larger distances, they found that there are stronger regional differences. Because the objective of the NGA project was to develop GMPEs for application to the Western United States (WUS), recordings from the WUS were included for distances out to 200 km and data within 100 km were used for earthquakes outside the WUS. The same dataset selected by Abrahamson and Silva (2008) for the horizontal component is used for this study, with small changes due to the availability of vertical component ground-motion data: the recordings with missing vertical components are excluded. The subset used in this study consists of 2,684 sets of recordings (horizontal and vertical components) from 127 earthquakes. The differences between the final subset of earthquakes for this study and for the Abrahamson and Silva (2008) model are listed in Table 1.
For each vertical and horizontal recording, there is a minimum useable frequency provided in the database (Chiou et. al. 2008). The larger (most restrictive) of the minimum useable frequencies listed for the horizontal and vertical components is selected for each recording. The response spectral values for the recordings in the dataset are only used in the regression analysis if the spectral frequencies are greater than 1.25 times the high-pass corner frequency. As a result, the size of the dataset used in the analysis decreases as the spectral period increases. The resulting period dependence of the number of recordings used in the regression analysis is shown in Figure 1. The significant drop in the number of recordings at 2.6 s indicates that the long-period predictions from this model are not well constrained by the empirical data. The magnitude-distance distributions for PGA and spectral acceleration at T = 3 s are shown in Figures 2a and 2b, respectively.

Period dependence of the number of recordings in our subset based on the lowest useable frequency.

Distribution of magnitude-distance pairs (a) for PGA and (b) for T = 3 s.
The site conditions are classified using the average shear-wave velocity in the top 30 meters (VS30). The parameter for the soil depth, depth to VS = 1.0 km/s (Z1.0), is not used in the V/H ratio model since the analytical model results used to constrain the Z1.0 scaling are not available for the vertical component. Following Abrahamson and Silva (2008), the closest distance to the rupture is used as the distance measure.
An important issue for the dataset selection in the Abrahamson and Silva (2008) model was the treatment of the very large number of ground motions from the Chi-Chi earthquake. As with the horizontal ground motions, the vertical ground motions recorded during the mainshock of Chi-Chi earthquake are systematically lower than the other large-magnitude events in the dataset as shown in Figure 3b, but the V/H ratio is not unusually low (Figure 3a). Therefore, the Chi-Chi mainshock event is included in the dataset.

(a) V/H ratios for T = 0.1 s for magnitude 7 or higher events in the NGA database normalized to VS30 = 550 m/s, and (b) vertical spectral acceleration for T = 0.1 s for magnitude 7 or higher events in the NGA database normalized to VS30 = 550 m/s vs. rupture distance.
Functional Form of the Model
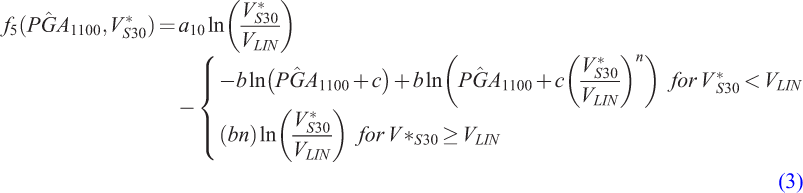
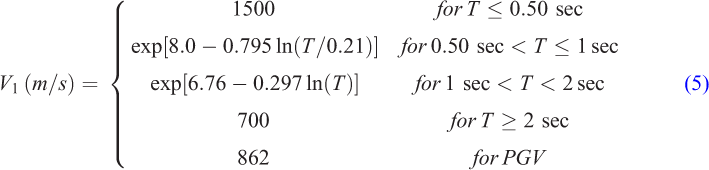
The V/H ratio model dependence on the magnitude, distance, style-of-faulting, and site conditions is selected to be consistent with the functional form used by the Abrahamson and Silva (2008) horizontal component NGA model. The base form of the magnitude and distance dependence for the strike-slip earthquakes (given by Equation 1) and style-of-faulting effects (using the flags FRV and FNM as given in Equation 6) are adopted without a change from the Abrahamson and Silva (2008) model.




Summary of differences in the dataset used by Abrahamson and Silva (2008) for the horizontal component and the dataset used in this study for the V/H ratio
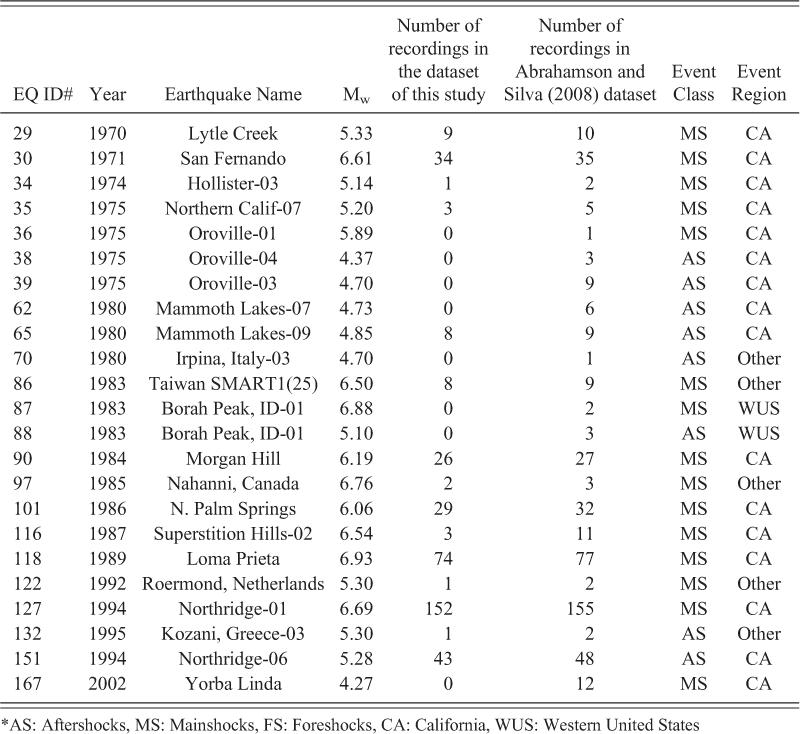
AS: Aftershocks, MS: Mainshocks, FS: Foreshocks, CA: California, WUS: Western United States
Period-independent constants for the median V/H ratio

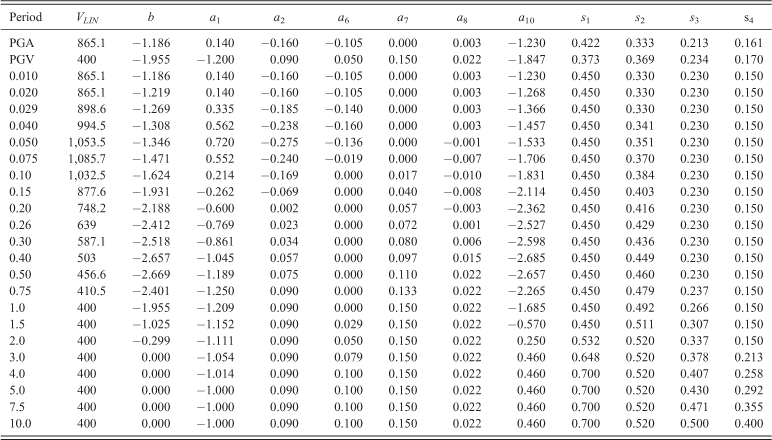
Coefficients for the median V/H ratio and standard deviation




Inter-event residuals (natural log units) for (a) T = 0.1 s and (b) T = 2 s.

Intra-event residuals with respect to distance for (a) T = 0.1 s and (b) T = 2 s.

Intra-event residuals with respect to VS30 for (a) T = 0.1 s and (b) T = 2 s.
Model Results
The median predicted V/H ratios for vertical strike-slip earthquakes at rock sites (VS30 = 760 m/s) at rupture distances of 5 km and 30 km for M5–M8 earthquakes are shown in Figures 7a and 7b, respectively. Similar plots for soil sites (VS30 = 270 m/s) are shown in Figures 8a and 8b. The median V/H ratio curves shown in Figures 7 and 8 exhibit the well-known shape with a peak near the spectral periods of 0.05 s and a trough near 0.3 s for rock sites, and near 1.0 s for soil sites. Beresnev et. al. (2002) showed that for strong ground motions, the vertical component is dominated by SV-waves for spectral periods greater than 0.1 s, but is a mixture of P-waves and SV-waves for periods less than 0.1 s. Therefore, the peak in the V/H ratio at short periods reflects the stronger site amplification (less damping) for P-waves at short periods than for S-waves, whereas the trough at intermediate periods reflects the stronger amplification for SH-waves as compared to inclined SV-waves.

Median V/H ratios from the proposed model for vertical strike-slip earthquakes at rock sites (VS30 = 760 m/s) (a) 5 km away from the fault (Rrup = 5 km), and (b) 30 km away from the fault (Rrup = 30 km).

Median V/H ratios from the proposed model for vertical strike-slip earthquakes at soil sites (VS30 = 270 m/s) (a) 5 km away from the fault (Rrup = 5 km), and (b) 30 km away from the fault (Rrup = 30 km).
The magnitude dependence of the V/H ratio at short spectral periods is much stronger for soil sites (Figure 8) than for rock sites (Figure 7) due to the nonlinear site response for soil sites, which leads to additional damping of short-period horizontal ground motions.
Scaling of the V/H ratio with VS30 at short periods (T = 0.05 s) and long periods (T = 1.0 s) are shown in Figures 9a and 9b. At short periods, the V/H ratio decreases with increasing VS30, reflecting the stronger increase in damping for S-waves than for P-waves on soil sites as compared to rock sites. At long periods, the V/H ratio increases with increasing VS30 due to the stronger VS30 dependence for the horizontal component compared to the vertical component, as has been seen from previous studies (e.g., Abrahamson and Silva, 1997). The difference between the short-period V/H ratio at 5 km and 30 km (Figure 9a) is due to the steeper distance attenuation coefficient for vertical ground motions. At long periods, the distance attenuation is similar between the horizontal and vertical ground-motion components, as shown by the similar V/H ratios in Figure 9b.

Scaling with VS30 of median V/H ratio from magnitude 7 vertical strike-slip earthquakes 5 km away from the fault (Rrup = 5 km) and 30 km away from the fault (Rrup = 30 km) for (a) T = 0.05 s, and (b) T = 1 s. (PGA1100 is assumed to be constant as 0.1 g).
The distance scaling of the median V/H ratio from vertical strike-slip earthquakes at rock site conditions is shown in Figure 10 for spectral periods of 0.05 s and 1.0 s. For short periods, there is a strong decrease in the V/H ratio, reflecting the more rapid attenuation of P-waves than S-waves. For long periods, the V/H ratio is nearly independent of distance with slight increase at large distances.

Scaling with distance of median V/H ratio from vertical strike-slip earthquakes at rock site conditions for (a) T = 0.05 s, and (b) T = 1 s. (PGA1100 is assumed to be constant as 0.1 g).
Figures 11a and 11b show the median V/H ratio model for a magnitude 7 earthquake at a rupture distance of 5 km for different source mechanisms at soil (VS30 = 270 m/s) and rock sites (VS30 = 760 m/s), respectively. The source mechanism has only a week effect on the V/H ratio with reverse earthquakes having a slightly smaller V/H ratio than for strike-slip earthquakes. This is contrary to the commonly held belief that V/H ratios would be higher for reverse events because the reverse earthquakes have a large vertical component of slip, whereas strike-slip earthquakes have mainly horizontal slip. There are few normal faulting events in the data set to constrain the normal faulting dependence of the V/H ratio, but the available normal faulting data lead to similar V/H ratios as strike-slip earthquakes.

Median V/H ratios from the proposed model for a magnitude 7 earthquake 5 km away from the fault (Rrup = 5 km) for different source mechanisms at (a) soil sites (VS30 = 270 m/s), and (b) rock sites (VS30 = 760 m/s).
Figures 12 and 13 show the median response spectra of the current model and the Abrahamson and Silva (1997) model for magnitudes 5 and 7 for rock and soil sites at the rupture distance of 5 km and 30 km, respectively. The median V/H ratios from the current model are in a good agreement with the median ratios from Abrahamson and Silva (1997) model for the soil sites at 30 km (Figure 13b). According to Abrahamson and Silva (2008), most of the data used in Abrahamson and Silva (1997) model are from soil sites and the center of the data is around 30 km, therefore agreement of the models at this distance for soil sites is expected. At short distances (Figure 12), there is a significant difference in the models for magnitude 5. The Abrahamson and Silva (1997) model had few data below magnitude 6 so magnitude 5 scaling was not well constrained, particularly at short distances. The NGA data set includes many more earthquakes in the M5–M6 range, leading to an improved model for smaller magnitudes at short distances.

Comparison of median spectral acceleration from the current model with the median spectral acceleration from the Abrahamson and Silva (1997) model for vertical strike-slip earthquakes for Rrup = 5 km for (a) rock sites (VS30 = 760 m/s), and (b) soil sites (VS30 = 270 m/s).

Comparison of median spectral acceleration from the current model with the median spectral acceleration from the Abrahamson and Silva (1997) model for vertical strike-slip earthquakes for Rrup = 30 km for (a) rock sites (VS30 = 760 m/s), and (b) soil sites (VS30 = 270 m/s).
Figures 14 and 15 compare the median response spectrum from the current model with previous models for magnitude 7 earthquakes with rupture distances of 10 km and 30 km. For rock sites, the current model is similar to Bozorgnia and Campbell (2004) model but slightly lower than the Abrahamson and Silva (1997) model in the short period range. The Ambraseys and Douglas (2003) V/H ratio model does not include spectral periods between 0.02 s and 0.1 s, so it misses the short-period peak in the V/H ratio. At long periods, the Ambraseys and Douglas (2003) model leads to much larger ratios than the other models for both rock and soil sites. We do not have an explanation for this difference at long periods. At a distance of 30 km (Figure 15), the V/H ratios for this study are similar to the results from the previous studies for soil sites, but there are larger differences for rock sites. (Note: the Ambraseys and Douglas (2003) model is only for distances less than 15 km and is not shown in Figure 15).

Comparison of median spectral acceleration from the current model with the median spectral acceleration from the Abrahamson and Silva (1997), Ambraseys and Douglas (2003), and Bozorgnia and Campbell (2004) models for vertical strike-slip earthquakes for Mw = 7 and Rrup = 10 km for (a) rock, and (b) soil.

Comparison of median spectral acceleration from the current model with the median spectral acceleration from the Abrahamson and Silva (1997), and Bozorgnia and Campbell (2004) models for vertical strike-slip earthquakes for Mw = 7 and Rrup = 30 km for (a) rock, and (b) soil.
Developing the Vertical Design Spectrum
A common method for developing design spectra based on the probabilistic approach is to use the Uniform Hazard Spectrum (UHS). The UHS is developed by computing the hazard independently at a set of spectral periods and then computing the ground motion for a specified probability level at each spectral period. The term “uniform hazard spectrum” is used because the spectral acceleration value at each period has an equal chance of being exceeded. Because the hazard is computed independently for each spectral period, the UHS does not represent the spectrum of any single earthquake. It is common to find that the high-frequency ground motions are controlled by nearby moderate-magnitude earthquakes, whereas, the long-period ground motions are controlled by distant large-magnitude earthquakes (McGuire 2004).
An alternative to using the UHS is to develop scenario spectra. The controlling earthquake for a given spectral period is determined from the deaggregation and the median spectral shape of the controlling earthquake scenario is then scaled to the UHS value at the given spectral period. Repeating this process for two or three spectral periods, a suite of scenario spectra can be developed by repeating this process for two or three spectral periods. Taken together, the envelope of the suite of scenario spectra will be similar to the UHS. A shortcoming of using scenario spectra based on the scaled median spectral shape is that it assumes full correlation of the variability of the ground motion at different spectral periods. The scenario spectrum from the controlling scenario may not be representative of the spectrum that is expected if the scenario earthquake occurs and the spectral value at the specified spectral period equals the UHS. This is most important for UHS values controlled by large epsilon values. Recorded ground motions with large positive epsilons at a particular period, T0, will tend to have peaks in the spectra at that period. The spectral values at other spectral periods will, on average, not have as large of epsilon values and therefore will have a smaller peak. Using the median spectral shape corresponds to assuming that the spectral values at all of the other periods are also peaks.
Baker and Cornell (2006) recommended that rather than using median spectral shapes for the controlling events, conditional mean spectra (CMS) be used that account for the effects of epsilon on the spectral shape. To develop the CMS, the results of the PSHA are used to determine the UHS and median spectral shape for the controlling events based on the GMPEs. The expected (mean) epsilon at any spectral period T can be computed given the epsilon at the reference spectral period T0 as shown in Equation 10:


As discussed in the introduction, there are two main approaches for developing vertical design ground motions: the independent vertical ground-motion model approach and a V/H model approach. For the independent vertical ground-motion approach, the procedure is the same as described above for the horizontal component. The PSHA should be conducted using the vertical GMPEs and vertical UHS or vertical CMS may be developed using the results. If the V/H ratio approach is used, as recommended here, there are three alternative methods for developing vertical spectra that we consider.
In the first alternative, the median V/H ratio is computed at each spectral period using the magnitude and distance from the deaggregation of the hazard for the horizontal component. The horizontal UHS is then scaled by the median V/H as given in Equation 12:

In the second alternative, the median V/H is computed at each spectral period using the dominating scenario that was used to calculate the horizontal CMS, and then the horizontal CMS is scaled by the median V/H ratio as shown in Equation 13:

In the third alternative, a vertical CMS, conditioned on the horizontal CMS at the reference spectral period T0, is developed as shown in Equation 14:


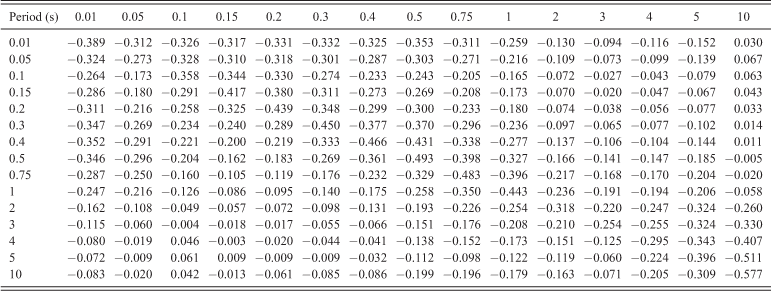
Intra-event correlation coefficients between the horizontal and V/H ratio GMPE epsilons (The first row indicates the horizontal period and the first column indicates the period of the V/H ratio model)
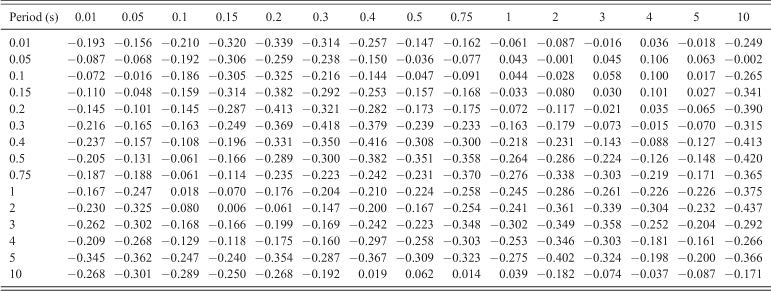
Inter-event correlation coefficients between the horizontal and V/H ratio GMPE epsilons (The first row indicates the horizontal period and the first column indicates the period of the V/H ratio model)
The three alternative methods for computing the site-specific design spectra for the vertical ground motion are shown for two sites in northern California: one site close to an active fault (Berkeley, CA located at 122.27W, 37.87N) and one site far from active faults (Davis, CA located at 121.74W, 38.54N). A probabilistic seismic hazard analysis for the horizontal component was conducted for the two example sites using the USGS Working Group (2003) source characterization and the Abrahamson and Silva (2008) GMPE. The hazard curves for several spectral periods are presented in Figures 16a and 16b, respectively. The UHS for the two sites for a return period of 975 years (5% in 50 years) are presented in Figure 17.

The probabilistic seismic hazard curves for the horizontal component for (a) an example site in Berkeley (coordinates are latitude −122.27, longitude 37.87), and (b) an example site in Davis (coordinates are latitude −121.74, longitude 38.54).

The 975-years uniform hazard spectra for the example sites in Berkeley and Davis.
The deaggregation (Bazzurro and Cornell 1999) of the hazard at 0.2 s and 2 s spectral periods shown in Figures 18a and 18b for the example site in Berkeley indicates that the hazard is dominated by the nearby Hayward Fault (M = 6.5–7, 0–5 km) for all spectral periods. The deaggregation for the Davis site is shown in Figures 18c and 18d. At short periods, the hazard is dominated by earthquakes at distances of 30 km–50 km due to the large distance to the Hayward and other active faults. At long periods, the deaggregation for Davis is bimodal with similar contributions from the Hayward and San Andreas Faults. The modal magnitude and distance is M = 7.5–8.5, 100–120 km.

The deaggregation of the hazard for an example site in Berkeley (a) for 0.2 s spectral period, (b) for 2 s spectral period; and deaggregation of the hazard for an example site in Davis (c) for 0.2 s spectral period, (d) for 2 s spectral period.
The median horizontal spectral shapes for the controlling events are developed for each site by the Abrahamson and Silva (2008) ground-motion prediction model for the dominating scenarios at short and long periods (note that the same scenario is dominating the hazard at both short and long spectral periods for the Berkeley site). The median events are scaled using Equations 10–11 to develop the horizontal CMS for 0.2 s and 2 s spectral periods for the example sites and are shown in Figures 19a and 19b, respectively. Using the first approach, the horizontal UHS is scaled by the median V/H ratio to develop the site-specific design spectra for the vertical ground motion as given in Equation 12. The results for the example sites in Berkeley and Davis are presented in Figures 20a and 20b, respectively.

The median spectral accelerations using Abrahamson and Silva 2008 and horizontal CMS at 0.2 s and 2 s periods for (a) example site in Berkeley, and (b) example site in Davis.

The horizontal UHS scaled by median V/H for the dominating scenario at each spectral period for (a) Berkeley city center, and (b) Davis city center.
Using the second approach, the horizontal CMS is scaled by the median V/H for T0 = 0.2 s and T0 = 2 s as given in Equation 13. The results for the example sites are shown in Figure 21. Using the third approach, the CMS for the vertical component is computed accounting for the correlation between the horizontal spectral acceleration and the V/H ratio. The vertical CMS for T0 = 0.2 s and T0 = 2 s reference periods at the example sites are shown in Figure 22. Figure 23 compares all three alternatives for the two reference periods for the Berkeley and Davis sites. Alternative 1 leads to the largest vertical ground motions and Alternative 3 leads to the lowest vertical ground motions. Alternatives 1 and 2 give the same vertical ground motion at T0, but Alternative 2 gives up to a factor of 3 lower vertical ground motions at long periods that are away from T0. Alternative 3 leads to lower vertical spectral values at T0. This occurs because of the negative correlation between the horizontal and V/H ratio models (see Tables 4 and 5) at the same spectral periods. The negative correlation indicates that if the horizontal spectral value is above average then the expected V/H ratio will be below average. At periods far from T0, the correlation between the horizontal spectral values and the V/H ratio is close to zero and Alternative 3 leads to the median V/H ratio. So if the period is far from T0, Alternative 3 leads to the same vertical spectral values as Alternative 2, which uses the median V/H for all periods. This effect is seen in Figure 23c and 23d; at periods greater than 1 s, Alternatives 2 and 3 give the same results.

The horizontal CMS at 0.2 s and 2 s spectral periods scaled by median V/H for (a) Berkeley city center, and (b) Davis city center.

The vertical CMS for T0 = 0.2 s and T0 = 2 s reference periods for (a) an example site in Berkeley, and (b) an example site in Davis.

Alternative site-specific vertical spectra for T0 = 0.2 s reference period for (a) example site in Berkeley, (b) example site in Davis, alternative site specific vertical spectra for T0 = 2 s reference period for (c) example site in Berkeley, (d) example site in Davis.
Conclusions
The proposed GMPE for the V/H ratio is applicable to magnitudes M5–M8.5 for strike-slip, M5–M8 for dip-slip, distances of 0 km–200 km for the WUS and distances of 0 km–100 km for other regions, and spectral periods up to 10 s. This broad range of applicability reflects constraints applied to the GMPE so that it extrapolates within this range in a reasonable manner. One new feature of the V/H ratio model developed in this study is that it accounts for the differences in the nonlinear site-response effects on the horizontal and vertical components, resulting in large V/H ratios at short spectral periods for soil sites located close to large earthquakes. Because the V/H model is based on nonlinear horizontal site response, the V/H model derived in this paper is only applicable to horizontal ground-motion models that include nonlinear horizontal site-response effects. The V/H model can be applied to the four NGA horizontal models that include nonlinear site response.
Alternative methods to develop vertical spectra using the V/H ratio are presented. If the structural response depends more strongly on horizontal ground motions than on vertical ground motions, then Alternative 3 (given by Equation 14) is preferred because it accounts for the correlation of the variability of the horizontal ground motion with the V/H ratio, consistent with a horizontal conditional mean spectrum approach. If the structural response is dominated by the vertical component, then Alternative 1 (given by Equation 12) is preferred since it better represents the vertical hazard, but the combined loading from the horizontal and vertical components is conservative.
Footnotes
Acknowledgments
This work was partially funded by the Pacific Gas & Electric/U.S. Department of Energy (PG&E/DOE) cooperative agreement: “Development and Verification of an Improved Model for Extreme Ground Motions Produced by Earthquakes” (DOE Award No. DE-FC28-05RW 12358).