





Abstract
This study presents an open and transparent exposure model for the residential building stock in South America. This model captures the geographical distribution, structural characteristics (including information about construction materials, lateral load resisting system, range of number of stories), average built-up area, replacement cost, expected number of occupants, and number of dwellings and buildings. The methodology utilized to develop this model was based on national population and housing statistics and expert judgment from dozens of local researchers and practitioners. This model has been developed as part of the South America Risk Assessment (SARA) project led by the Global Earthquake Model (GEM), and it can be used to perform earthquake risk analyses. It is available at different geographical scales for seven Andean countries: Argentina, Bolivia, Chile, Colombia, Ecuador, Peru, and Venezuela (DOI: 10.13117/GEM. DATASET.EXP.ANDEAN-v1.0).
Introduction
Over the last century, South America has been shaken by dozens of destructive earthquakes. Past events have shown that casualties and economic losses are mainly due to damage and collapse of vulnerable residential buildings. For example, the magnitude 6.2 (Mw) Armenia-Quindio earthquake in Colombia (1999) left 160,000 people homeless (10% of the population in the main affected region), and resulted in 8,523 injuries and 1,185 fatalities. Moreover, almost 79,500 homes were affected, of which about 43,500 were damaged, and around 36,000 were uninhabitable or completely damaged. In the department of Quindio, almost 60% of the residential dwellings were affected (CEPAL 1999). Similarly, in 2010, the Pacific Coast of Chile was struck by the magnitude 8.8 (Mw). Maule earthquake, which caused major damage or collapse in almost 200,000 homes, affecting over 2 million people. The economic losses were estimated to be US$30 billion, which is equivalent to 17% of the gross domestic product (GDP) of Chile (Elnashai et al. 2011).
Thirteen countries constitute South America. Its population in 2012 exceeded 400 million inhabitants, where almost 200 million are located in the Andean region, one of the most active seismic zones in the world. In fact, more than 12% of the recorded earthquakes since 1950 with magnitude larger than 6.0 were located in this region, and three of the ten strongest earthquakes registered in history have occurred in this area: Valdivia-Chile (9.5 Mw) in 1960, Maule-Chile (8.8 Mw) in 2010, and Ecuador (8.8 Mw) in 1906 (USGS 2015). The distribution of earthquakes in the region—with moment magnitude larger than 5.5, according to the Global Instrumental Seismic Catalogue v2.0 (1900–2011) available on the OpenQuake platform (2015a)—is presented in Figure 1, along with the seven Andean countries that have been selected for the present study due to their high seismic hazard: Argentina, Bolivia, Chile, Colombia, Ecuador, Peru, and Venezuela.
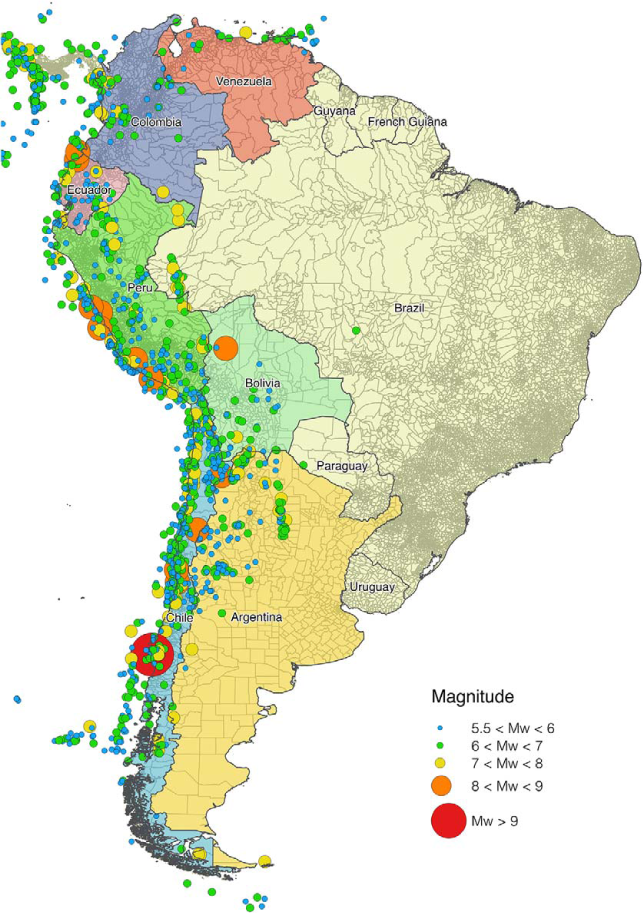
Earthquake catalogue for South America and selected countries for this study: Argentina, Bolivia, Chile, Colombia, Ecuador, Peru, and Venezuela.
The significant seismic activity in the Andean countries has encouraged the development of standards for seismic design and construction of structures in order to prevent and reduce their vulnerability. The seven selected countries have implemented national codes for material, design and construction of buildings that meet international standards. Initially, each country began the development of its own code based on the U.S. regulations, and these have been adjusted over time according to local requirements. Unfortunately, despite governmental efforts in the endorsement of these regulations, some countries still have high rates of informal construction that do not comply with the minimum requirements.
The development and implementation of measures to reduce the physical impact due to earthquakes requires a comprehensive understanding of the potential for human and economic losses, which is usually achieved through earthquake risk assessment studies. The development of exposure models that capture the geographical distribution and main structural characteristics of the building stock exposed to the hazard is a fundamental step in earthquake risk analysis. For this reason, an open and transparent exposure model for the residential building stock in South America has been created.
This exposure model has been developed in close collaboration with local experts as part of the South America Risk Assessment (SARA) project, led by the Global Earthquake Model (GEM 2015) and funded by the SwissRe Foundation. The model is publicly available through a Web platform called SARA wiki (https://sara.openquake.org/risk:exposure), and it includes information regarding the location, building class, number of dwellings and buildings, average built-up area, and average replacement cost at different geographical scales.
Existing Efforts on Exposure Modelling in the Region
Various building inventory databases have been developed at the global scale, following different approaches and with distinct levels of accuracy and reliability. Jaiswal et al. (2010) developed a global building inventory database, which provides a distribution of building classes for urban and rural areas, at a national scale. These authors harmonized various sources of information and applied mapping schemes to infer structural building types globally. This database is open and publicly available. The Global Exposure Database (GED) from GEM provides a spatial inventory of residential buildings and population for the purposes of seismic risk modeling and earthquake loss estimation (Gamba 2014). Data are available at three different geographical scales and the sources of information depend on the selected scale. The data sets used to populate GED include the Database of Global Administrative Areas (GADM 2015), the Global Rural-Urban Mapping Project (GRUMP 2010), the Gridded Population of the World (GPW 2004), the Multiple Indicator Cluster Surveys (MICS), UN Habitat's Global Urban Observatory (GUO) data, United Nations statistics, and PAGER building inventory database (Jaiswal et al. 2010), among others. The GED database is publicly available through the OpenQuake platform (2015b). Another global initiative regarding building inventories is The World Housing Encyclopedia (WHE 2014). Detailed housing reports from all over the world are publicly available and include information about the building type, construction practice, average floor areas, average construction cost, and a qualitative estimation of building's vulnerability under seismic events. The WHE reports do not cover the number of buildings in each country or the associated geographical distribution.
At regional and national levels, several studies have been carried out in the last decades, but unfortunately, the availability of the actual results is often limited and thus inaccessible for risk analysis. Nevertheless, a short description of some of these studies is provided herein.
At the regional level, the Inter-American Development Bank (IDB), the World Bank (WB), and the International Strategy for Disaster Risk Reduction (ISDR) have promoted the evaluation of expected losses through such programs as the Systems of Indicators of Disaster Risk and Risk Management (2010). These studies presented several indicators for disaster risk assessment in 12 nations (including the Andean countries, with the exception of Venezuela), and comprised the development of simplified exposure models based on population census, average built-up area per inhabitants, and average costs per square meter for different building types and zones. Moreover, earthquake losses for three capital cities (Santiago de Chile, Quito, and Lima) have been estimated by Vaziri et al. (2012). An exposure model was created following a 1 × 1 km2 grid for population and buildings. The data sets utilized to collect building information included census data, field surveys and judgment of local experts. The estimation of the population distribution was performed using the LandScan™ database (Dobson et al. 2003).
At the national level, in Colombia, the Evaluación de Riesgos Naturales (ERN; 2004) presented a seismic risk assessment of public buildings and low-income households in order to identify risk-financing mechanisms. In this study, a proxy model of the built-up area was developed using various sources of publicly available data (e.g., census surveys). The list of building classes for this study was defined according to expert opinion. At the local level, various seismic microzonation studies have been developed for the major cities in Colombia (Bogota, Medellin, Cali, Manizales and Bucaramanga), which are located in areas of medium or high seismic hazard. These studies contained detailed building inventory data classified into number of stories and built-up area, but to the Authors knowledge, none of the data sets are publicly available.
In the case of Chile, Tapia et al. (2002) carried out a damage assessment of buildings in northern Chilean cities (Arica, Antofagasta and Copiapo), in which an exposure database was constructed with field surveys and census data, and the main building classes were identified at the block level.
In Ecuador, various studies have been performed for Quito, the capital city, which focused on the analysis of seismic scenarios and probabilistic risk estimates considering the building stock and lifelines. The “Escenario Sísmico de Quito” project was conducted by the local government, and involved the participation of various national and international institutions. In the latter study, an exposure model for the building inventory was created for Quito using the 1990 national census data. This model was developed at the level of blocks (around 11,200) and the buildings were classified into structural classes according to the predominant construction materials and the structural systems (Chatelain et al. 1999, Yépez 2001, EPN-IMQ-OYO 1995).
For Peru, several studies have been performed for the assessment of seismic hazard, vulnerability and risk at different geographical scales, with particular interest in Lima. The Centro Peruano Japones de Investigaciones Sísmicas y Mitigación de Desastres CISMID (2004) led a seismic microzonation study for Lima, in which the exposure model was created by collecting information concerning the construction materials, lateral load resisting system, occupancy and state of conservation of the structures. This model was further improved using satellite imagery and census data as described in Matsuoka et al. (2013).
For Venezuela, Bendito et al. (2014) developed an exposure model for the city of Merida using a database of buildings that included building age, size, location, number of stories, and structural class, as well as population demography based on LandScan™. Moreover, a simplified exposure model for Caracas was developed inside the Ávila project (Delgado and Ortiz 2002), in which the building inventory was developed based on the built-up area of urban blocks in Caracas. This model was later improved in the “Plan Básico de Desastres de Caracas” (JICA 2005).
Development of the Exposure Model
When developing an exposure model, different approaches can be followed depending on the data availability and resources. At regional scale, information coming from remote sensing, population distribution, and national housing databases are commonly utilized. For the present study, only public sources of information were considered, and the primary source was the national and sub-national housing census databases. The development of this model followed four main steps: (1) definition of building classes, (2) mapping census data to building classes, (3) mapping dwellings to building, and (4) estimation of replacement cost. The procedure within each step is described in the following sections. For further details, the reader is referred to the SARA wiki where additional information about the modeling assumptions, results, and complementary reports can be found.
Definition of Building Classes
The building stock has been classified according to a set of building classes that indicate the structural characteristics and expected performance under seismic action. In order to identify the main building classes in the Andean region, a review of existing classifications was conducted. These include the housing reports from the World Housing Encyclopedia (WHE), and the building fractions available in the Global Exposure Database (GED) at the national level, which comprise results from PAGER and UN-HABITAT studies. Moreover, regional experts strongly contributed to the definition of the building classes, and in general to the development of the exposure model described in the present manuscript. In this context, two regional workshops were organized in March 2014 in Medellin (Colombia) and May 2015 in Lima (Peru) with experts from the various Andean countries. These events promoted the discussion between the representatives of the different countries, and allowed sharing experiences and data regarding exposure, vulnerability and results from previous risk studies. The outcomes of these workshops are available through the SARA wiki. Additional information from more than 20 local experts, regarding building classes and mapping schemes, has been sent directly to the GEM Secretariat and has been considered in the development of this exposure model.
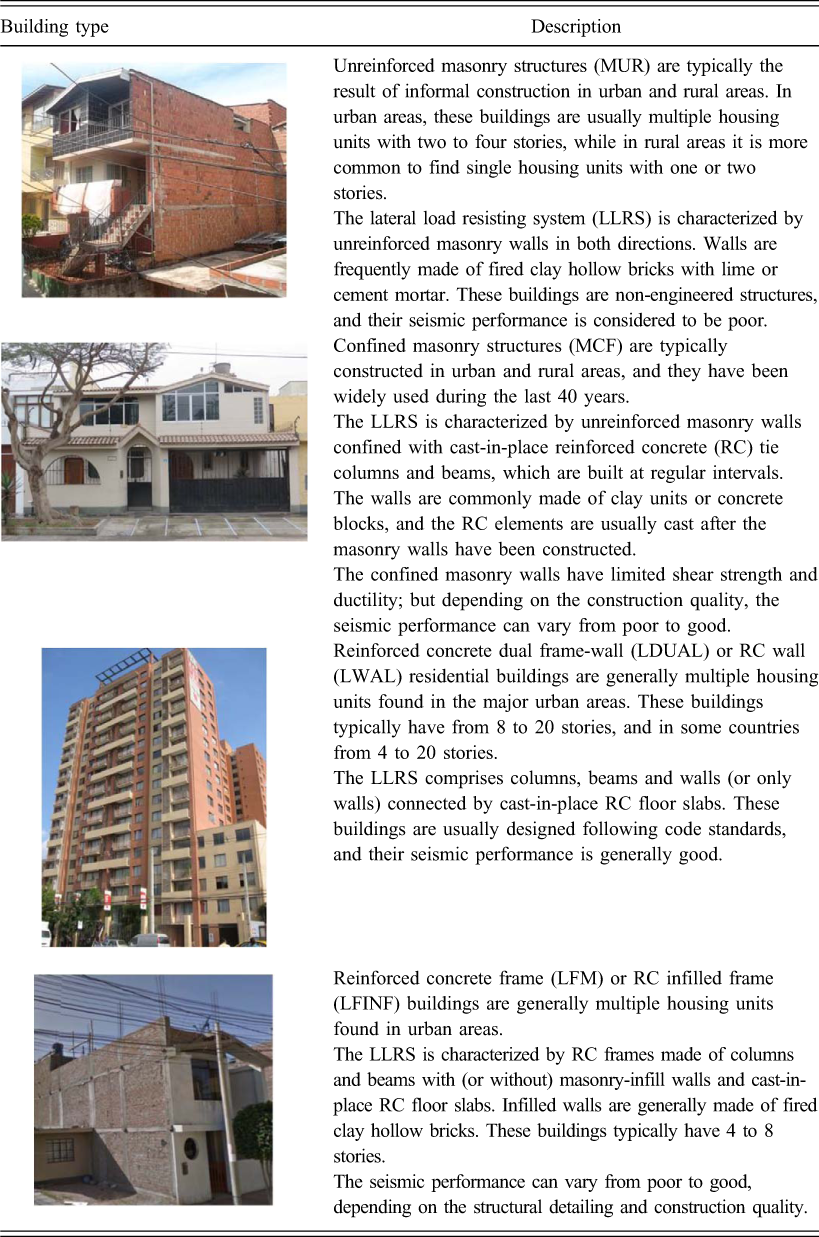
A short description of the most representative building classes in the region is presented in Table 1. Photos of an unreinforced masonry structure in Colombia, a confined masonry house in Peru, a reinforced concrete wall building in Chile, and a reinforced concrete infilled frame in Venezuela are also included. These building classes are common in urban areas, where most of the assets are concentrated, while in rural areas, other types of construction can be found (e.g., adobe, wood, wattle, and daub), but representing a smaller portion of the building stock.
Description of some representative building classes in the region (
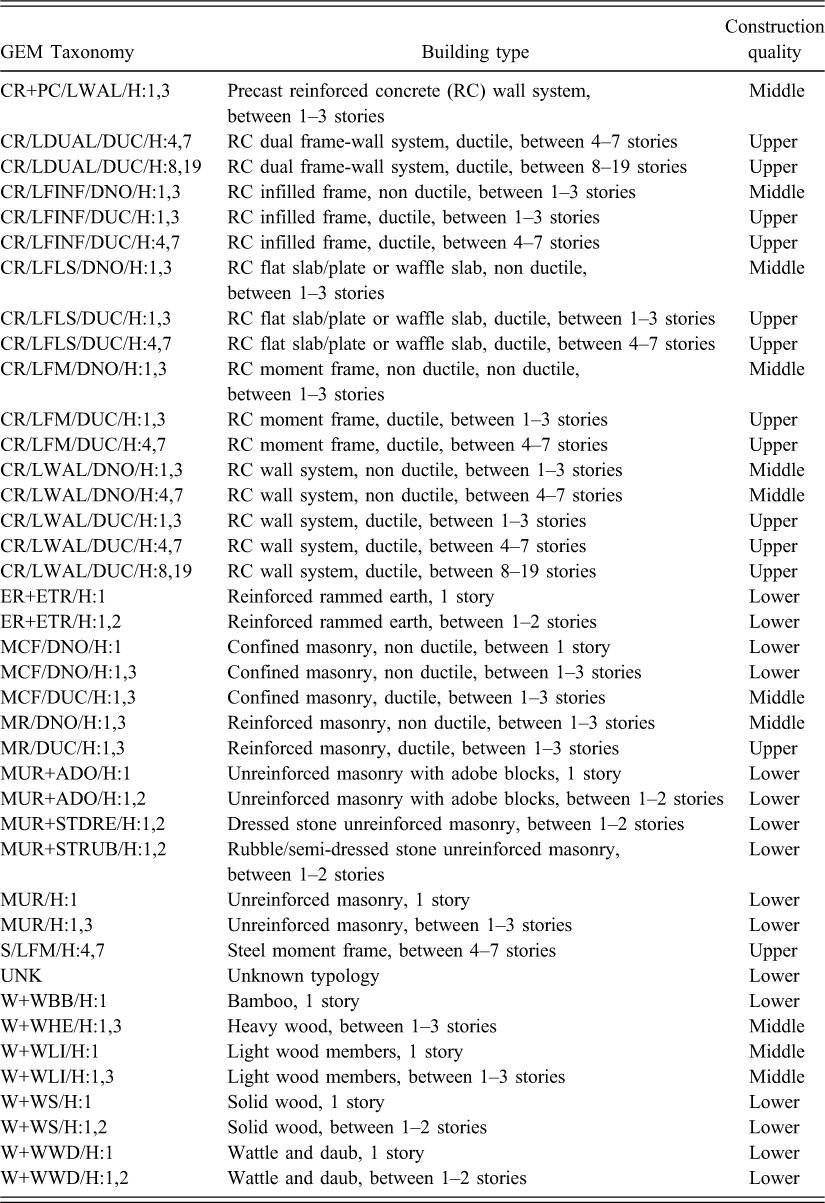
The definition of the building classes was performed using the GEM building taxonomy (Brzev et al. 2013), a uniform and comprehensive classification system developed to characterize buildings according to a number of attributes. Users can explore the GEM building taxonomy through a Web tool available at https://platform.openquake.org/taxtweb/. For the present study, only the construction material, the structural type of the lateral load resisting system, the ductility level and the range of number of stories were used to classify the building stock, as described in Table 2. There are certainly other parameters that could have been considered, such structural irregularities or type of foundation, but the available information did not allow including these features. For the classification presented in Table 2, it was assumed that the following building classes are nonductile: all types of unreinforced masonry (MUR, MUR+ADO and MUR+STRUB/STDRE); cane material or bamboo (WBB); tapia (or tapial, earthen construction; ER/ETR); and Bahareque and Quincha (WWD, wattle and daub construction).
Building classes used in the inventory
Mapping Census Data to Building Classes
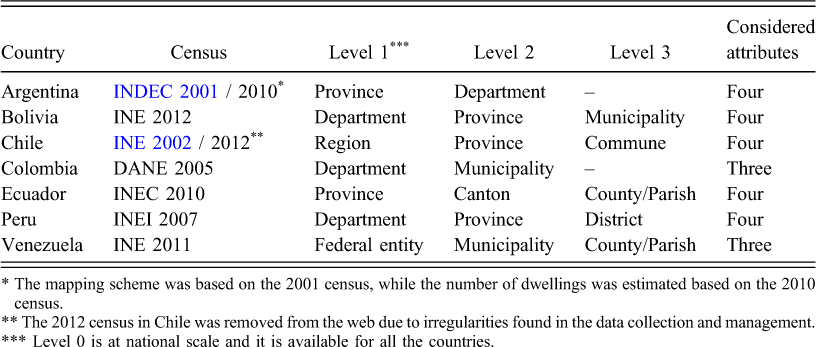
Population and housing statistics usually provide information regarding number of dwellings and its attributes (see Table 3) and not the number of buildings or building classes. Moreover, the information that is used to describe each dwelling in the census varies across the different countries, and may not cover all the features required to characterize a structure according to its seismic performance.
Dwellings and population data available in South American housing census databases
The mapping scheme was based on the 2001 census, while the number of dwellings was estimated based on the 2010 census.
The 2012 census in Chile was removed from the web due to irregularities found in the data collection and management.
Level 0 is at national scale and it is available for all the countries.
In this study, the source of information for the number of dwellings was the latest census survey for each country. A summary of the available data for the different administrative levels is presented in Table 3. The following attributes were used to assign a building class to the different dwellings identified in the census: (1) predominant material of the exterior walls, (2) material of the floor, (3) type of dwelling, and (4) type of area (urban or rural). None of the surveys included information about the number of stories, nor the lateral load resisting system, and only the housing census data from Venezuela made reference to the year of construction. The reason for using four attributes was due to the possibility to use disaggregated data from the databases of each country. For Colombia and Venezuela, the type of dwelling was not included because disaggregation of data was only available for a maximum of three attributes.
After analyzing the available information in the census surveys, it became clear that certain categories could be associated to more than one of the building classes presented in Table 2. For example, dwellings whose predominant exterior wall material was defined as clay bricks could be assigned to reinforced concrete moment-frame, confined masonry or unreinforced wall masonry structures. Moreover, these classes could be further divided based on the number of stories and level of ductility. Thus, it was necessary to establish a relationship between the attributes used in the census data, and the list of building classes. This relationship is herein named as a mapping scheme.
The proposed mapping schemes were estimated based on information collected in the aforementioned regional workshops and the judgment of more than 20 local experts. The authors and the local experts proposed mapping schemes for their countries of expertise, which was later compared and homogenized. As a result, for each country, two mapping schemes were produced: one for urban areas and one for rural areas. These mapping schemes (one per country) are publicly available at the SARA wiki.
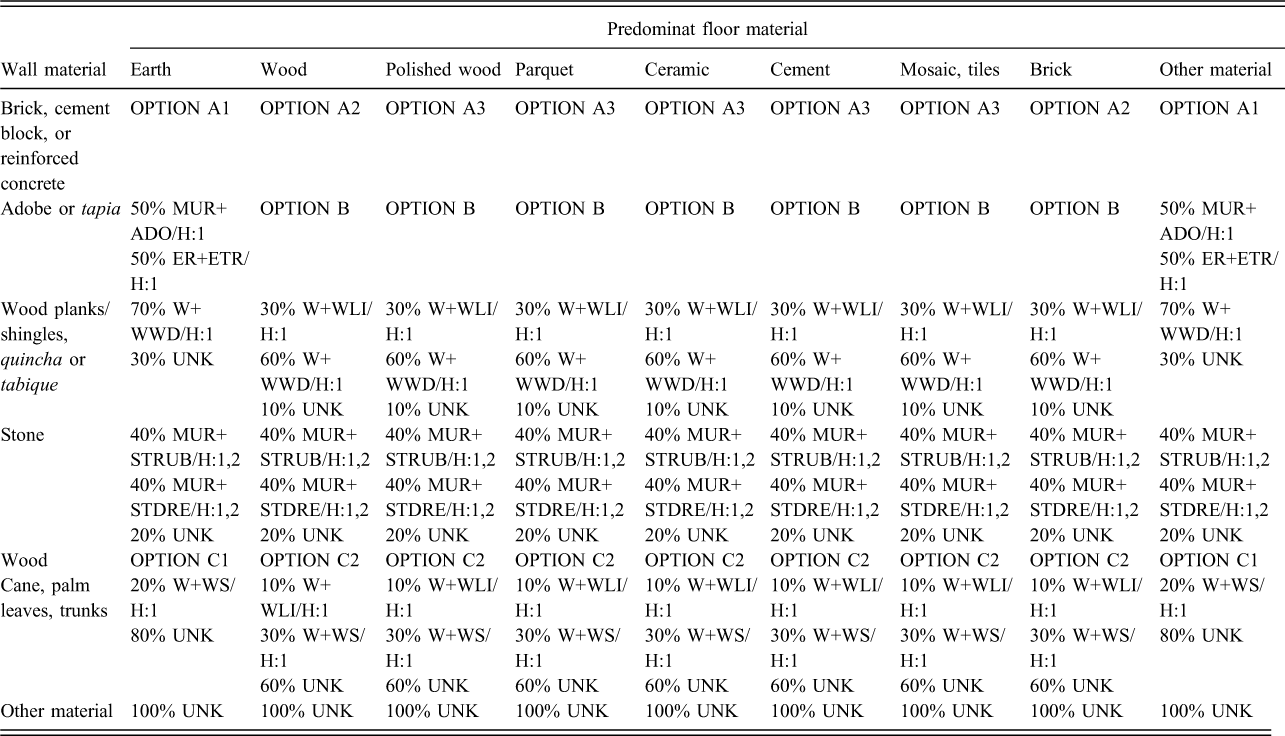
The following tables depict an example of the mapping scheme for dwellings in urban areas in Bolivia. Each mapping scheme consists of two tables: the first table (Table 4) assigns an initial building group according to the material of the exterior walls and the material of the floor. Then, the second table (Table 5) assigns the dwelling fractions according to the initial building group and the type of dwelling. The number of dwellings per building class is calculated by multiplying the quantity defined in the census by the associated dwelling fraction, at each geographical scale.
Mapping scheme for dwellings in urban areas in Bolivia. Mapping exterior wall material and material of the floor
Mapping scheme for dwellings in urban areas in Bolivia. Mapping by wall and floor material with type of dwelling
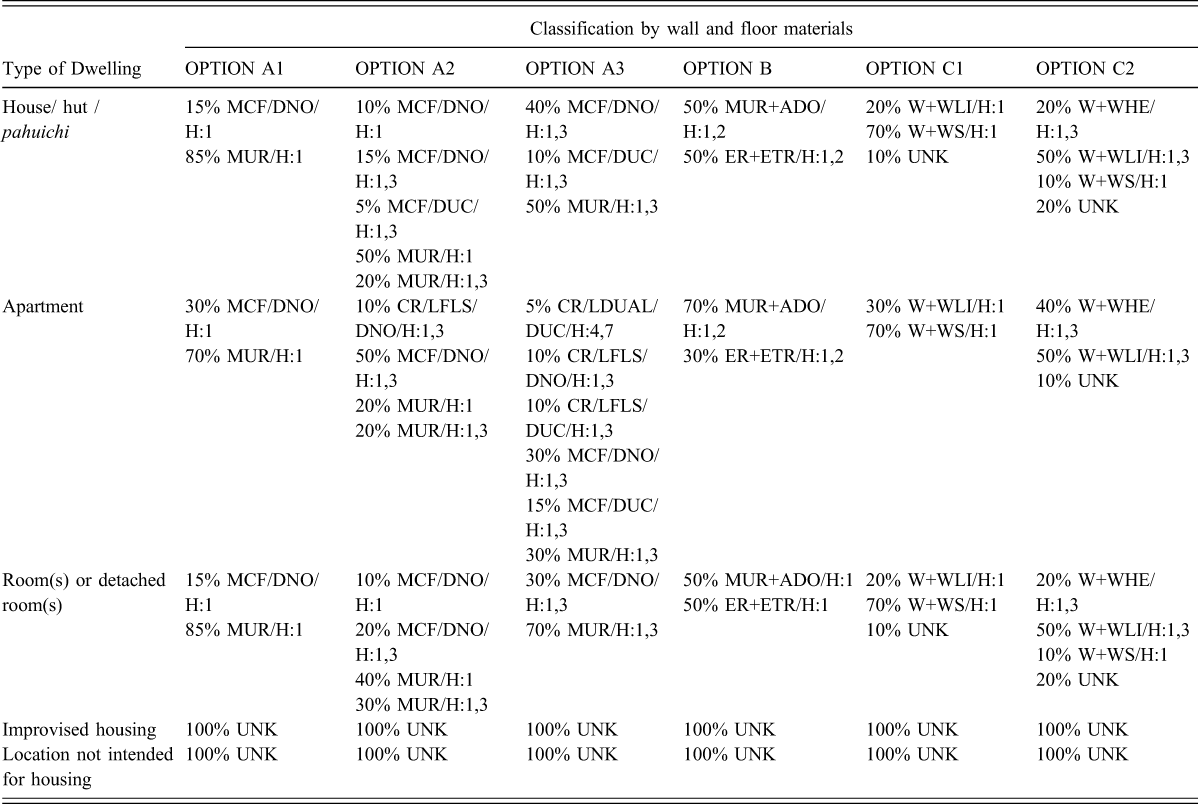
In some cases, the first table (Table 4) is sufficient to classify the dwellings into a building class. For example, dwellings with stone exterior walls in Table 4 were classified as stone construction, by assigning fractions of 40% MUR+STRUB/H:1,2; 40% MUR+STDRE/H:1,2; and 20% UNK. If the dwelling fractions are defined solely based on the first table, it means that their classification is independent of the type of dwellings (house, apartment, etc.). Moreover, for the cases of Colombia and Venezuela, it was not possible to build the second table due to the lack of data concerning the type of dwelling.
Mapping Dwellings to Building
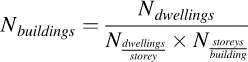
As previously mentioned, the available data from the national census includes the number of dwellings and not the number of buildings. Whilst the former is useful to estimate the total built-up area or replacement cost of a given type of construction, it does not allow calculating the amount of buildings in a given damage state (e.g., slight damage, moderate damage, collapse) for a specific seismic event. Thus, the information of the present model was used to calculate the number of buildings, dividing the number of dwellings by the average number of dwellings per story and by the average number of stories per building (see Table 6), as represented in the following expression:
Average number of stories and average number of dwellings per story
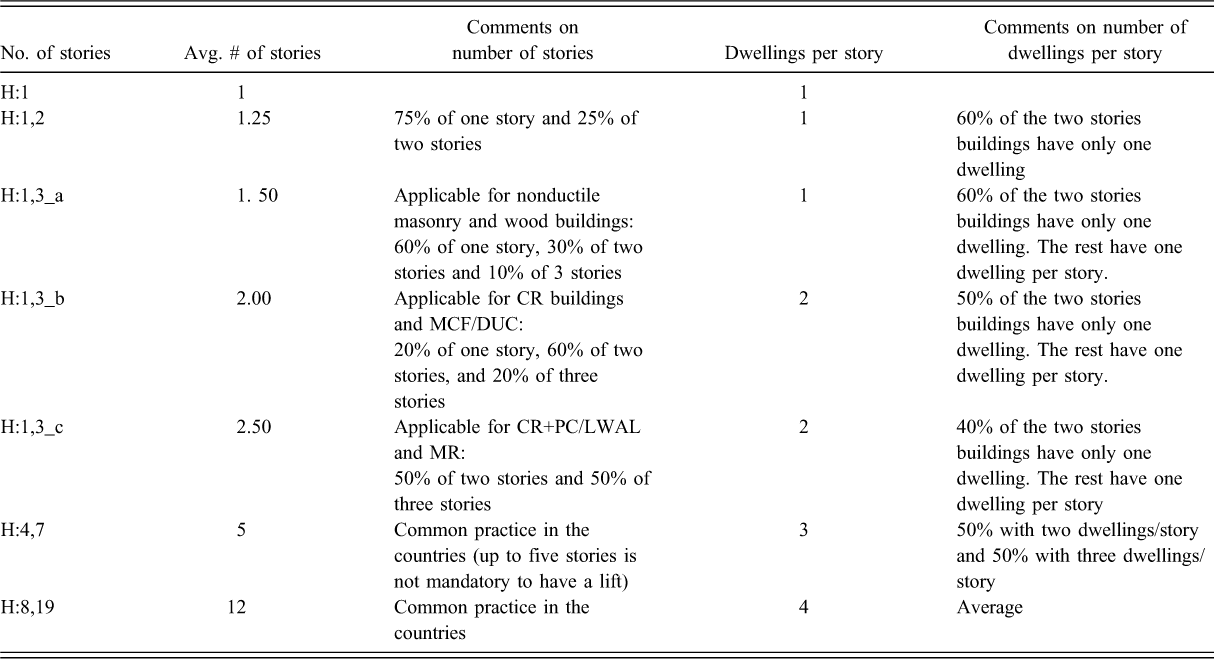
In the previous section the dwellings were categorized on several building classes that included the range of number of stories. Expert judgment was utilized in order to define the average number of stories per class and the average number of dwellings per story. Table 6 presents a summary of the proposed values, which were defined after analyzing the typical construction practice in the region, as well as information available in GED. The average number of dwellings per building depends on the type of area where the building is located: urban or rural.
Estimation of Replacement Cost
The final step to complete the exposure model is the estimation of the replacement cost per building type. In this context, the replacement cost refers to the value of replacing a building in accordance with the latest building standards applicable for the country, and it includes the cost of the structural and nonstructural components (but not the cost of the land). For example, in the case of an unreinforced masonry house, the replacement cost will be the value of building a confined or reinforced masonry structure at the present time, as current seismic codes do not allow the construction of unreinforced masonry due to its poor seismic performance.
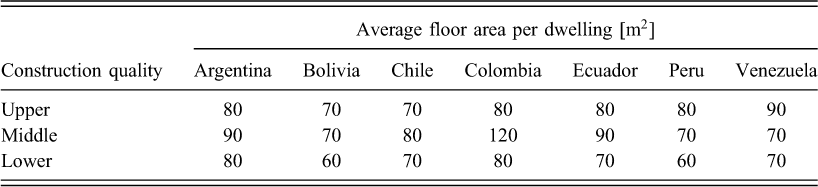
Since construction costs are commonly found per square meters of dwelling, the average floor area per dwelling type is required. In this case, instead of assigning an average area to each building class, three qualitative categories were selected depending on the construction quality (see Table 3): upper, middle, and lower. Each building class was related to one of these categories, considering that lower quality refers to informal construction (following no code regulations), upper quality refers to ductile structures with seismic provisions, and middle quality refers to formal structures that do not meet the necessary specifications to be considered ductile. The same methodology was employed to define the structural replacement cost.
Table 7 and Table 8 present the values utilized in the model, which were estimated base on reference values available in the WHE housing reports (WHE 2014) and the judgment of local experts provided through the authors of this study. Moreover, the final results were also discussed at the May 2015 workshop in Lima (Peru). A unique national value was proposed for each country, which is a rough approximation considering that within a country the replacement cost varies considerably from region to region, or from urban to rural areas. Nonetheless, a decision was made to assume a constant value across the country until additional information becomes available.
Reference average area per dwelling
Reference replacement cost per built area
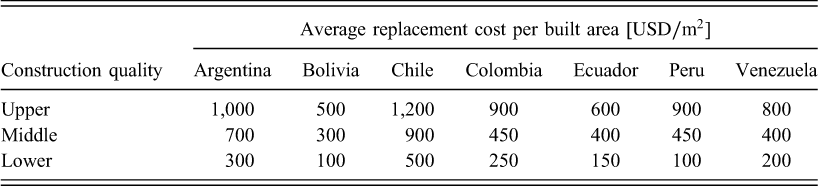
Given that each country has its own currency, the U.S. dollar was selected as the reference currency in order to homogenize and compare values among countries. In particular, the reference cost values presented in Table 7 for Venezuela and Argentina may vary considerably in the near future, since these nations currently have significant inflation, and official exchange rates are far from the real situation within the countries.
Results
An exposure model for the seven Andean countries of South America has been created, and it contains the number of dwellings, the number of buildings, the building class, the average built-up area, the replacement cost and population at different geographical scales, considering the corresponding type of area: urban or rural.
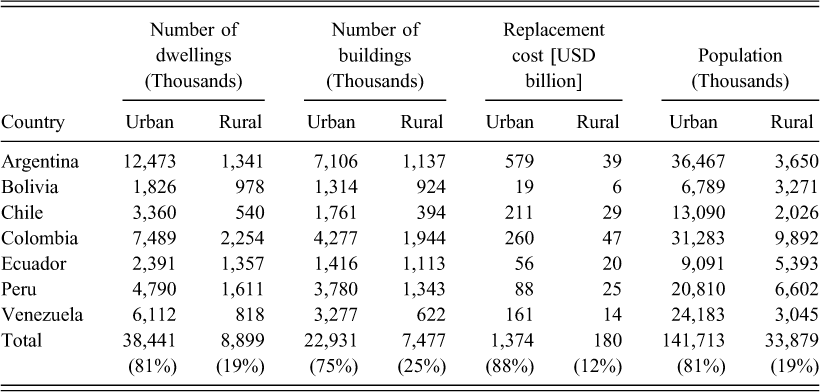
The number of dwellings in the Andean countries has been estimated as 47.34 million units, which correspond to 30.4 million buildings, with a built-up area of 3,621 million square meters, a total replacement cost of US$1,554 billion, and 175.6 million inhabitants. Table 9 and Figure 2 present a summary of the regional results.
Summary of building inventory for the Andean Region in accordance with census data
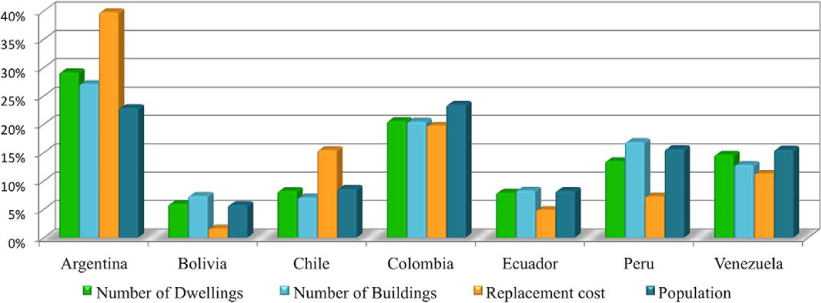
Distribution of the building inventory in the Andean Region.
Table 9 indicates that population and dwellings in South America are mostly concentrated in urban areas (81% of the residential building stock); while rural construction only represents 12.5% of the replacement cost in the region. From Figure 2, it can be observed that the number of dwellings and buildings from Argentina, Chile and Colombia represent 56% of the region, while the replacement cost accounts for almost 80% of the total portfolio. Moreover, around 15% of buildings are located in Bolivia and Ecuador, but they only represent 4% of the total replacement cost.
Regarding building classes and construction materials in the Andean region (see Figure 3), masonry construction represents 55% of the entire portfolio (unreinforced, confined and reinforced masonry account for 31%, 22% and 2% of the building stock, respectively), followed by 17% of reinforced concrete buildings (14% are moment frames with or without infill walls and 3% are dual or wall systems), 13% are earth/adobe houses (mostly concentrated in Bolivia and Peru) and 8% are wooden structures (mostly concentrated in Chile). The remaining 7% is distributed amongst steel, stone and unknown building classes (1%, 2%, and 4%, respectively).
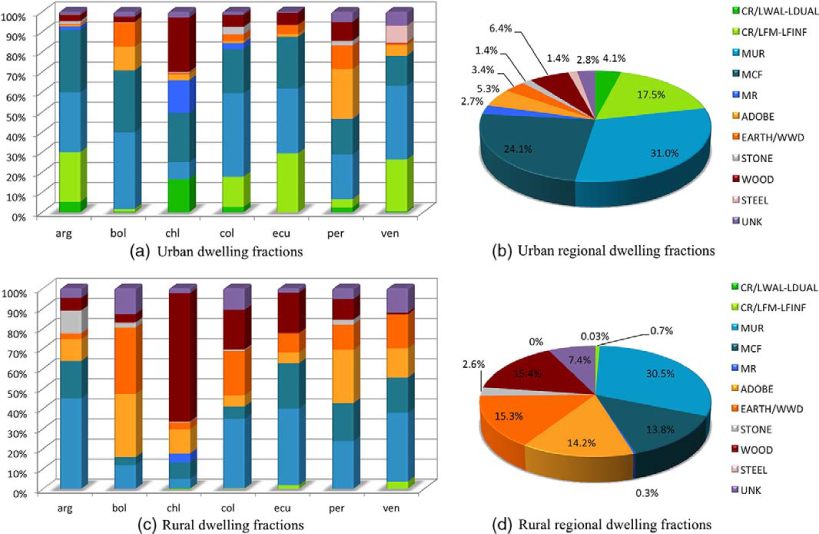
Predominant construction materials in the Andean countries.
Dwelling fractions change considerably from country to country, as well as on the type of area (urban or rural). Figure 3a illustrates the predominant urban dwelling fractions in each country, while Figure 3b presents the aggregated urban fractions at regional level. Figure 3c and 3d depicts the same results but for rural areas. It is important to understand that the results presented in these figures have been aggregated into a number of macro building classes for the sake of clarity.
Concerning the spatial distribution of the exposure model, Figure 4a presents the number of dwellings, buildings and replacement cost in each country, with pie charts displaying the national dwelling fractions (urban and rural). Figure 4b presents the distribution of dwelling at the first administrative level, and Figure 4c and 4d depict the distribution of buildings at different geographical scales for Colombia (second administrative level) and Peru (third administrative level). These types of maps, with the corresponding metadata, are available for every country at the SARA wiki.
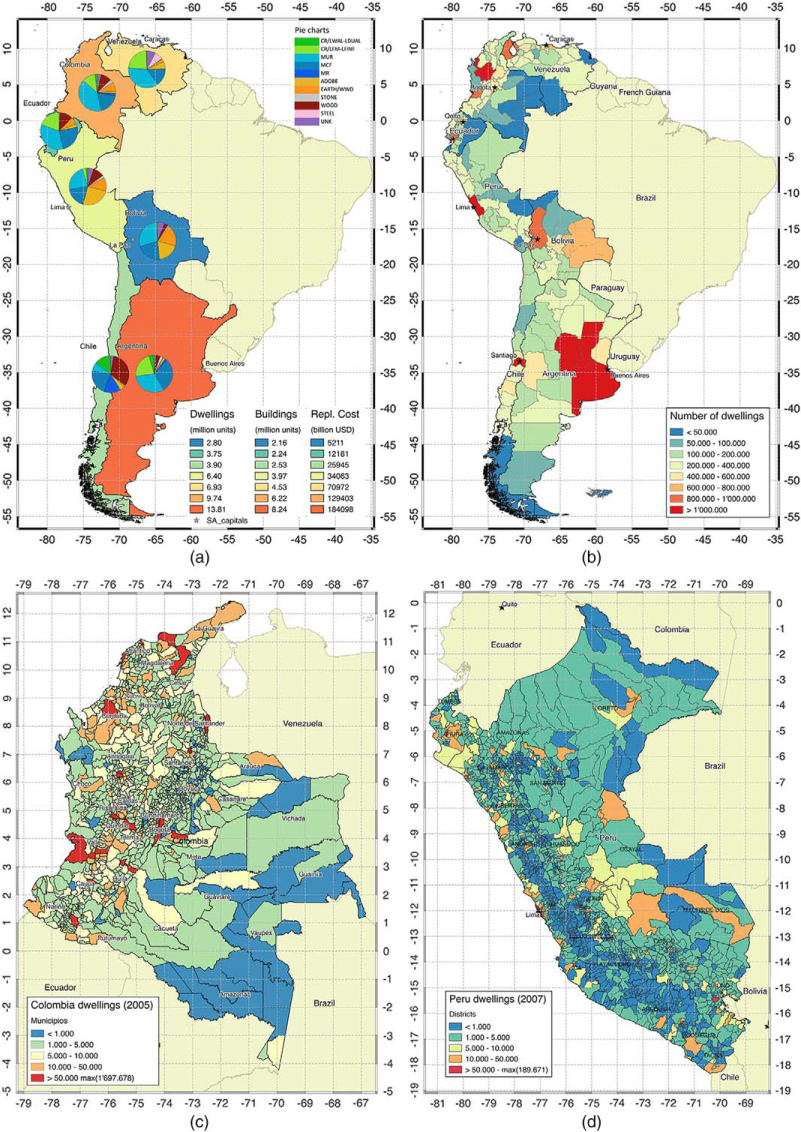
Residential building inventory in South America. (a) number of dwelling in the Andean countries with pie charts indicating the dwelling fractions; (b) number of dwellings in the Andean countries at the first administrative level; (c) number of dwellings in Colombia at the second administrative level; and (d) number of dwellings in Peru at the third administrative level.
Two mapping schemes (for urban and rural areas) were used for each country, which is clearly an approximation since significant variations may exist across each nation. A refinement of the current mapping schemes would require collecting additional data or interacting with additional experts, which was beyond the scope and resources of this project. However, it is important to understand that despite the fact that the same mapping scheme was used, the main component influencing the final distribution of dwellings is the housing census data, which varies across each country. For this reason, the local structural characteristics (e.g., local construction practice, climate, average income) are implicitly accounted for. An example of this variation is provided for Argentina. Figure 5a shows the distribution of dwellings at the first administrative level (provinces), along with pie charts that indicate the simplified building fractions for each region. Figure 5b comprises three pie charts with dwelling fractions at the national level (top), for the province of Tierra del Fuego (middle), and for Guarani department (bottom). At the national level, the predominant construction materials are unconfined masonry, confined masonry, and concrete frames (31%, 30%, and 22%, respectively), whereas at provincial and departmental levels, the proportions vary considerably. For example, in Tierra del Fuego the percentage of dwellings in the wooden category is 33%, and in Guarani this percentage goes up to 58%, which are considerably different from the 4% observed at the national level.
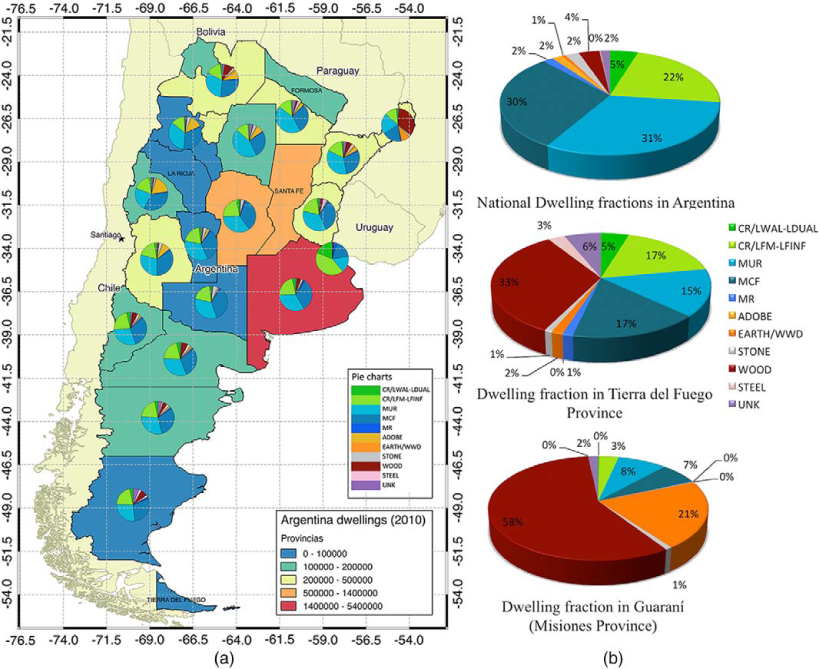
(a) Distribution of dwellings in Argentina at province level with pie charts indicating dwelling fractions, and (b) Pie charts for dwelling fractions at different geographical scales in Argentina.
Finally, trends in population for the Andean countries were also investigated based on census information (Table 3). Figure 6a presents the population distribution in the region with pie charts that indicate the proportion of dwellings in urban (light gray) and rural (dark gray) areas. Figure 6b depicts the spatial distribution of the population at the first administrative level. The average number of occupants per dwelling in the region is 3.8. Peru and Colombia have the largest average number of occupants (4.3 and 4.2, respectively), while Argentina and Bolivia have the lowest (2.9 and 3.6, respectively).
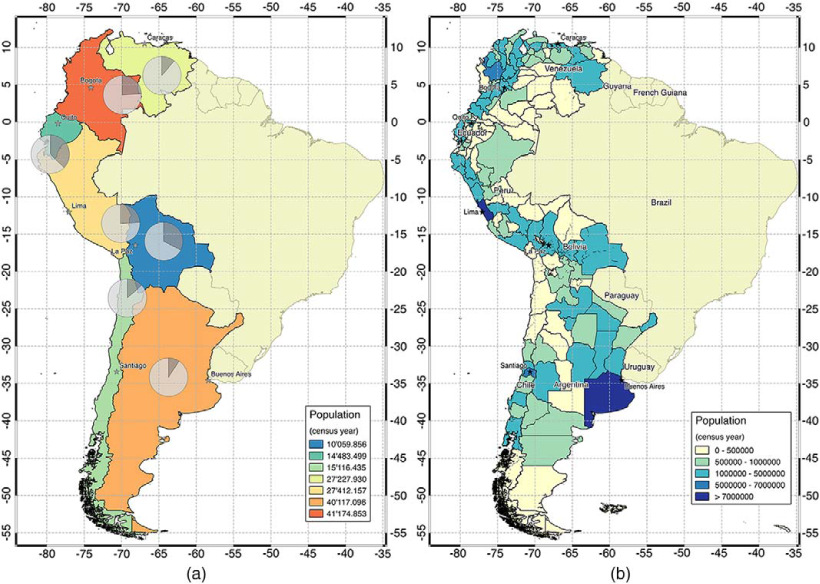
(a) Urban and rural population in the Andean countries and (b) population distribution at the first administrative level.
As previously mentioned, the Andean countries are characterized by a large urban concentration of population and buildings. In fact, it was found that 50% of the building stock is located in only 15 regions, as presented in Table 10. Census information, for some countries (Argentina, Colombia, Peru, and Venezuela), differentiates the number of dwellings in the capital city and/or metropolitan area with respect to the number of dwellings in the region.
Largest concentration of population and buildings in the Andean countries (first administrative level)
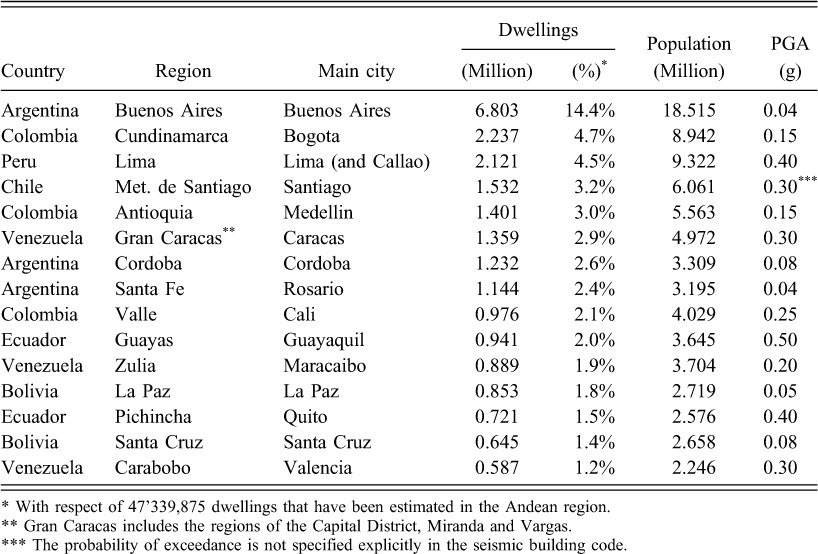
With respect of 47'339,875 dwellings that have been estimated in the Andean region.
Gran Caracas includes the regions of the Capital District, Miranda and Vargas.
The probability of exceedance is not specified explicitly in the seismic building code.
Moreover, Table 10 presents the peak ground acceleration (PGA) at the 10% probability of exceedance in 50 years (on bedrock) for the main cities in accordance with the latest hazard maps of the building codes. Most of the seismic regulations consider that PGA values larger than 0.25 g are related to high seismicity zones, which allocates the cities of Cali, Quito, Guayaquil, Lima, Santiago, Valencia and Caracas in the high seismic hazard category. These cities account for 17.4% of the total dwellings in the Andean countries. Similarly, low seismic zones are associated with PGA values lower than 0.10 g, which includes the regions from Argentina and Bolivia, representing approximately 22.6% of the total dwellings. The remaining cities in Table 10 are located in zones of intermediate seismic hazard.
Limitations and Caveats
The exposure model presented herein is an attempt to create a homogenized database of the residential building stock in South America. Future users of this model should be aware of its limitations and caveats. The main source of information in the development of this model was census data, whose quality and reliability varies considerably from country to country, and in some cases those are not updated on a regular basis. The data quality is directly related with the building identification expertise of surveyors and the appropriate training before performing the surveys. Moreover, the definition of the mapping schemes of each country was strongly influenced by the variables reported in the different census surveys, which again are country-specific. For example, one country has aggregated the information about material of exterior walls used in engineered construction into four categories (Colombia), while others considered ten different categories for this attribute (Venezuela), which allowed a reduction in the uncertainty in the definition of the mapping schemes. Special attention was given for the categories that described the material of the exterior walls as brick, blocks, concrete with or without plaster, as they are used to classify masonry and reinforced concrete building classes, which are the most representative typologies in the region.
Another caveat is related to the year when census surveys were conducted. The data used in this exposure model for each country varies from year 2002 to 2012, thus representing the status of the building stock at different times. The number and list of building classes could be extrapolated for the current date, but this process would add additional uncertainty in the resulting exposure model. For this reason, a decision was made to use the original data from the building census, and an extrapolation of these results to the current date may be performed by the users of the exposure model, should they require it.
Finally, it is relevant to emphasize that many parameters in the model were defined based on the judgment of several local experts (e.g., mapping schemes, average number of stories, average built-up area). Additional validation of these assumptions should be performed in order to improve the accuracy, objectiveness and reliability of the model. Finally, it is relevant to note that the replacement costs were defined at the national level.
Despite these limitations, the Authors are still confident that this model is a valuable contribution to international and local organizations with the mandate to perform seismic risk assessment. Furthermore, since the model is open and publicly available, any user can verify its results and modify or improve them accordingly.
Conclusions
A residential building inventory in South America has been developed, using as the main source of information national census surveys and expert judgment. The proposed methodology for estimating dwelling and building fractions is simple and flexible, and can be easily improved upon the availability of additional data and resources.
The proposed exposure model includes the aggregated number of dwellings and buildings at different geographical scales with the corresponding building class, average built-up area per dwelling, average number of dwellings per building, average structural replacement cost, and number of occupants. The present model is open and publicly available through the SARA wiki and the OpenQuake platform. This model will be continuously enhanced through collaboration with local experts and organizations that can provide additional data and recommendations.
As part of the SARA project, this exposure model was used to calculate probabilistic seismic risk (Yepes-Estrada et al. 2017), using a set of fragility functions (Villar-Vega et al. 2017) and a seismic hazard model also developed within this initiative. The calculations were performed using the OpenQuake-engine (Silva et al. 2014, Pagani et al. 2014), the open-source software for seismic hazard and risk analysis, and all of the results will be publicly released through the OpenQuake platform and the SARA wiki. Moreover, this exposure model can be used, to some extent, for risk assessment considering other type of hazards (i.e., tsunami, landslides, liquefaction and floods).
The exposure model can be utilized by organizations and individuals that are interested on assessing seismic risk in South America at different geographical levels (in a particular country, in a specific sub-region of the country, or even at a local level). However, it is worth mentioning that even if two regions of a given country share the same building class, it does not mean that the structure will respond in a similar manner under an earthquake. The seismic response and vulnerability of a building are strongly influenced by site conditions, the local construction practice and its quality, attributes that were neither included on national surveys, nor mentioned in the referenced studies. These characteristics should be addressed through the fragility or vulnerability models, in which appropriate functions should be found for each building class.
Footnotes
Acknowledgments
This work has been produced within the South America integrated Risk Assessment project, with the financial support of SwissRe Foundation. This manuscript is the result of a collaborative effort. The Authors appreciate the contribution from local experts involved in the SARA project, as well as the support from the Centro Nacional de Estimación, Prevención y Reducción de Riesgos de Desastres (CENEPRED), Centro Nacional de Investigación para la Gestión Integrada de Desastres Naturales (CIGIDEN), Fundación Venezolana de Investigaciones Sismológicas (FUNVISIS), EAFIT University, and Seguros Generales Suramericana.