
Abstract
The industrial trials of N2 injection and nitrogen-containing alloy addition for increasing the nitrogen content in molten steel were carried out on a 300 t ladle Ruhrstahl–Heraeus (RH) treatment. The effects of the order of N2 injection and alloy addition, as well as vacuum chamber pressure on the nitrogen dissolution rate of the molten steel were investigated. A nitrogen dissolution model for N2 injection of RH was established and the predicted result was in good agreement with the measured. The equilibrium [N] contents corresponding to pressure of 7.5–8.5 kPa, 3.0–4.0 kPa and <0.1 kPa were 160–170 ppm, 110–130 ppm and 90–100 ppm, respectively. The [N] content increase rate was slow with only N2 injection, and the [N] content was not further increased after reaching the equilibrium. The [N] content increase rate was fast with nitrogen-containing alloy addition, while the [N] content rapidly rised to a supersaturation state if the amount of nitrogen brought in by the alloy exceeded the nitrogen equilibrium. Thereafter, the [N] content decreased to near the equilibrium value. The nitrogen-containing alloy addition led to a deterioration of the cleanliness of molten steel, and the earlier addition of alloys had more time to remove the inclusions and to reduce the T.O content.
Introduction
Nitrogen is generally considered to be a harmful element in steel for its negative impact on the mechanical properties of steel. Numerous researches have focused on how to reduce the nitrogen content of molten steel.1–5 However, the development of nitrogen-containing steel makes the role of nitrogen in steel get more attention. Nitrogen as an alloying element is a powerful solid-solution strengthener and an austenite stabiliser, thereby improving the hardenability, strength, wear resistance, and corrosion resistance of the steel.6–10
Steels with different nitrogen content requirements have different methods of increasing nitrogen. For steel containing N ≥ 0.05% (high-nitrogen stainless steels, high-nitrogen tool steels, etc.), their manufacture are limited because of significant difficulties in reaching high nitrogen concentrations using the traditional metallurgical technologies. The main production process for these high-nitrogen steels are the powder metallurgy9–11 and the high-pressure melting.11–13
The maximum nitrogen content is below 0.05% in theory by the conventional steelmaking process with a non-pressurised atmosphere. Nitrogen absorption by the nitrogen-bearing gases14–19 and special alloy20,21 are the main methods in the conventional steelmaking process. The advantages of the nitrogen absorption by the special alloy are the stable nitrogen increase and simple operation. However, the production cost is high due to the special alloy, besides, the cleanliness of the molten steel is deteriorated by the oxides and impurities in the alloy. Nitrogen absorption by the nitrogen-bearing gases including the bottom blowing N216,17 and the top blowing O2–N2 mixed gas 18 during the converter process, as well as N2 blowing in the refining process. 19 The technique of the nitrogen absorption by N2 has the advantages of the lower cost and higher cleanliness, however, the nitrogen content is unstable and the nitrogen absorption rate is low.
Past research on nitrogen absorption focused on stainless steel. The current study addressed low carbon aluminium killed steel used for the production of food packaging can. Corrosion resistance and food safety limited the incorporation of common microalloyed strengthening elements such as Nb, V, Ti, etc. Therefore, nitrogen-containing tinplate was added with various contents (0.003%∼0.025%) of nitrogen to replace the micro-alloying strengthening elements, to improve the strength of the steel plate, and at the same time, to reduce the cost of alloying elements.
The Ruhrstahl–Heraeus (RH) process plays a key role for improving the steel cleanliness. During the RH treatment, the molten steel is circulated between the vacuum chamber and the ladle by reducing the vacuum chamber pressure and injecting inert gas into the up snorkel, so as to achieve the purpose of degassing and removing inclusions. Researches on nitrogen of molten in RH mainly focused on vacuum denitrogenation. The research on nitrogen absorption in RH was relatively rare. In the author's previous research, 22 the mechanism of nitrogen absorption of the molten steel by injecting N2 was studied during the RH vacuum refining process. However, it is difficult for the nitrogen content to reach above 0.012% by N2 injection alone. The combination of N2 injection and nitrogen-containing alloy addition is an inevitable way to produce steel with appropriate high nitrogen content by RH. In the current study, the industrial trials of N2 injection and Mn–N alloy (manganese–nitrogen alloy) addition for increasing the nitrogen content in molten steel were carried out on a 300 t ladle RH treatment. The effects of the order of N2 injection and Mn–N alloy addition, as well as vacuum chamber pressure on the nitrogen dissolution rate of the molten steel were investigated. In addition, the effect of the order of Mn–N alloy and N2 injection on the cleanliness of molten steel were studied together.
Industrial trial
Experimental method
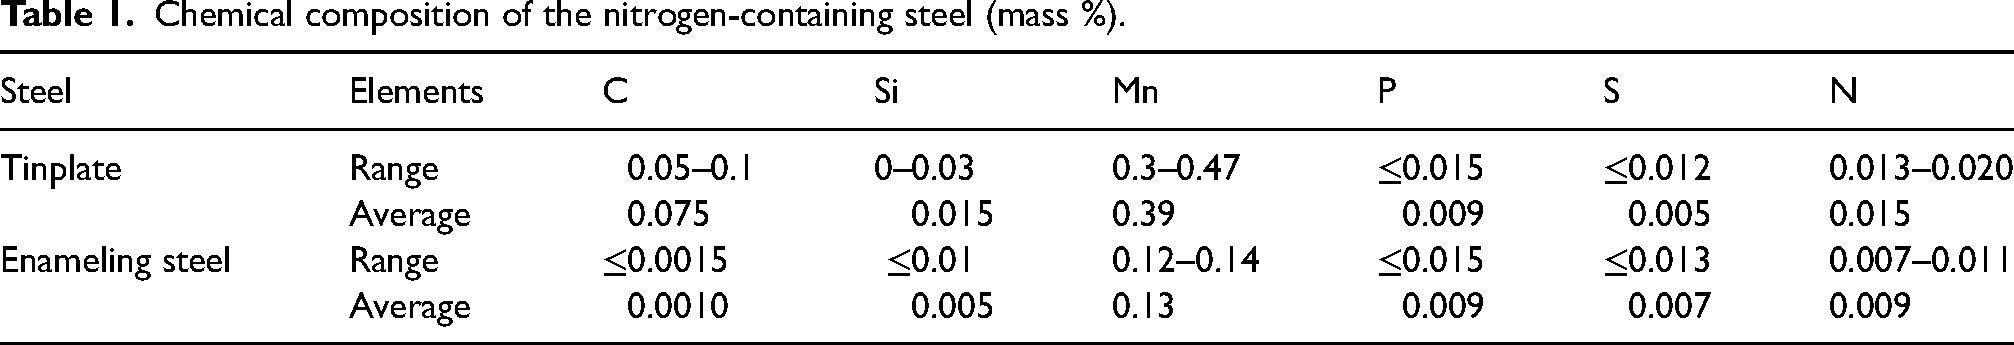
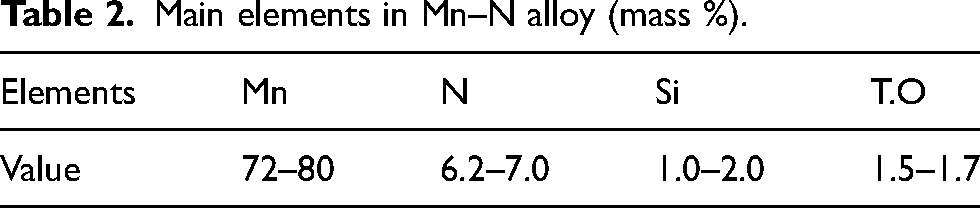
Trials were carried out on the low alloy nitrogen-containing steel, including tinplate and porcelain enamelling steel. The main chemical composition requirements and average value are listed in Table 1. The oxygen and nitrogen content of Mn–N alloy used in the trials is shown in Table 2.
Chemical composition of the nitrogen-containing steel (mass %).
Main elements in Mn–N alloy (mass %).
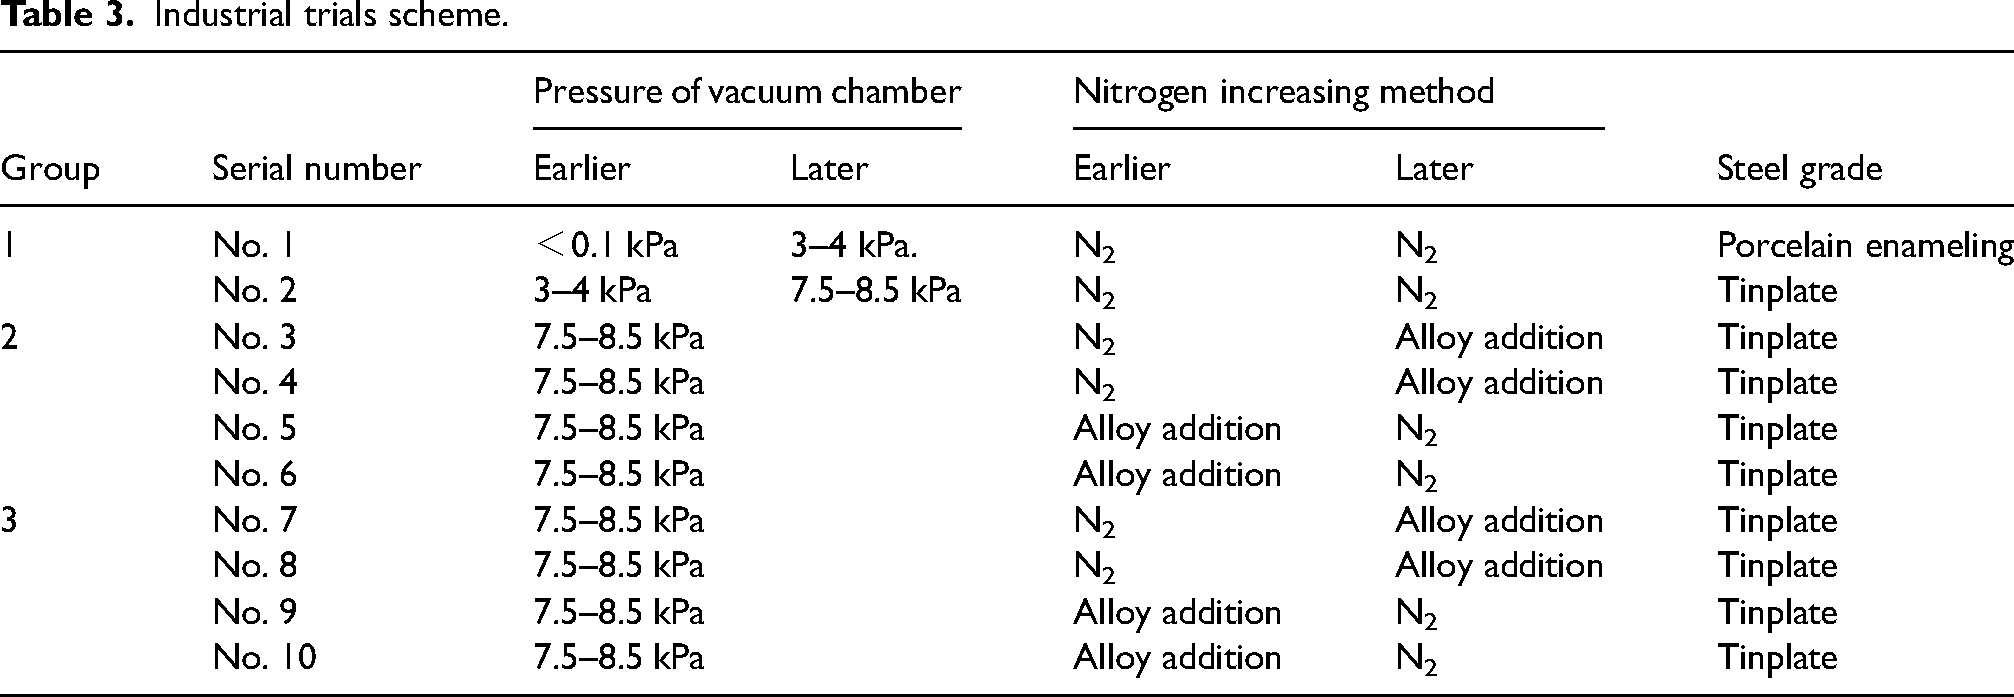
Industrial trials scheme is shown in Table 3. The trials were divided into three groups.
The first group included No. 1 and No. 2, to study the effect of vacuum chamber pressure on the nitrogen absorption rate. N2 was used in the whole process as lifting gas. The earlier vacuum chamber pressure of No. 1 was below 0.1 kPa which was near the limit vacuum degree, and increased to 3.0–4.0 kPa in the later stage. The vacuum chamber pressure of No. 2 was 3.0–4.0 kPa in the earlier stage and increased to 7.5–8.5 kPa in the later stage. Samples were taken at intervals of 1 to 2 min by using a round cake sampler. The second group included No. 3 to No. 6, to study the effect of the order of N2 injection and Mn–N alloy addition on nitrogen absorption rate. N2 was used in the whole process as lifting gas. Mn–N alloys were added in the later stage of RH in No. 3 and No. 4, while Mn–N alloys were added in the earlier stage of RH in No. 5 and No. 6. Samples were taken at intervals of 1 to 2 min by using a round cake sampler. The third group included No. 7 to No. 10, to study the effect of the order of N2 injection and Mn–N alloy addition on the cleanliness of molten steel. Mn–N alloys were added in the later stage of RH in No. 7 and No. 8, while Mn–N alloys were added in the earlier stage of RH in No. 9 and No. 10. Samples were taken at intervals of 5 min by using a bucket sampler.
Industrial trials scheme.
Sampling and analysis methods
Figure 1 shows a nitrogen-containing steel production process and the sampling method. The manufacture route is KR(hot metal desulfurisation)–BOF(oxygen blowing in converter for decarbonisation and dephosphorisation)–RH(RH reactor for degassing and removal of inclusions)–CC(continuously casting). The trials were carried out on 300t refining RH process. N2 was used as the lifting gas and the flow rate was 3000 NL/min. The temperature of molten steel is 1853∼1893 K during the experiment. The content of [N] and T.O in molten steel samples was analyzed by oxygen and nitrogen analyzer.
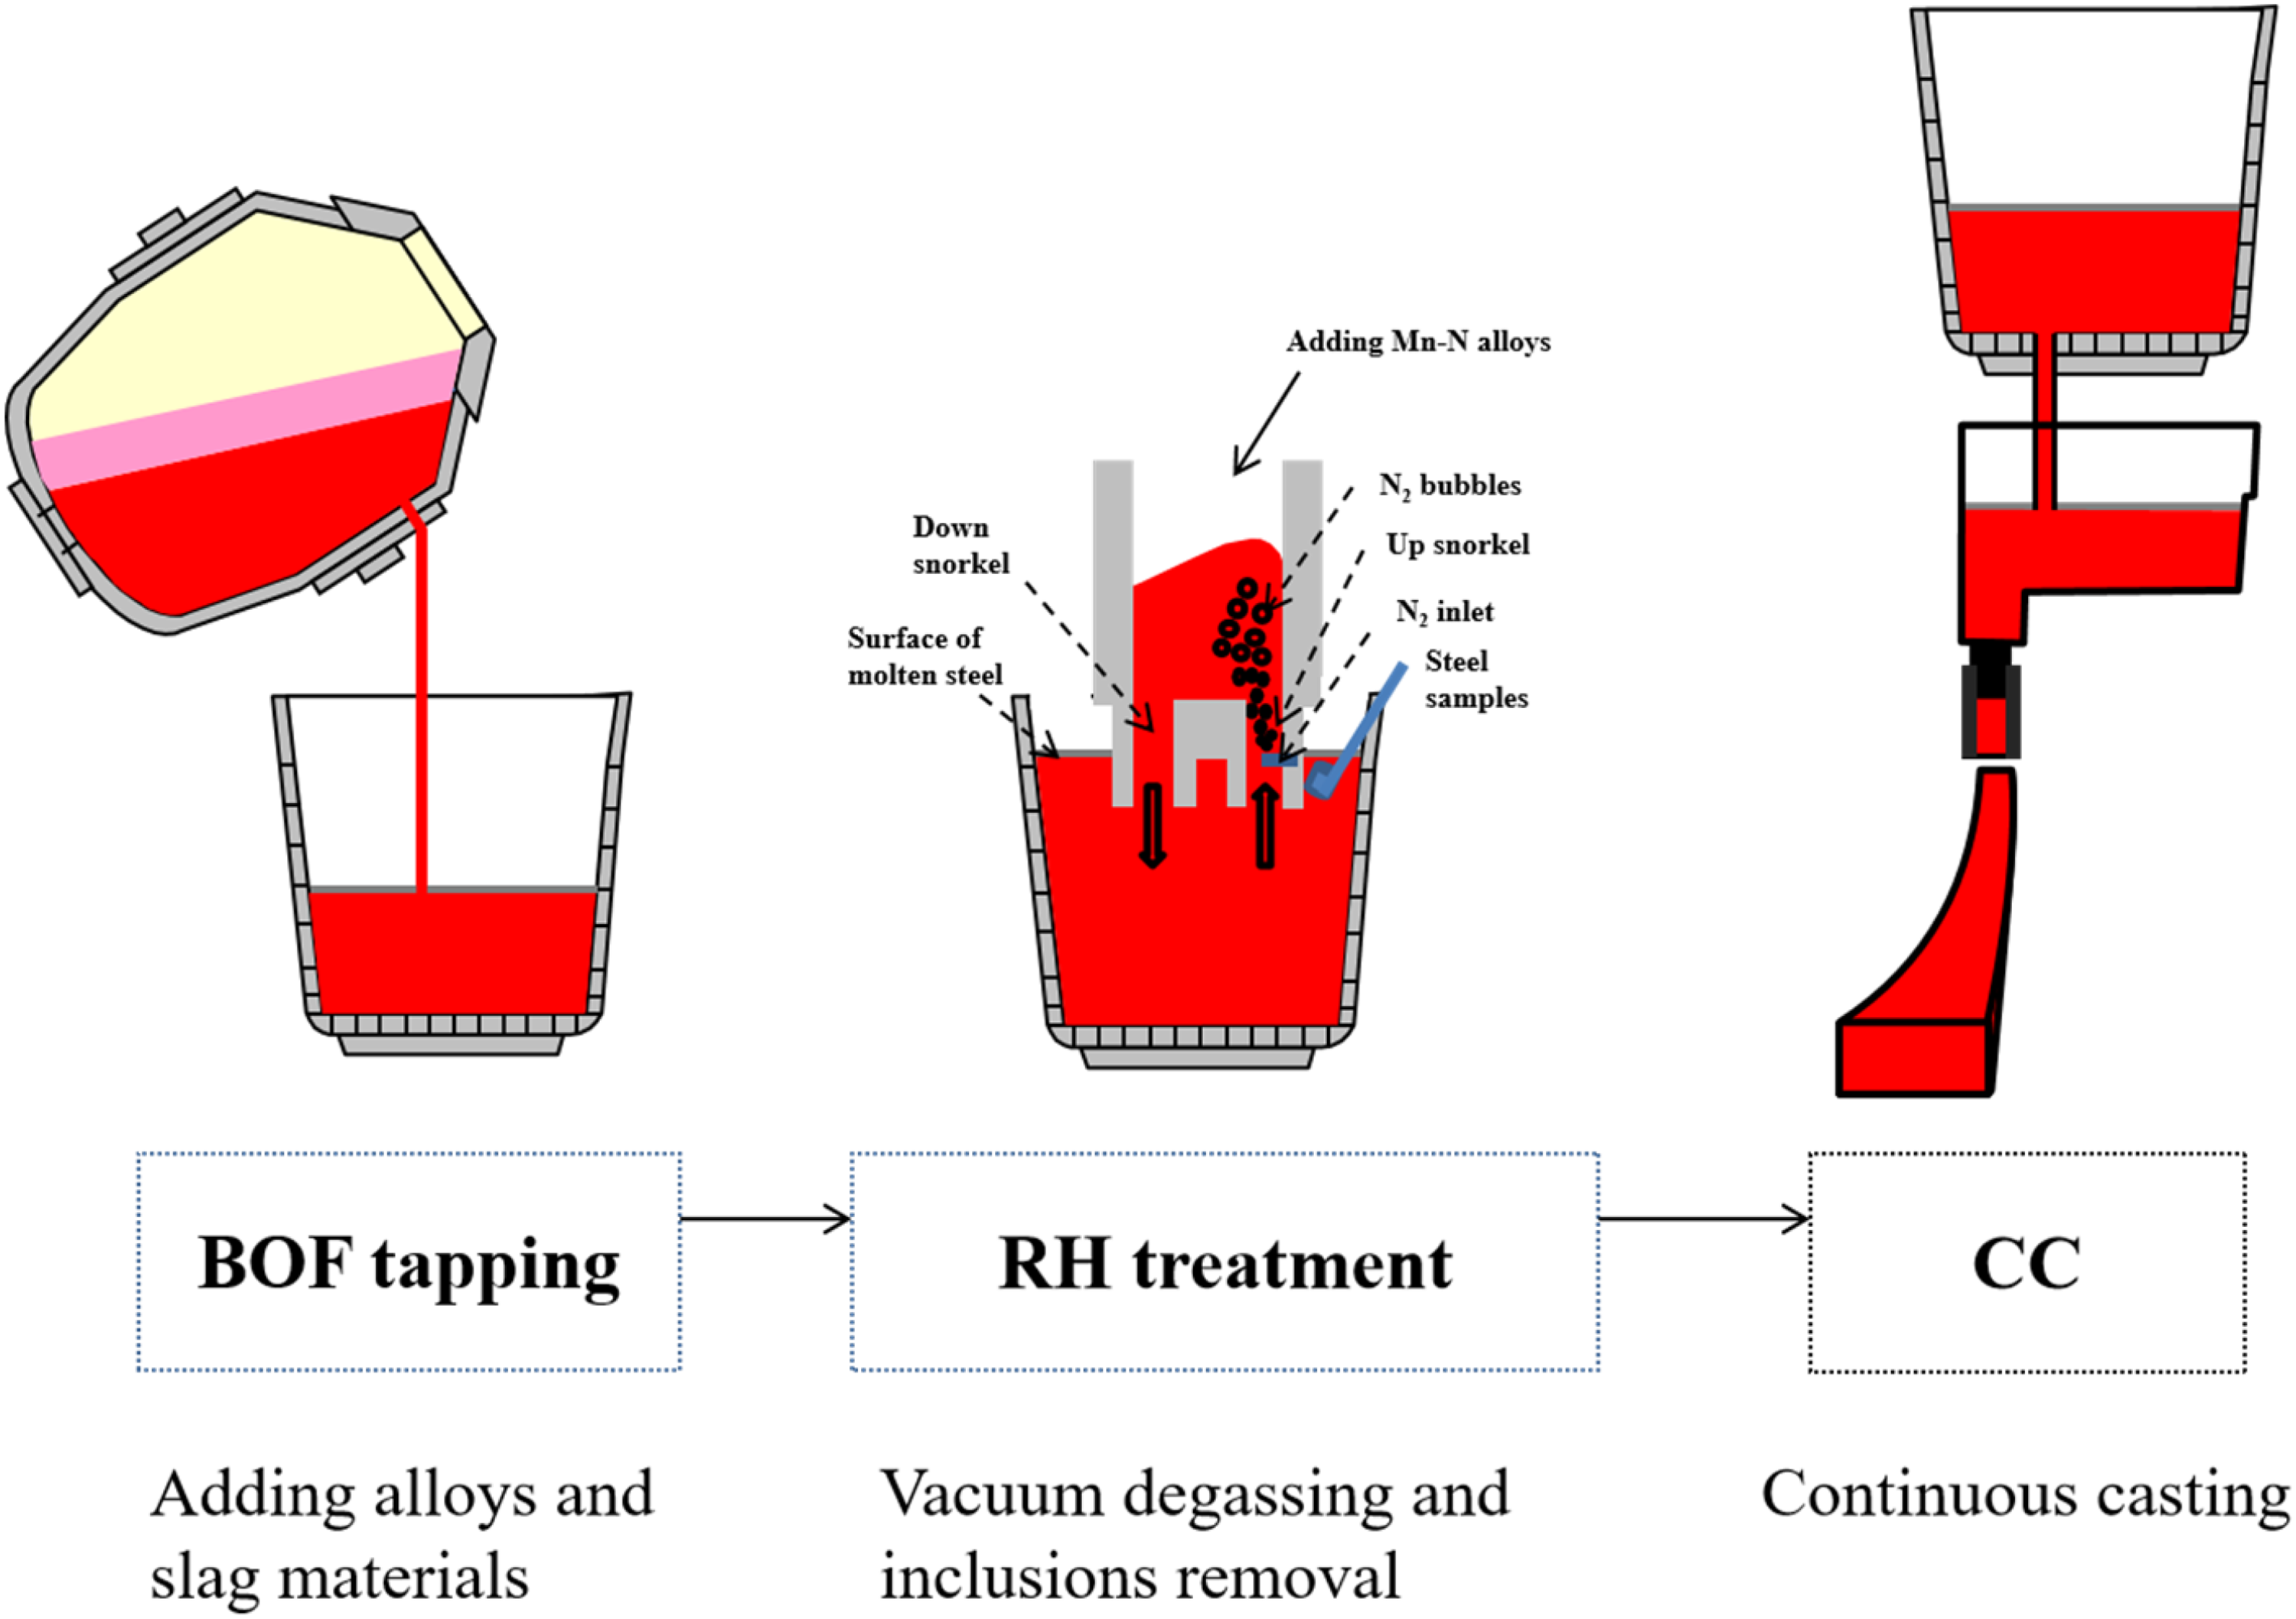
Schematic of nitrogen-containing steel production process and the sampling method.
Experimental results
Figure 2 shows the variation of nitrogen content in molten steel from No. 1 to No. 6. In No. 1 and No. 2, the initial [N] content of molten steel was about 100 ppm when Mn–N alloy was added during BOF tapping. In No. 1, the [N] content was maintained about 90–100 ppm at a pressure below 0.1 kPa although N2 was blown throughout, and the [N] content began to rise after the pressure rised to 3.0–4.0 kPa. Similarly in No. 2, the [N] content was maintained about 110–120 ppm at the pressure of 3.0–4.0 kPa, and the [N] content began to rise after the pressure rised to 7.5–8.5 kPa.
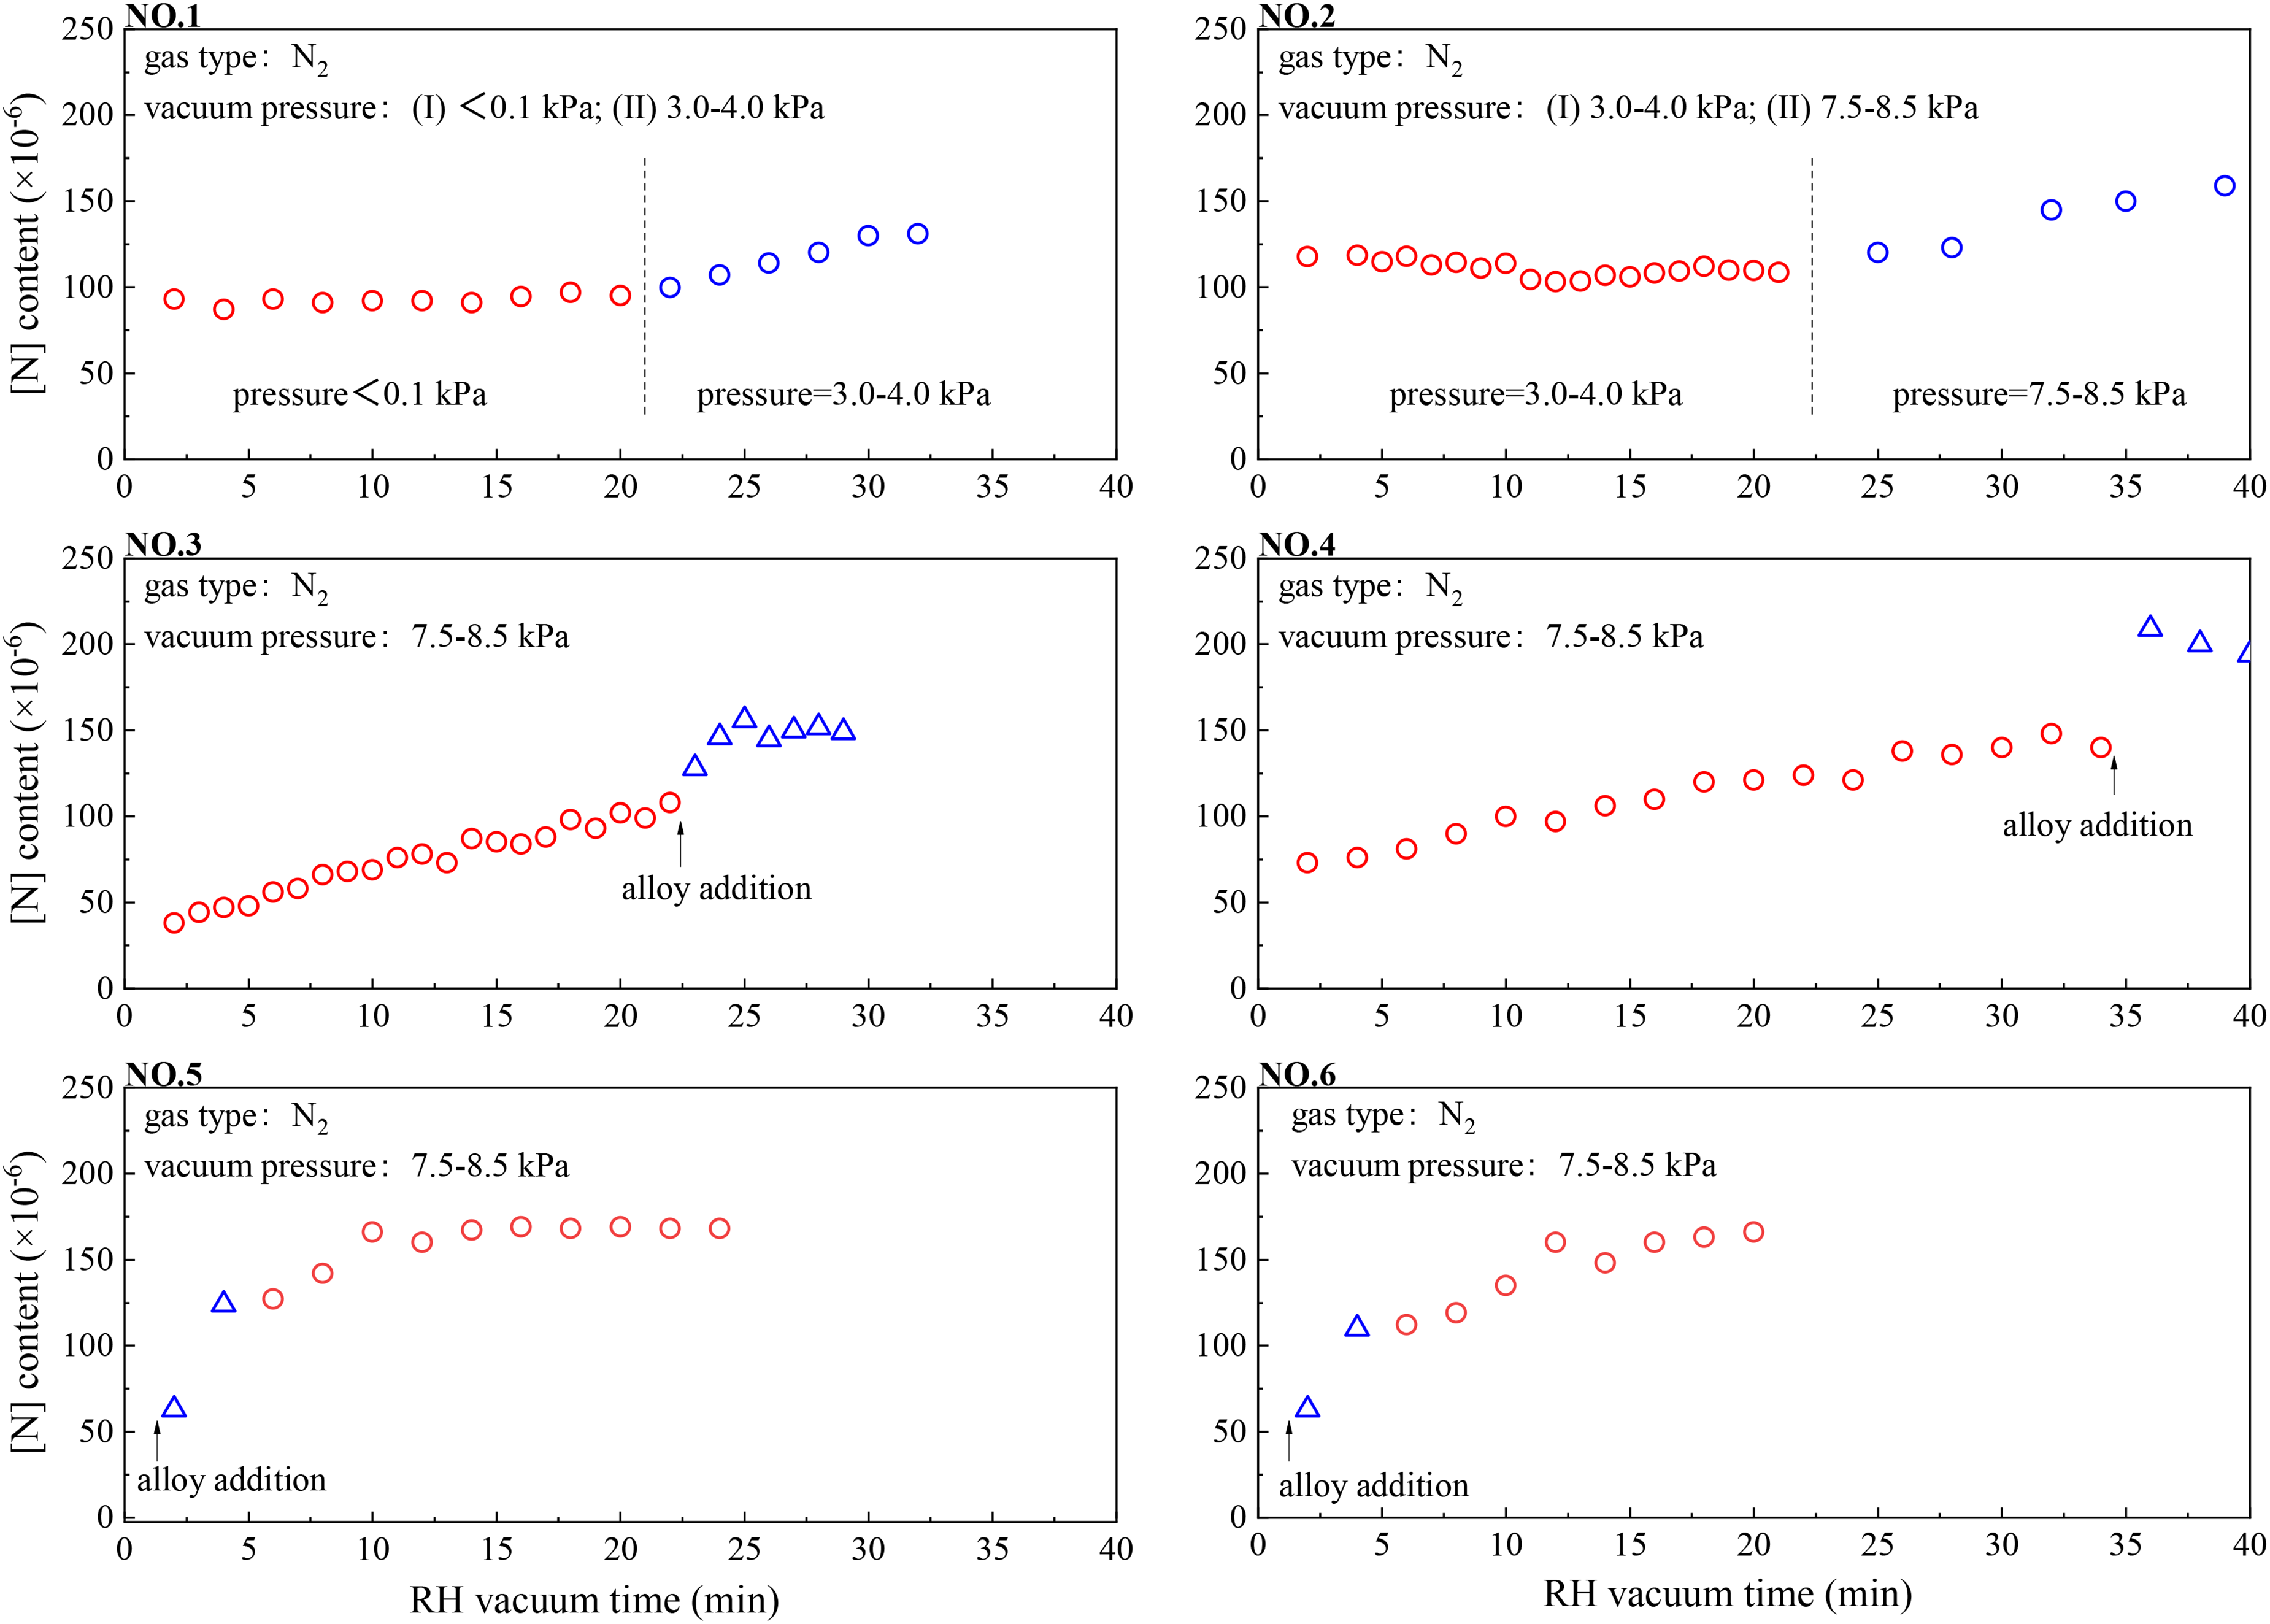
Variation of the [N] content in molten steel in the trials of No. 1–No. 6.
In No. 3 and No. 4, the [N] content increased slowly by N2 injection at the earlier stage and increased rapidly by alloy nitrogen-containing addition at the later stage. Interestingly, after adding alloy in the later stage, the [N] content gradually decreased after a rapid increase. Inversely, In No. 5 and No. 6, the [N] content in molten steel increased rapidly after alloy addition at the earlier stage of RH treatment. The [N] content in molten steel increased slowly and reached a stable range after N2 injection at the later stage.
Figure 3 shows the variation of the [N] and T.O content in molten steel in trials of No. 7–No. 10. In No. 7 and No. 8, the variation of nitrogen content was the same as that of No. 3 and No. 4. The T.O content decreased at initial stage, while it increased after the addition of Mn–N alloy. In No. 9 and No. 10, the variation of nitrogen content was the same as that of No. 5 and No. 6. The T.O content continued to decrease.
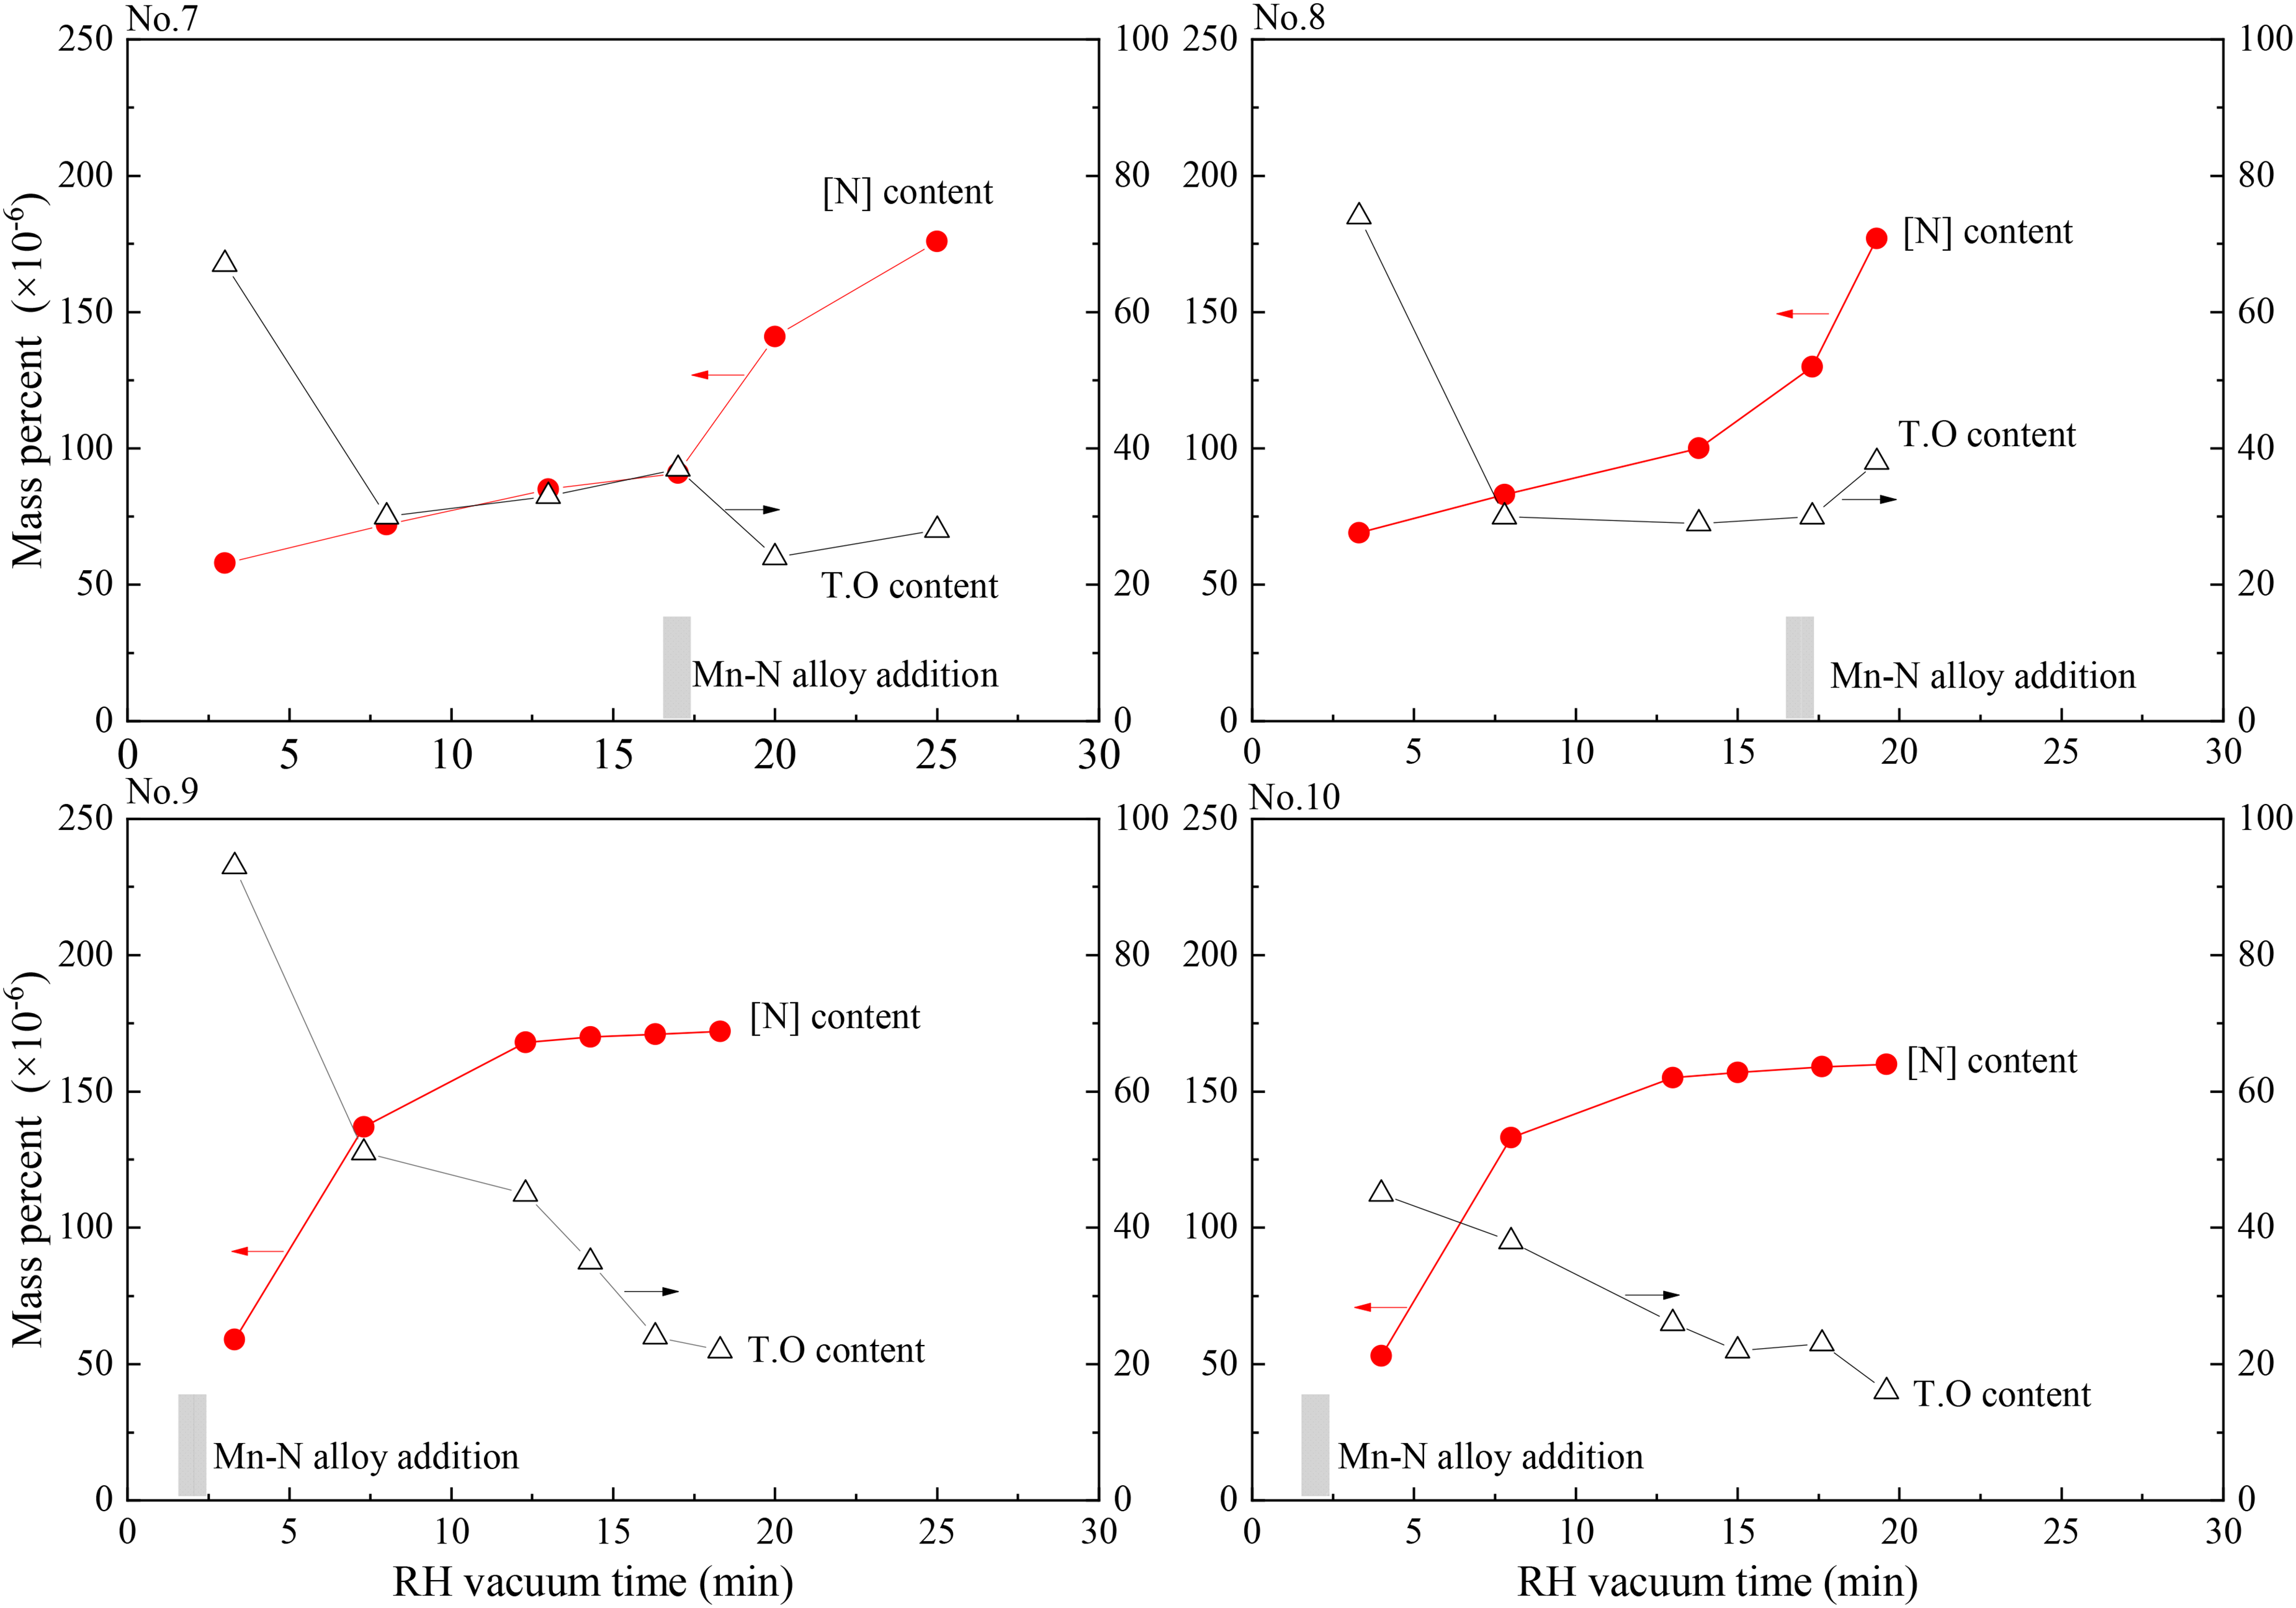
Variation of the [N] and T.O content in molten steel in trials of No. 7–No. 10.
Discussion
Nitrogen dissolution model
Figure 4 shows the schematic of the dissolution process of N2 into the molten steel. The reaction for nitrogen dissolution into the molten steel is divided into the three steps which are described by equations (1–3). (1) The transfer of nitrogen gas molecules between the bulk of gas and the gas-melt interface; (2) the dissociation of N2 molecule on the surface site; (3) the transfer of dissolved nitrogen, [N], between the interface and the bulk of melt. Correspondingly, the desorption route from [N] to N2 molecules is the reverse reaction of the above process. It is generally accepted that the nitrogen adsorption step (2) is the rate-determining step.12,17,23


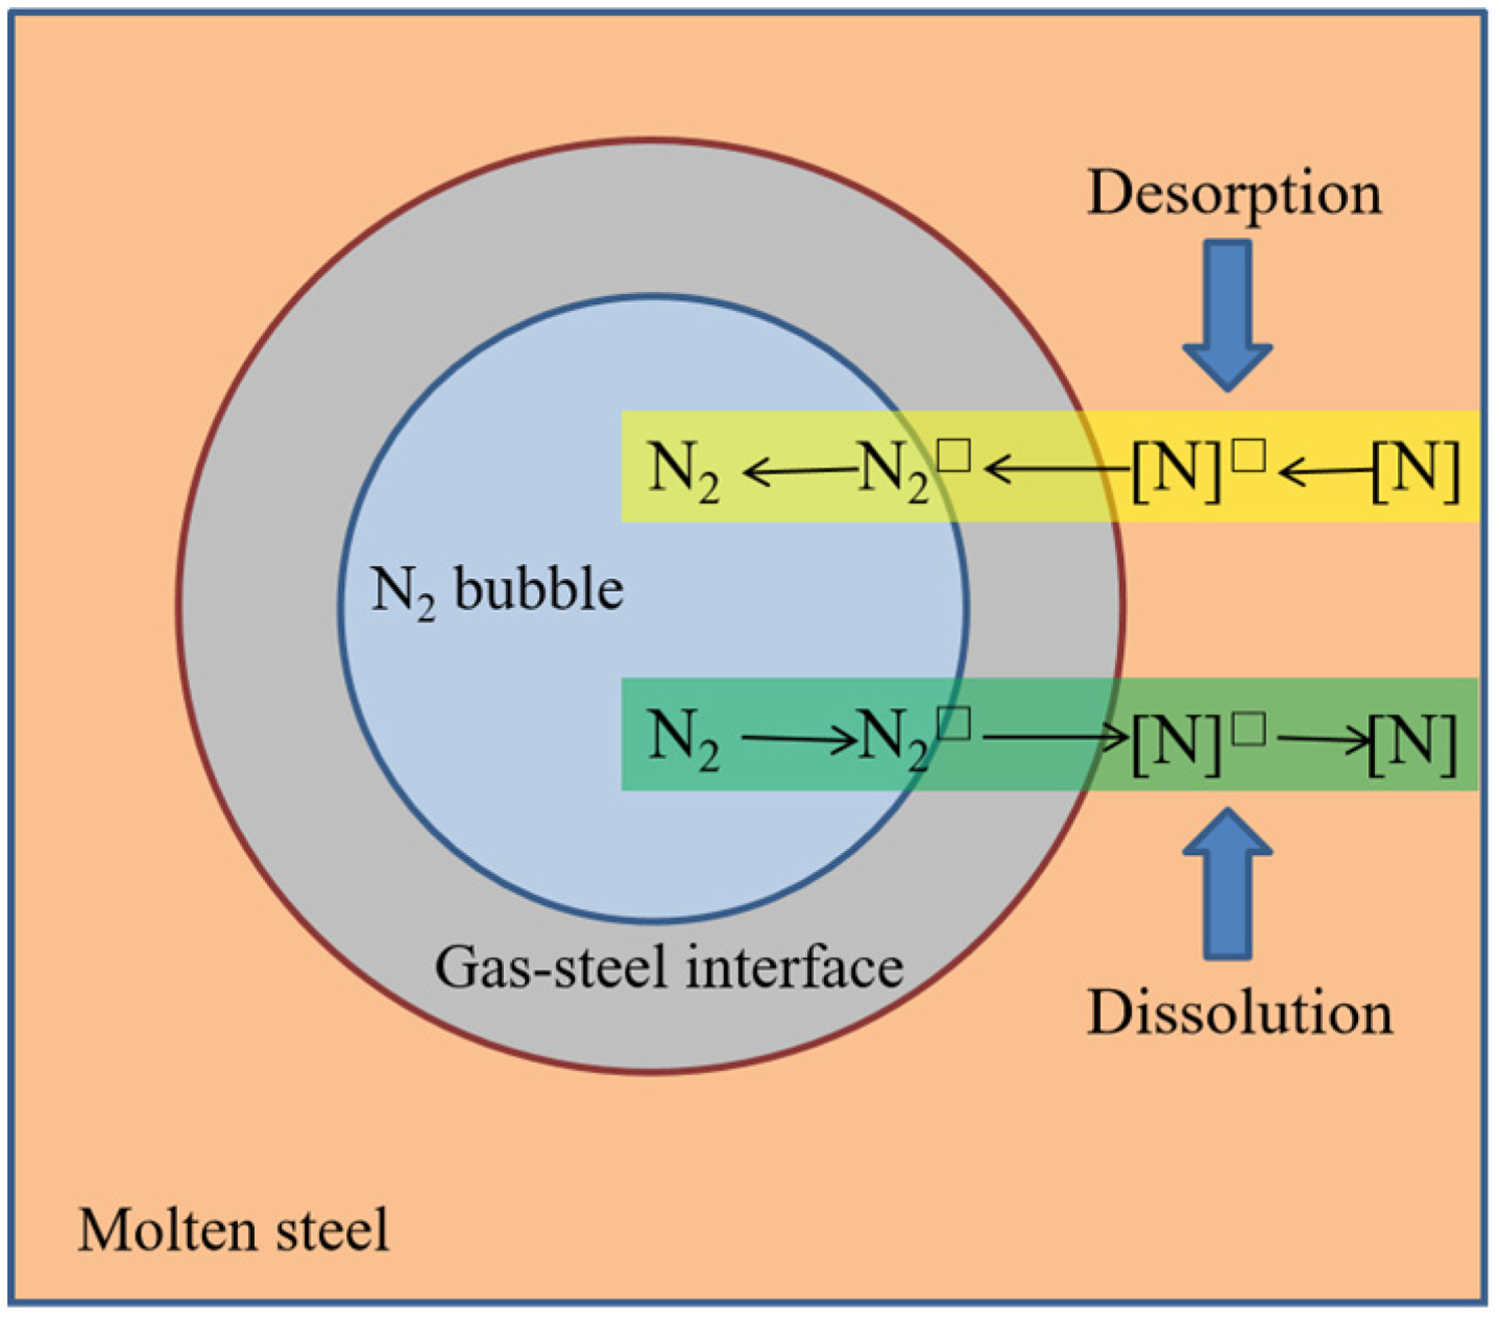
Schematic of the dissolution process of N2 into the molten steel.
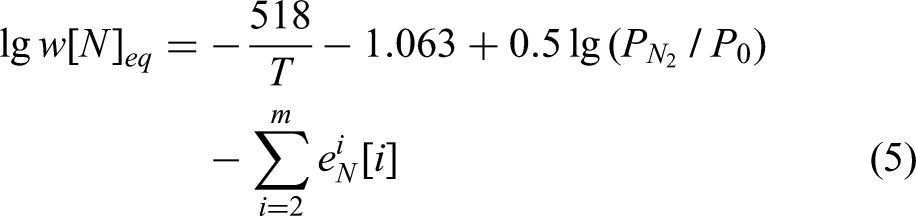
The dissolution reaction for N2 is shown in equation (4). The equilibrium [N] content in the molten steel is shown in equation (5).23–26 Equation (2) shows that the [N] content mainly depends on the partial pressure of N2, the temperature, the content of the alloying elements, and the interaction coefficient between the alloying elements and the [N].
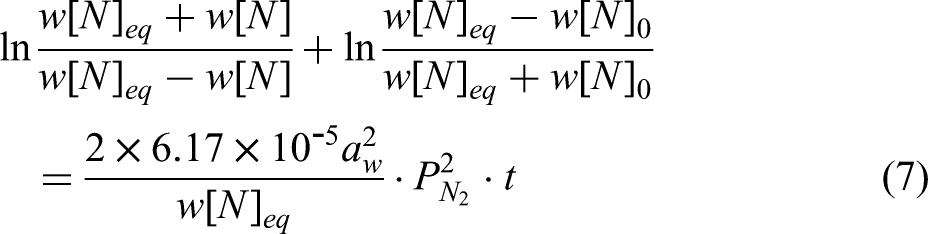
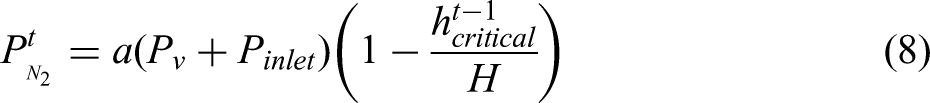
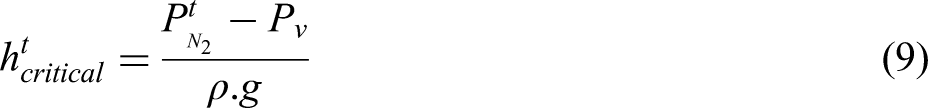
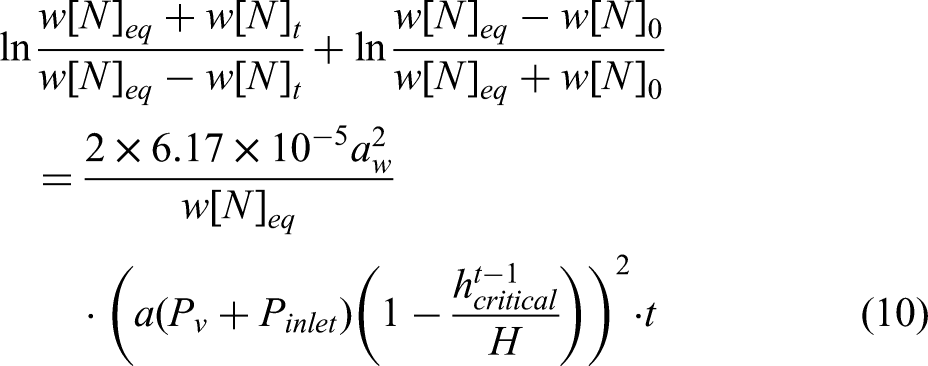
The dissolution rate of the nitrogen is shown in equation (6). The equilibrium nitrogen content with N2 injection time is shown in equation (7), which is the relationship among the [N] content of the molten steel, the partial pressure of N2 and the time. The pressure from the N2 inlet to the surface of the molten steel in RH vacuum chamber decreased with height. Since the pressure of the whole vacuum chamber was variable, a comprehensive pressure is shown in equation (8), which can characterise the overall pressure of the molten steel in the nitrogen absorption zone in the vacuum chamber, so as to calculate the equilibrium nitrogen content. The molten steel above the N2 inlet was divided into the nitrogen absorption zone and the denitrification zone depending on the static pressure of the molten steel at different depths of the molten steel. Therefore, the critical height of the nitrogen absorption zone was introduced into the model. The height of both zones varied with the [N] content in the molten steel. The critical height at time t is set as ht critical and is shown in equation (9). Eventually, w[N]t was calculated by equation (10). The specific derivation process is shown in previous study.
22

Effect of pressure on nitrogen absorption in molten steel
Figure 5 shows the effect of the vacuum chamber pressure on nitrogen absorption rate. The circle represents the experimental value, and the line represents the predicted value of the [N] content at different initial [N] content and pressure by the nitrogen dissolution model. The calculated values of the model agreed well with the measured values in the industrial trials.
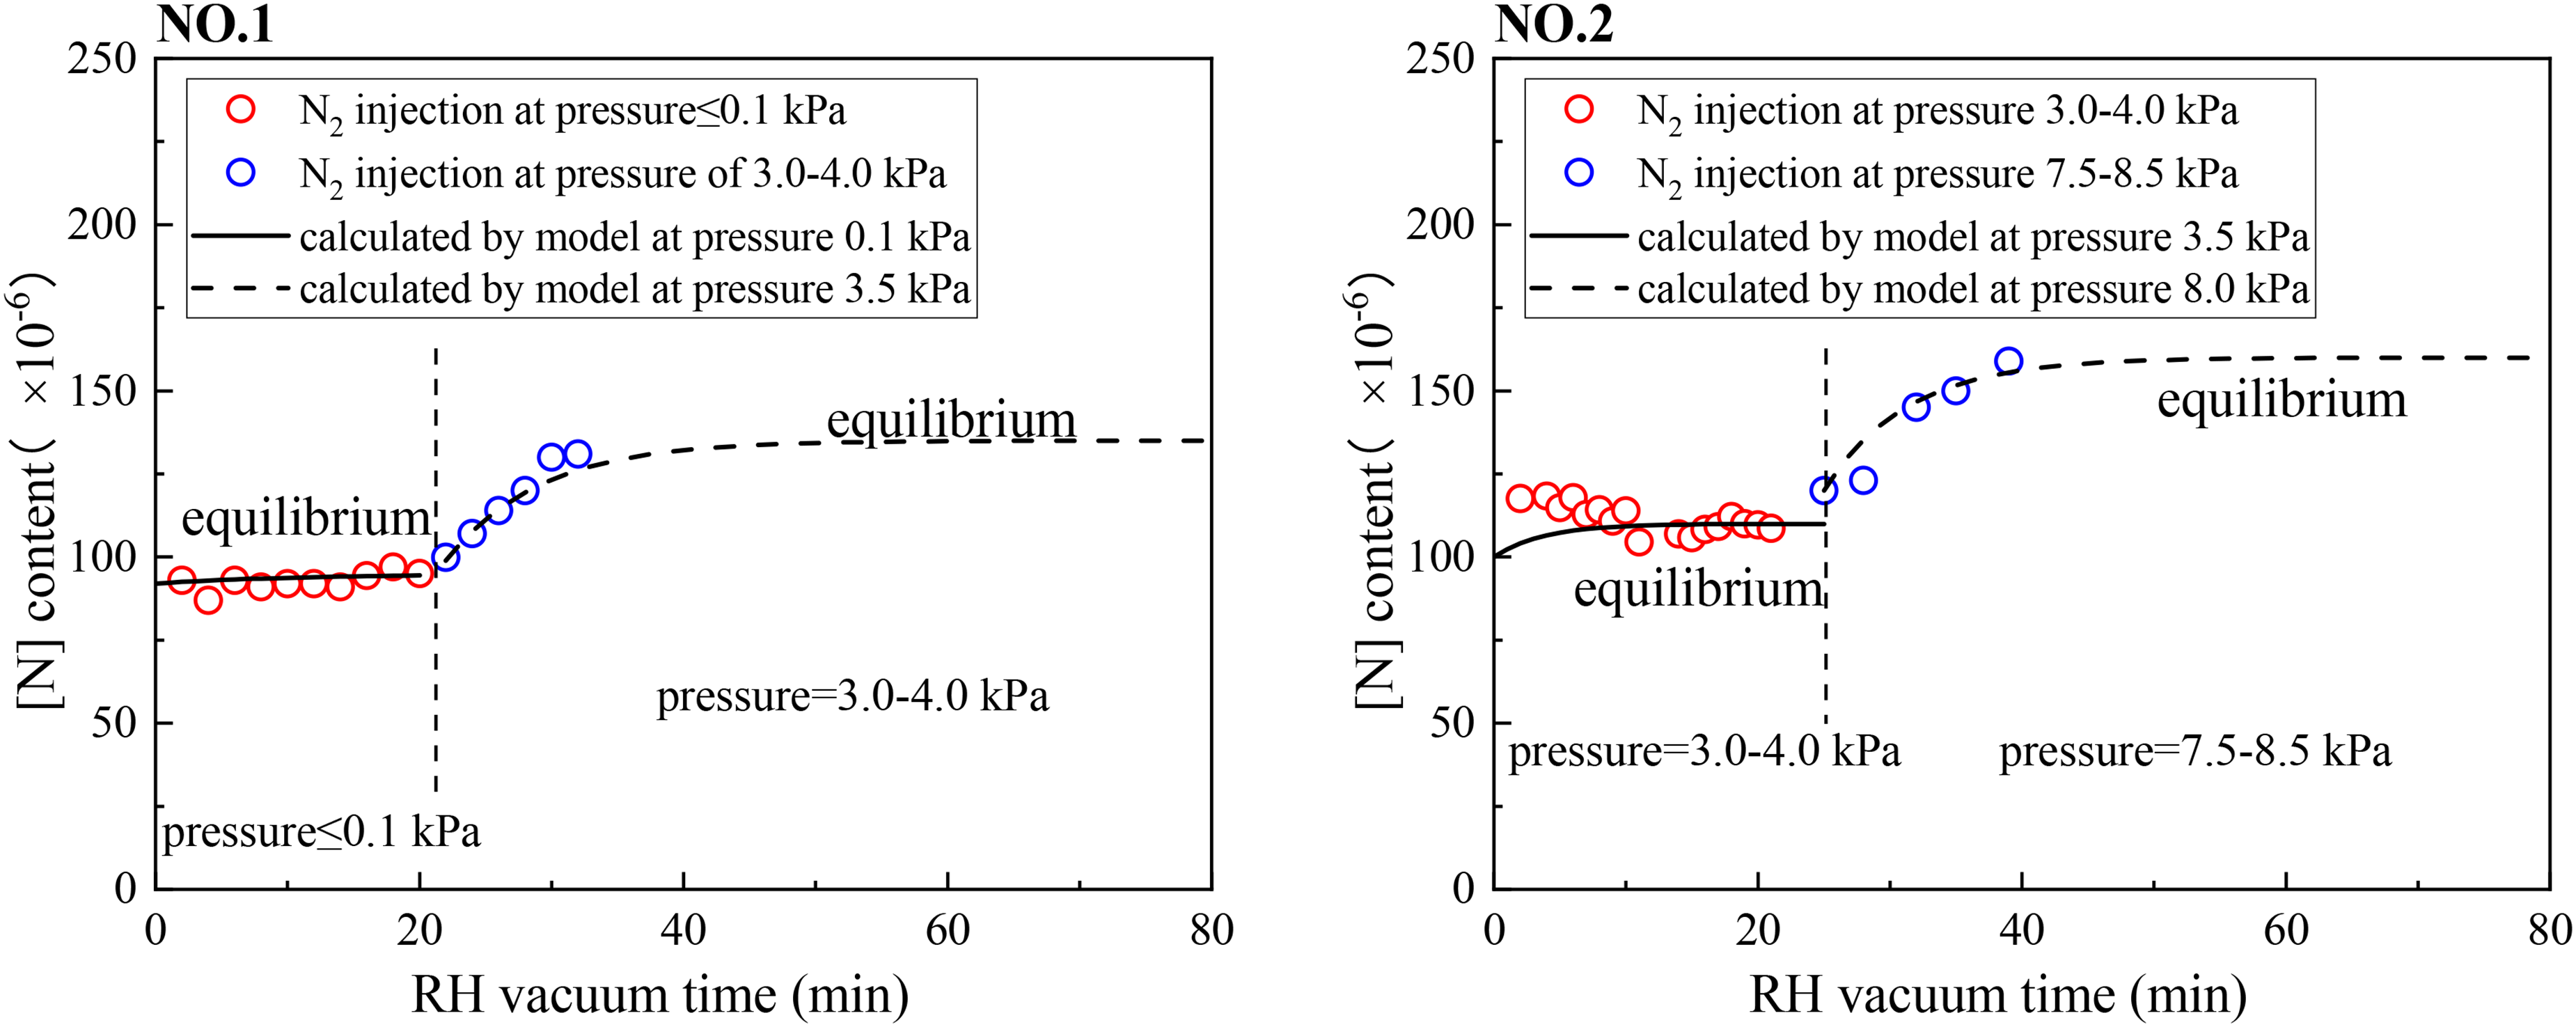
Variation of the [N] content in molten steel with various vacuum chamber pressure.
At the pressure below 0.1 k Pa in No. 1, the [ N ] content was maintained at about 90–100 ppm, and the nitrogen content did not increase although with N2 injection. As the pressure increased to 3.0–4.0 kPa, the [N] content increased to 110–130 ppm and reached the equilibrium value again. Similarly, At the pressure of 3.0–4.0 k Pa in No. 2, the [N] content was maintained at about 110–130 ppm, and the [N] content did not increase with N2 injection. As the pressure increases to 7.5–8.5 kPa, the [N] content increased to 160–170 ppm and reaches the equilibrium value again.
The [N] content no longer increases although with N2 injection when the molten steel reaches nitrogen equilibrium under certain vacuum chamber pressure. Under the pressure of <0.1 kPa, 3.0kPa-4.0 kPa, 7.5 kPa-8.5 kPa, the [N] equilibrium is 90–100 ppm, 110–130 ppm, and 160–170 ppm, respectively. Therefore, the vacuum chamber pressure is the decisive factor to determine the equilibrium [N] content of molten steel.
Effect of N2 injection and nitrogen-containing alloy addition sequence on the nitrogen increase of molten steel
Figure 6 shows the variation of [N] content by N2 injection at earlier stage and Mn–N alloy addition at later stage. The [N] content increased slowly at the earlier stage and increased rapidly at the later stage. No. 3 took 25 min to increase from 38 ppm to 108 ppm, and the nitrogen increase rate decreased from 4.1 ppm/min at the beginning to 2.3 ppm/min at the 20th minute. No. 4 took 32 min to increase from 73 ppm to 148 ppm, and the nitrogen increase rate decreased from 3.8 ppm/min at the beginning to 1.0 ppm/min at the 30th minute. After the addition of Mn–N alloy in No. 3, the nitrogen content increased rapidly to 152 ppm within 3 min, and the nitrogen increasing rate was 17 ppm/min. At this time, the nitrogen content reaches the equilibrium value, and the [N] content no longer changed with the N2 injection. The addition of Mn–N alloy No. 4 reaches 209 ppm, and the rate of nitrogen increase was also 17 ppm/min. Interestingly, even under the N2 injection, the [N] content is still declining. Considering the matching of continuous casting cycle and the temperature drop of the molten steel, RH vacuum was then ended and the molten steel was cast. At this time, the molten steel was in a state of nitrogen supersaturation when RH ends vacuum. After RH vacuum breaking, the [N] content will not continue to decrease because the pressure increases to 1.0 atm. However, it was foreseeable that the [N] content would still gradually decrease to about 160–170 ppm if the vacuum time was prolonged even with N2 injection.
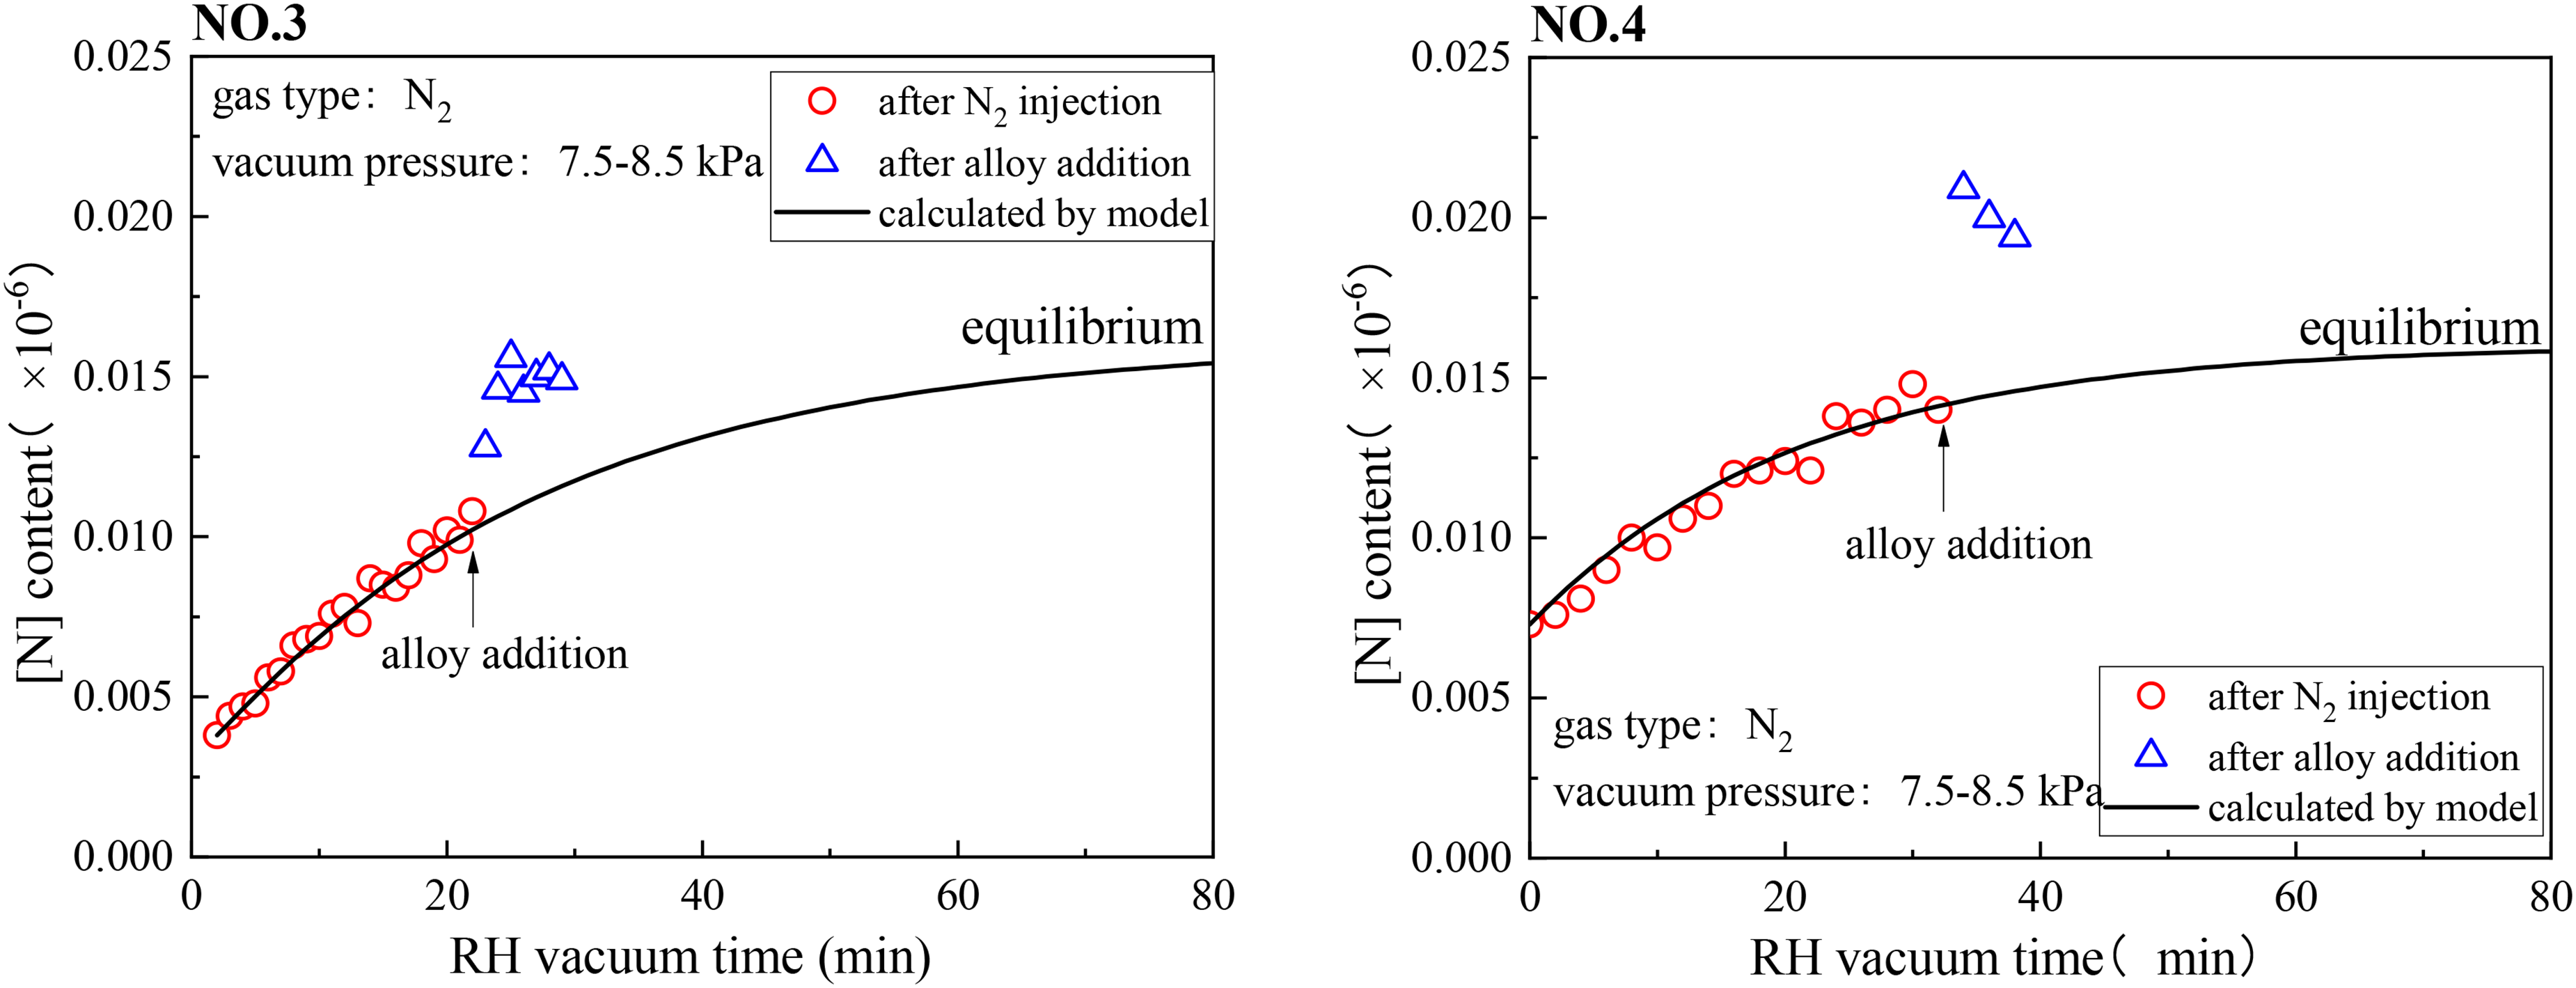
Variation of the [N] content by N2 injection at earlier stage and Mn–N alloy addition at later stage.
Figure 7 shows the variation of the [N] content by Mn–N alloy addition at the earlier stage. The [N] content increased rapidly after alloy addition at the earlier stage. The [N] content increased slowly and be stable after N2 injection at the later stage. After alloy addition, it took 3 min for No. 5 and No. 6 to increase the [N] content from 63 ppm to 120 and 110 ppm respectively. The nitrogen increase rate by the alloy was 23–30 ppm/min. The subsequent [N] content increase was mainly achieved by N2 injection. [N] content in No. 5 and No. 6 both reached equilibrium 160ppm–170 ppm in RH vacuum around 20 min. Nitrogen increase rate for No. 5 and No. 6 was 4.9 and 5.8 ppm/min respectively, which was larger than that in No. 3 and No. 4. The reason was mainly attributed to the combined effects of N2 injection and alloy addition.
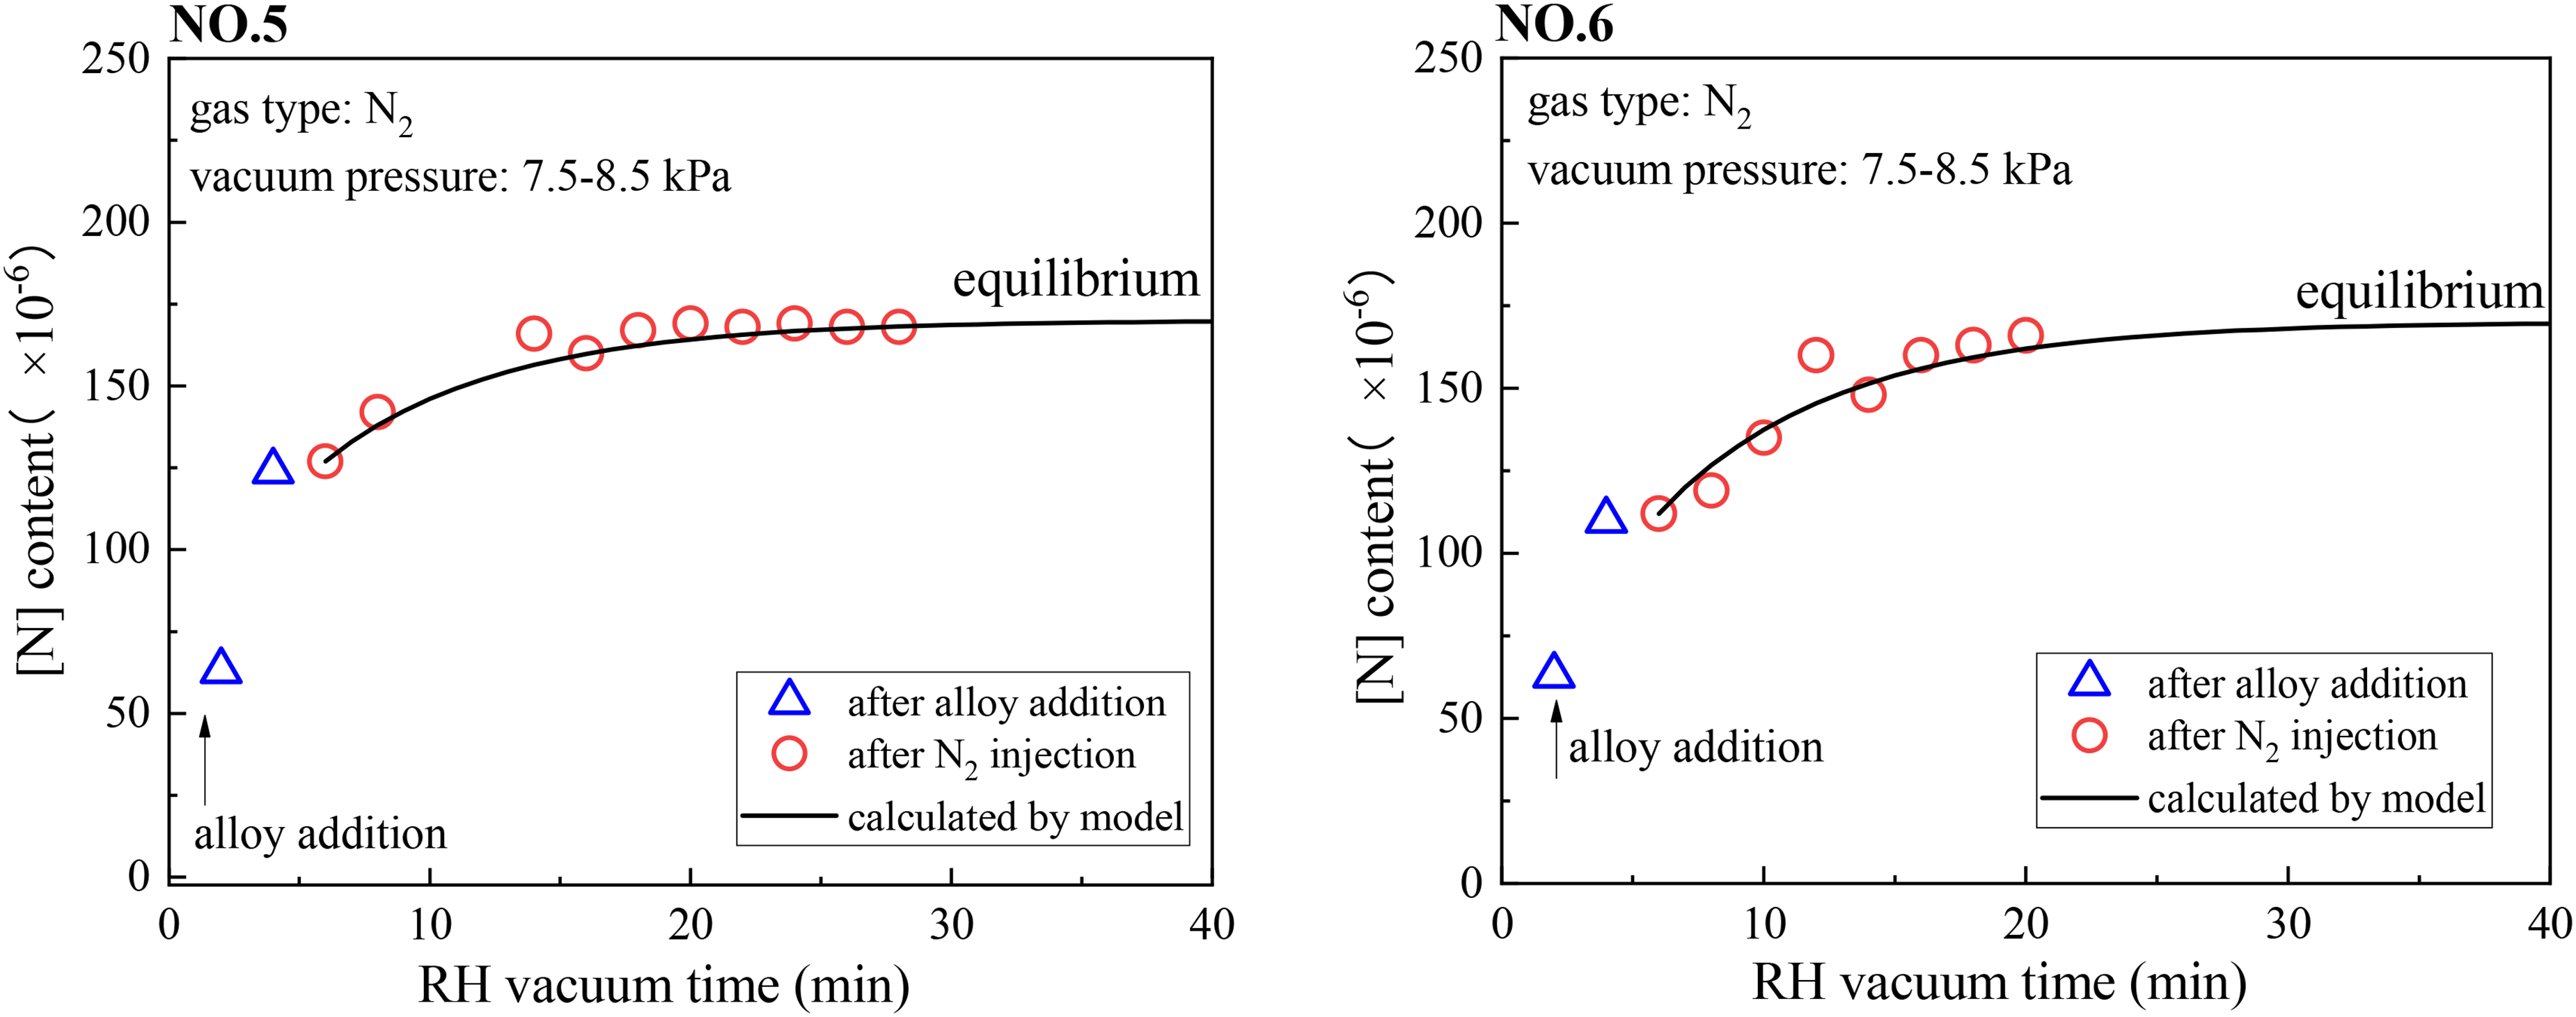
Variation of the [N] content by Mn–N alloy addition at earlier stage.
From the above analysis, the nitrogen dissolution model in RH vacuum by N2 injection was in good agreement with the industrial trials. The model could be used to predict the [N] content with time when blowing N2 under different initial conditions. With the N2 injection, the nitrogen increase rate in the molten steel was slow. The [N] content did not exceed the equilibrium [N] content in a relatively short time. The reaction process between N2 and molten steel includes adsorption, dissolution and decomposition. The nitrogen increase rate is large when the [N] content is low for the activity gap between the N2 bubbles and the [N] content in the molten steel is large. The nitrogen increase rate decreased accordingly when the [N] content is higher.
The [N] content of the molten steel increases rapidly after Mn–N alloy addition. The nitrogen in the alloy dissolved directly into the molten steel. The [N] in the molten steel rapidly rises to a supersaturation state if the amount of nitrogen brought in by the alloy exceeds the nitrogen equilibrium. As time increases, the [N] in the molten steel gradually precipitate out as N2, thus decreasing to the equilibrium nitrogen content.
Effect of N2 injection and nitrogen-containing alloy addition sequence on the cleanliness of molten steel
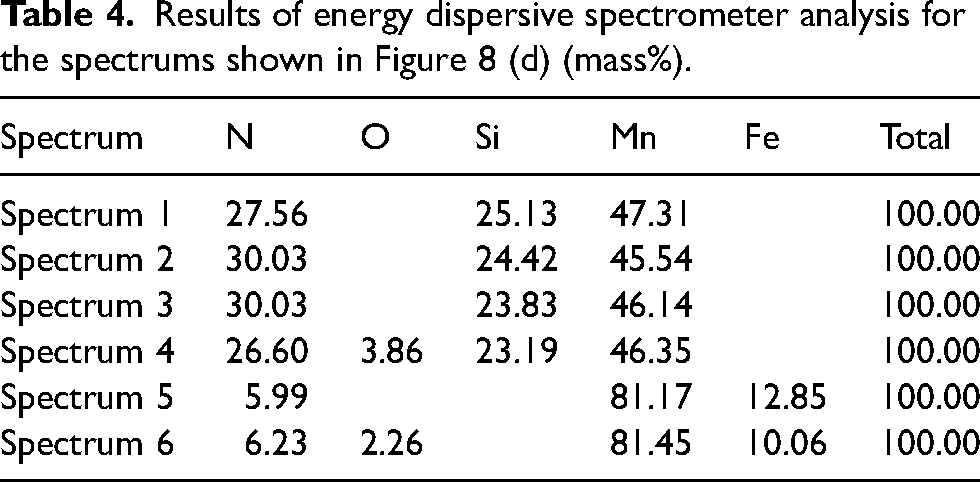
It can be seen from Table 2 that the content of T.O and N in Mn–N alloy is as high as around 1.6% and 6.5%. Microscopic field of view of Mn–N alloy at 500μm, 200μm, 100μm, and 20μm are shown in Figure 8 (a), (b), (c), and (d), respectively. It can be seen that the structure of Mn–N is porous. The composition analysis of the spectrums in the field of view at 20μm is shown in Table 4. The main components of the light grey matrix are Mn-Fe-N (spectrum 5 and 6), while the main components of the dark grey precipitates are Mn-Si-N (spectrum 1, 2, 3, and 4).
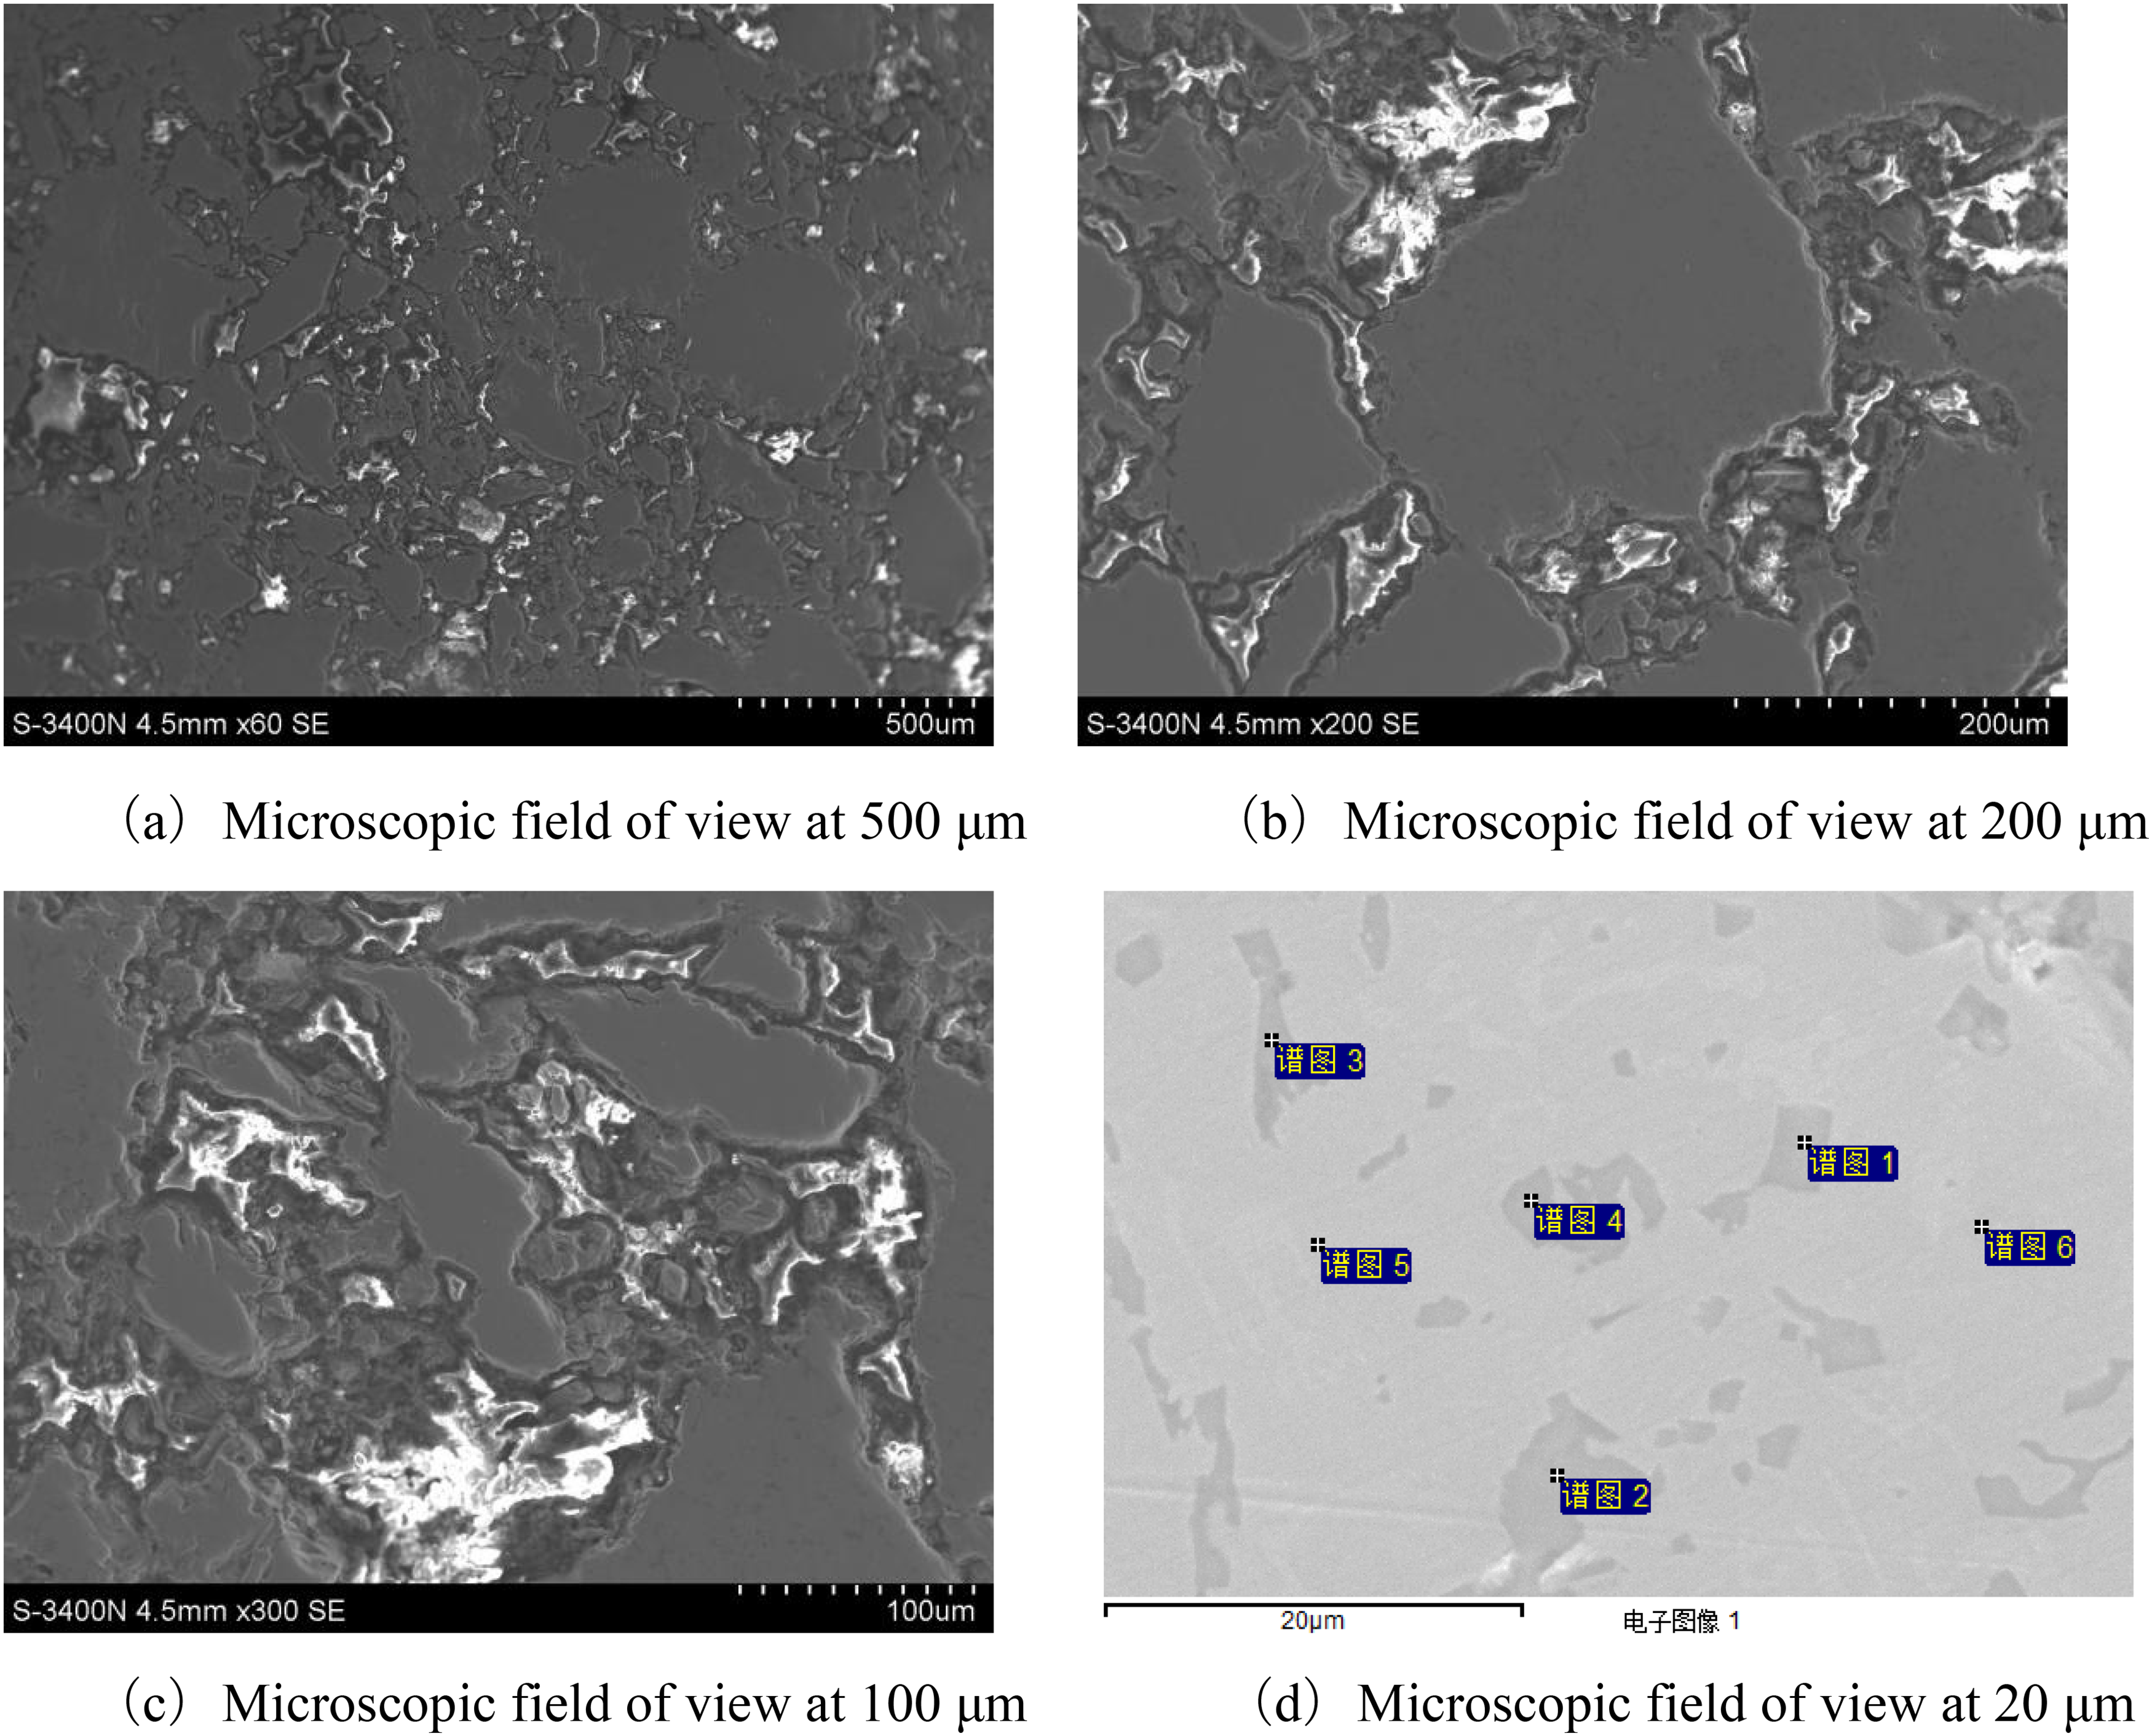
Microscopic morphology of the Mn–N alloy.
Results of energy dispersive spectrometer analysis for the spectrums shown in Figure 8 (d) (mass%).
Route 1 was expressed as N2 injection before Mn–N alloy addition, which was used in No. 7 and No. 8. Route 2 was expressed as alloy addition before N2 injection, which was used in No. 9 and No. 10. Figure 9 shows the variation of T.O content of molten steel under the two nitrogen increasing routes. For Route 1, the T.O content reduced to 20–30 ppm in 8 min and then remained stable, while it increased when the alloy was added at 17–18 min at the later stage of the RH vacuum. For Route 2, when the alloy is added in the early stage of RH vacuum, the time for the T.O content being reduced to 20–30 ppm was around 15 min. The T.O content reduced continually with the extension of time. The overall trend of T.O reduction is first fast and then slow. The T.O content at the end of RH in Route 1was higher than Route 2. Figure 10 shows the variation of the number density of inclusions in molten steel larger than 1 μm under the two nitrogen increasing routes. The number density of inclusions was significantly higher when Mn–N alloy was added, regardless of which route was used. Figure 11 shows the morphological changes of inclusions in the molten steel during the RH refining process under both routes, with similar types and morphologies of inclusions. Furthermore, micron-sized AlN inclusions appeared in high-nitrogen stainless steels 7 or high-aluminium steels. 27 The low aluminium content (0.02%–0.05%) in the steel in current study made it difficult to form micron-sized AlN inclusions, and no micron-sized AlN was observed under the electron microscope. The second-phase particles of uniformly distributed nanoscale AlN were observed by high resolution transmission electron microscope in the test sample, which were discussed in detail in another paper. 28
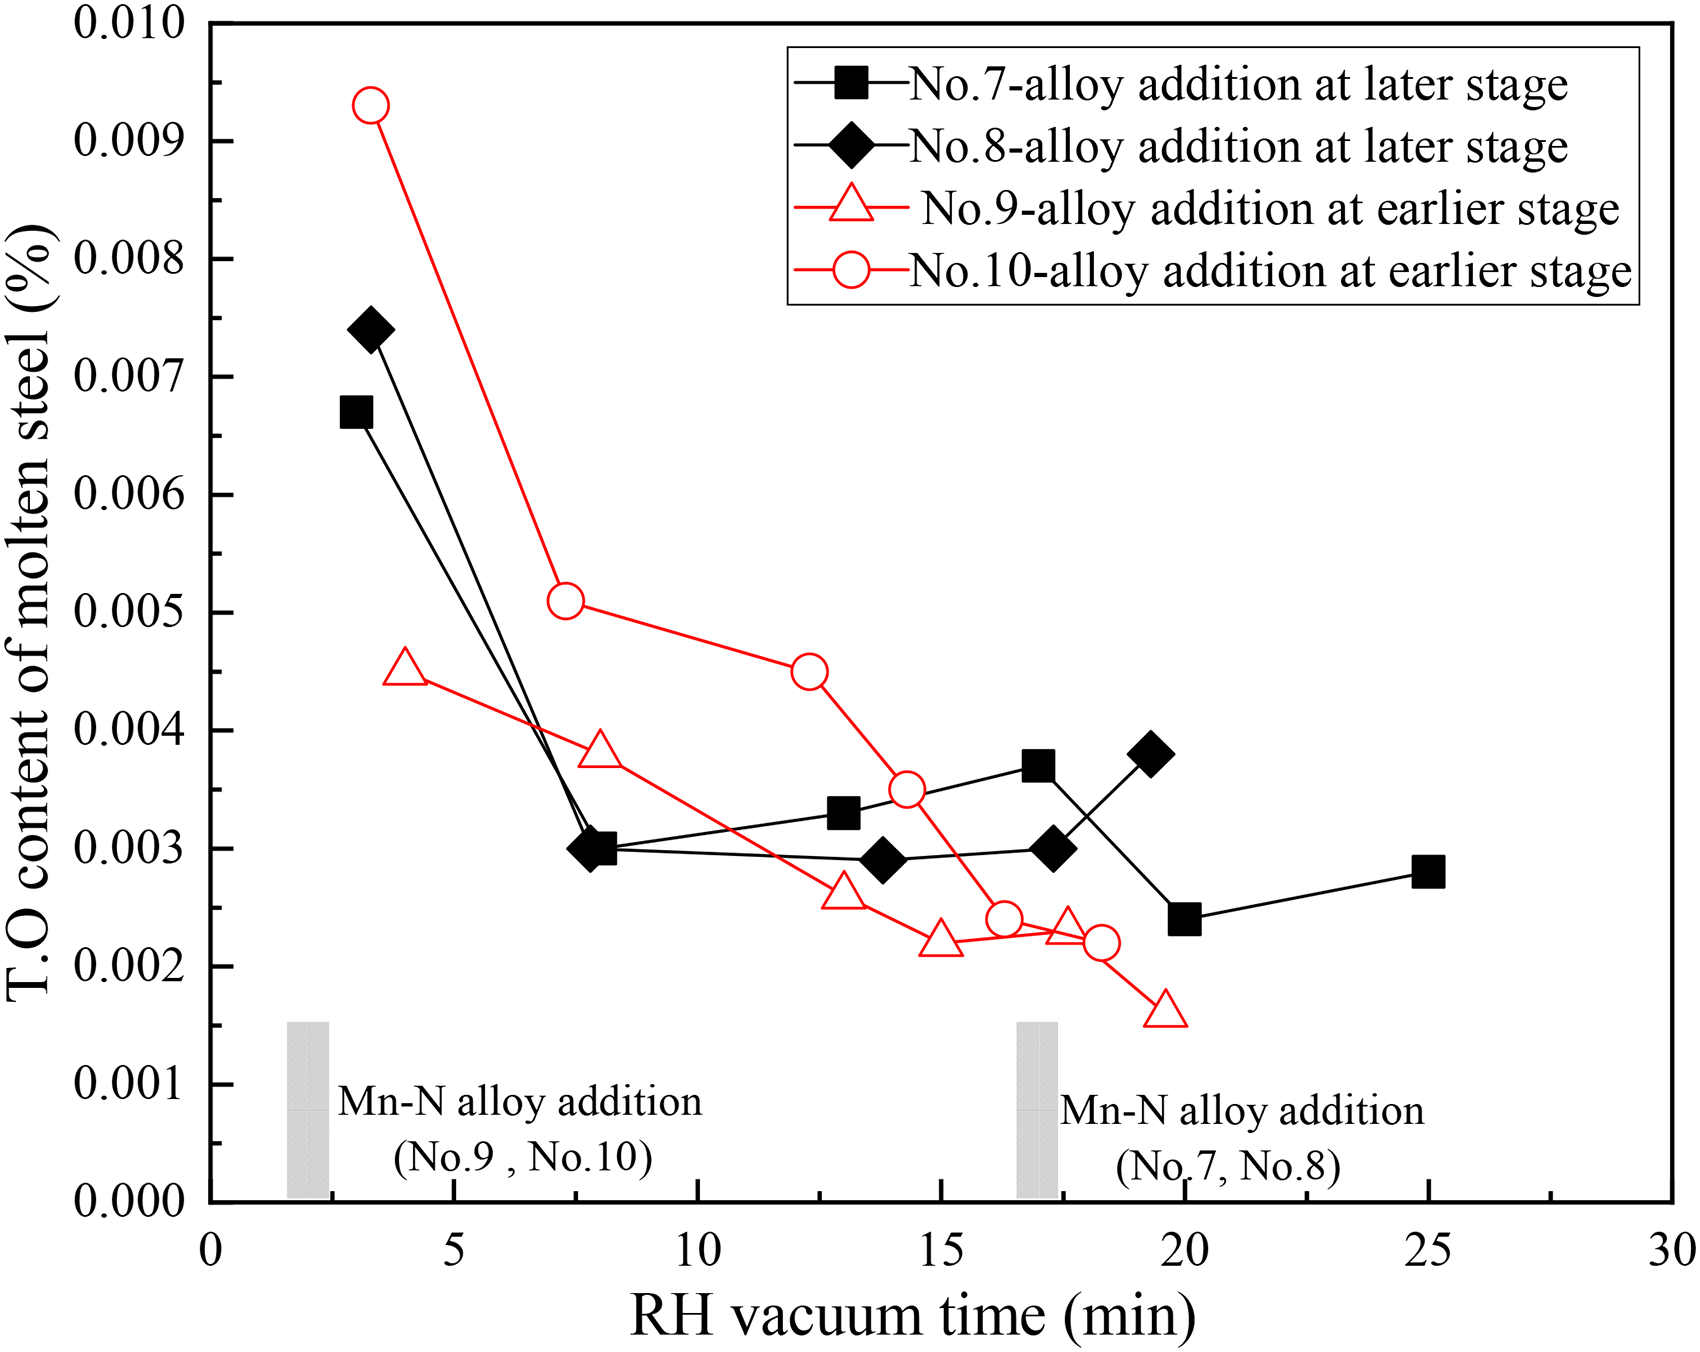
Variation of T.O content of molten steel under two nitrogen increasing routes.
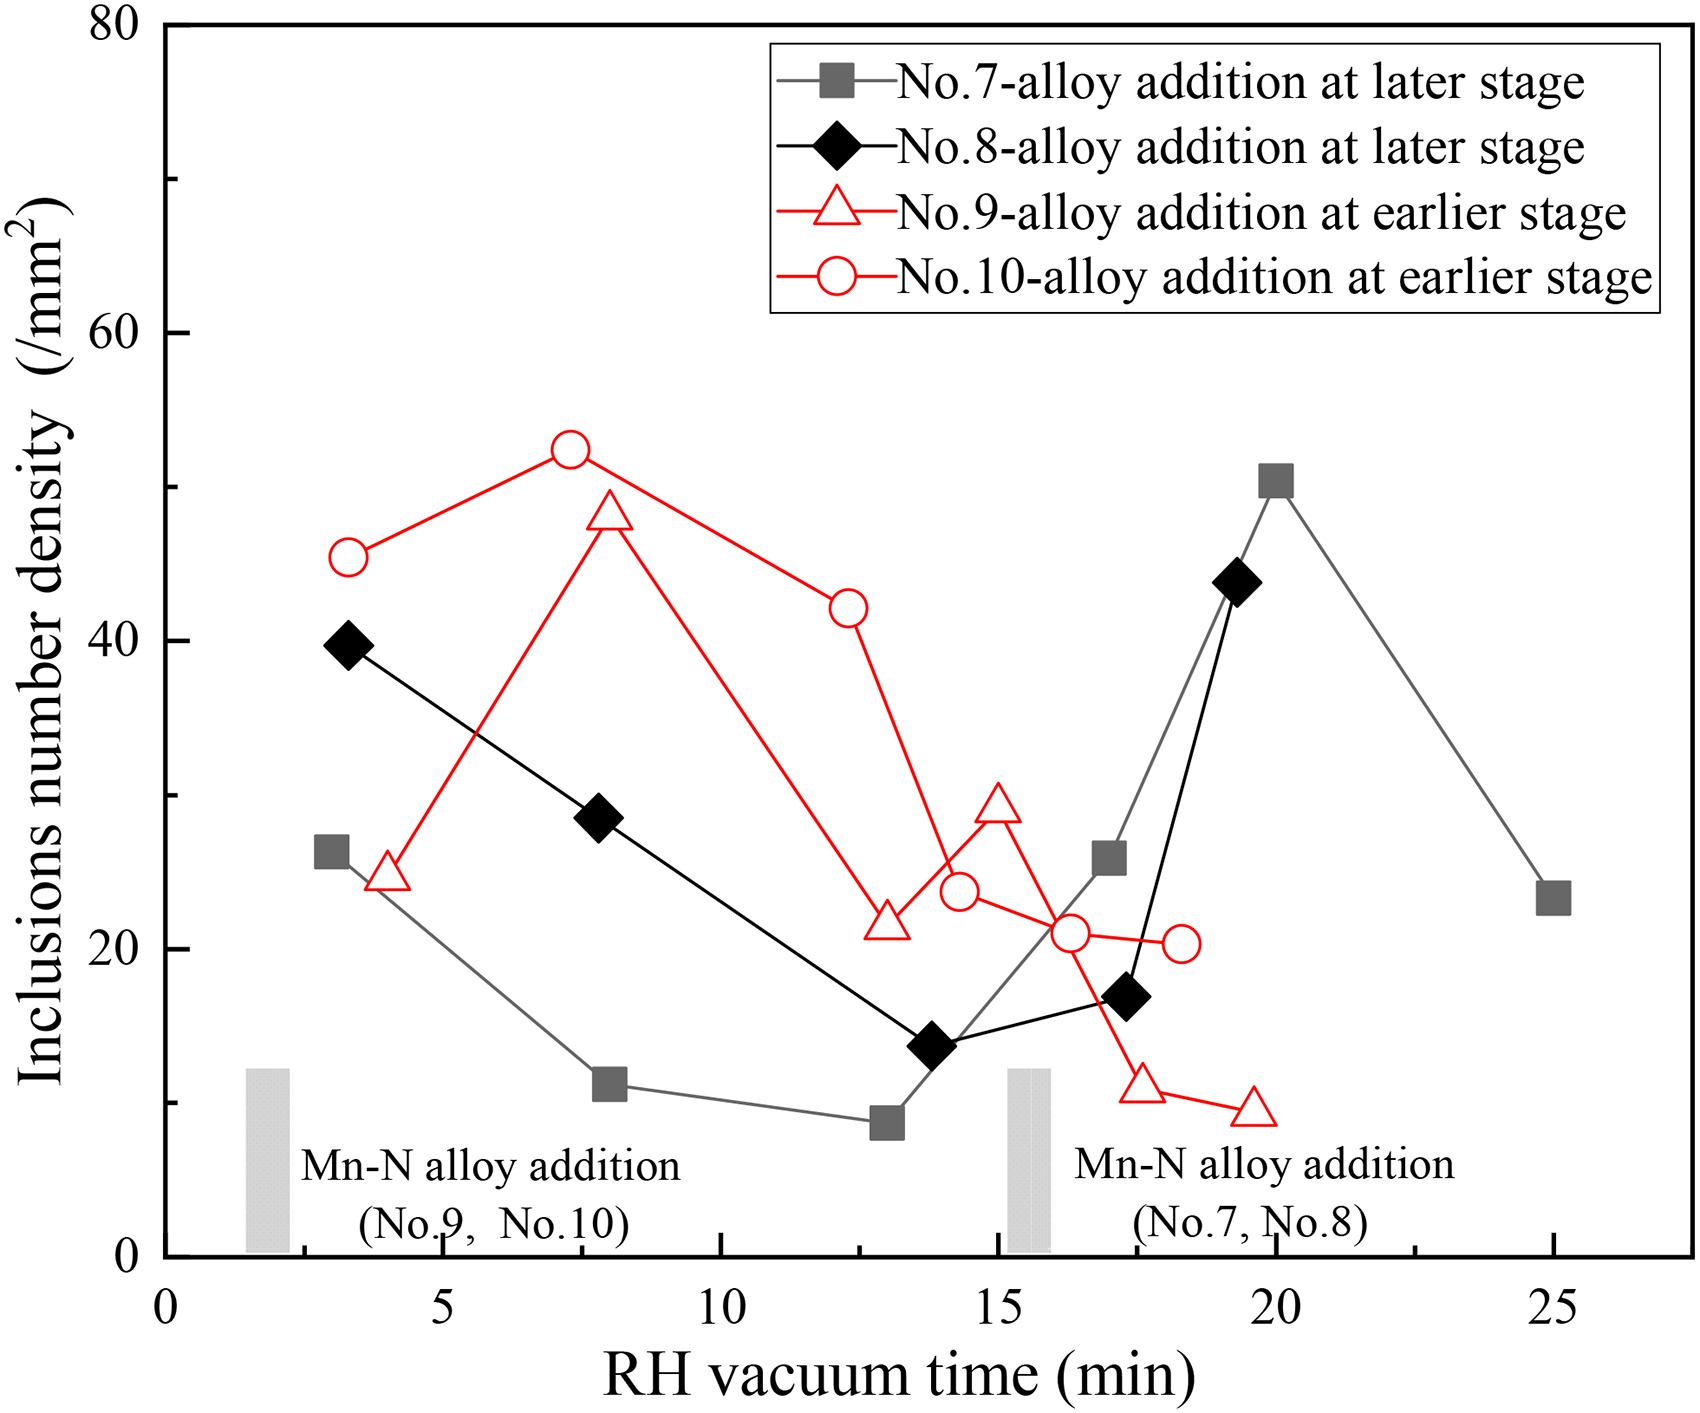
Variation of inclusion number density under two nitrogen increasing routes.
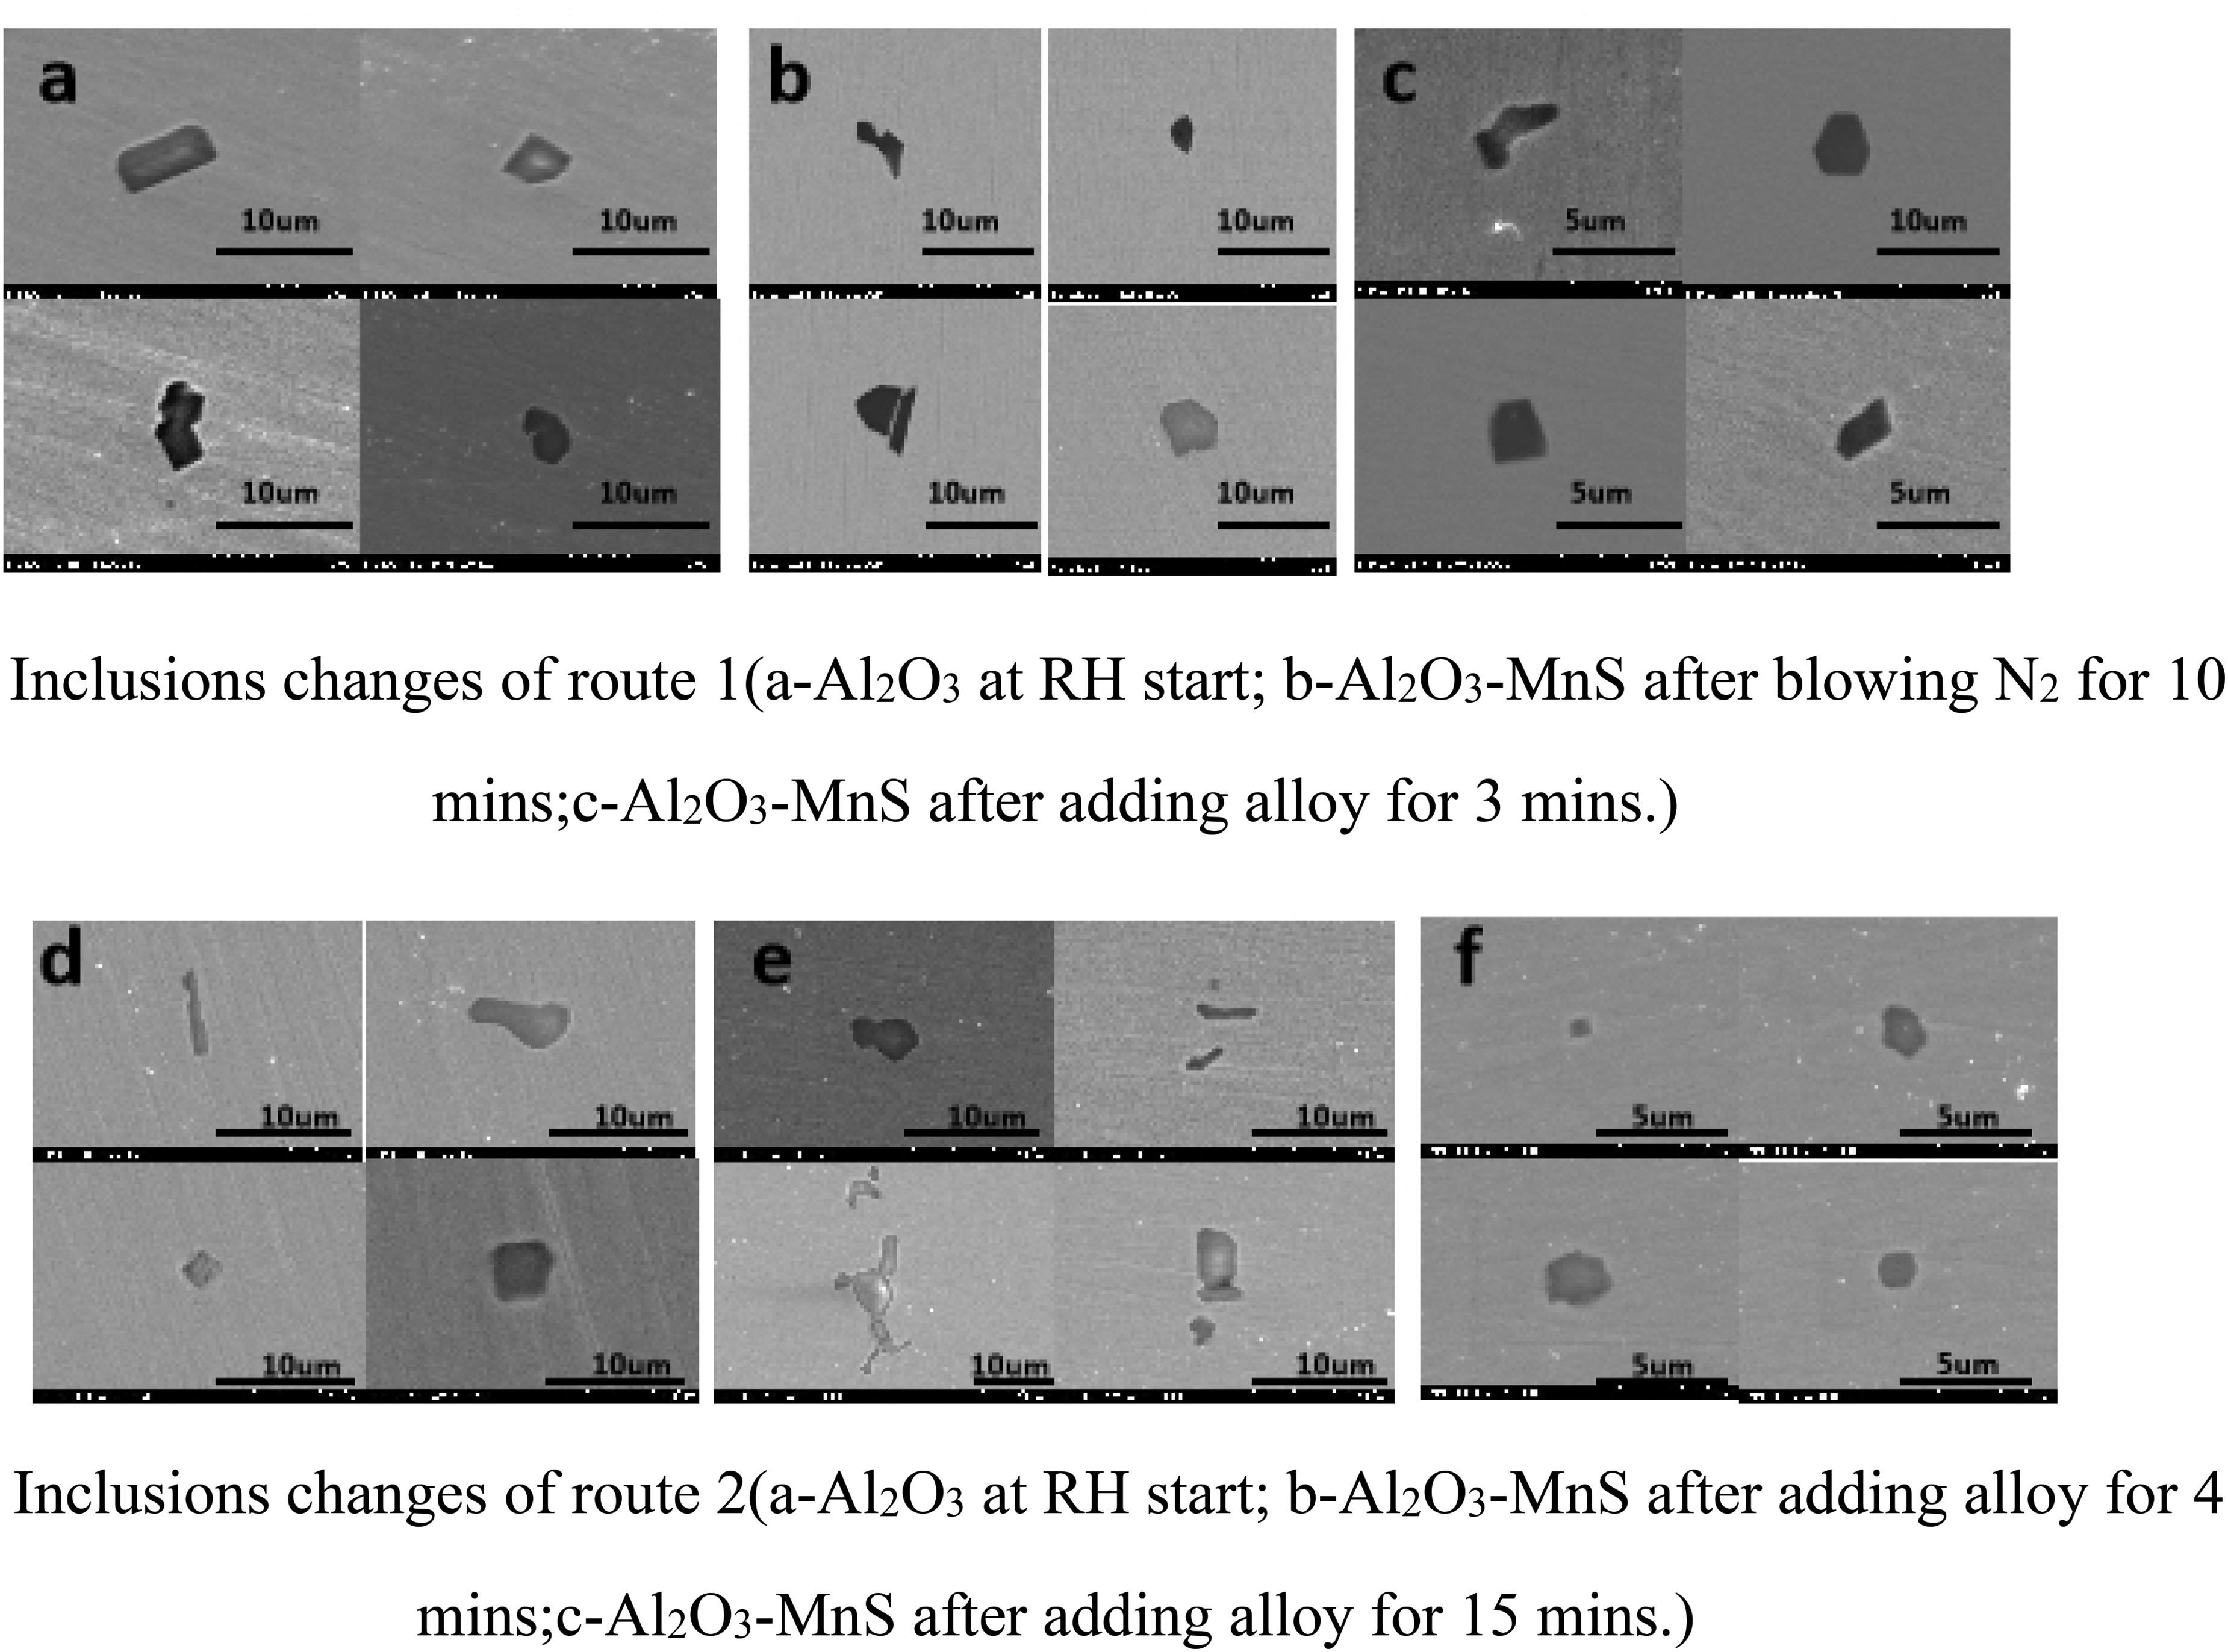
Variation of inclusion type under two nitrogen increasing routes.
According to the results of the above trials, the addition of nitrogen containing alloys resulted in a significant increase in the number of inclusions and the oxygen content of the steel, and the earlier addition of alloys had more time to remove the inclusions and to reduce the T.O content. Therefore, the cleanliness of molten steel at the end of RH in Route 2 is superior to that of Route 1.
Conclusions
In this article, the effect of the order of Mn–N alloy and N2 injection on the nitrogen absorption and the cleanliness of molten steel, was researched by the industrial trials at 300 t RH. In order to study the nitrogen increasing rate by N2 injection, a nitrogen dissolution model was established and verified, then the effect of pressure on nitrogen absorption in molten steel. The main conclusions are as follows:
The nitrogen increase rate is slow with N2 injection, and the [N] content in the molten steel is not further increased after reaching the equilibrium. There exists a nitrogen equilibrium value in molten steel at certain RH vacuum pressure. The equilibrium nitrogen contents of molten steel corresponding to pressure of 7.5–8.5 kPa, 3.0–4.0 kPa and < 0.1 kPa are 160–170 ppm, 110–130 ppm and 90–100 ppm, respectively. Pressure is an important factor affecting the nitrogen dissolution rate. The nitrogen increase rate is fast with alloy addition, while the [N] content rapidly rises to a supersaturation state if the amount of nitrogen brought in by the alloy exceeds the nitrogen equilibrium. As time increases, the nitrogen in the molten steel gradually precipitate out as N2, thus decreasing to the equilibrium nitrogen content. The addition of nitrogen containing alloy resulted in a significant increase in the number of inclusions and the oxygen content of the steel, and the earlier addition of alloy had more time to remove the inclusions and to reduce the T.O content. The cleanliness of the molten steel is higher when the Mn–N alloy is added earlier.
Footnotes
Acknowledgements
The authors deeply appreciate Shougang Group Co., Ltd for permission to publish this article.
Declaration of conflicting interests
The authors declared no potential conflicts of interest with respect to the research, authorship, and/or publication of this article.
Funding
The authors received no financial support for the research, authorship, and/or publication of this article.