
Abstract
Accurate cost estimation is a critical component of mining project evaluation to determine whether the proposed project is clearly feasible, doubtfully feasible or clearly uneconomic. At the beginning of the process, it is very difficult for project evaluators to find reliable relevant data that can be used for all phases of the cost estimation. This paper provides an overview of published work on mining cost estimation methods, data sources and available software. It also introduces the concept of indices for different components of mining projects, discusses their historical movements, and then it compares mining cost indices in the USA, Canada and Australia. It also introduces a new econometric model for estimating the operating cost and capital cost of a coal mining project. The total operating cost and capital cost of mining are calculated by using the proposed econometric model and verified by comparing the outputs with CostMine data and Sherpa software outputs for a surface coal mine. The model shows that the capital cost and production rate have a negative effect on the operating cost, while the deposit average thickness and stripping ratio have a positive effect.
Introduction
Capital and operating cost estimation for proposed mining projects is essential for the evaluation of the project for the entire mine life. New project evaluation methods, such as real options use cost estimation as a function to appraise mining projects (Shafiee and Topal, 2008; Shafiee et al., 2009b; Shafiee et al., 2009a). At the initial stage of project evaluation, it is very difficult to find sufficient, relevant data in all phases of the operation that project evaluators can use in their cost estimation. These data include mining costs (often generated by calibrated model), electric power costs, mining equipment costs, pertinent geological, mineralogical, metallurgical variables, wages and other forms of remuneration, cost indices, plus smelting and tax information (InfoMine, 2011). The economic evaluation components of a mining project are based on information from the feasibility study, but engineers preparing feasibility studies never have all the engineering and economic information that is needed for accurate mining cost estimation. For instance, a small change in overburden and ore transport costs in an open pit mine could have a significant effect on the cost estimation (Jaeger, 2006). Therefore, reliable mining data play a key role in mining cost estimation.
Estimation of capital and operating costs is usually required after reserves have been estimated, but the main capital costs are committed for detailed exploration, mine design layout, detailed metallurgical studies and general plant design (Shafiee, 2011). Most of the time, mining costs estimation is based primarily on computed average costs of similar mining projects and operations with adjustments to account for the project site conditions, mining methods, commodity prices and milling processes (O'Hara and Suboleski, 1996). To account for variability of costs over time, most cost estimators and mining project evaluators use the past volatility of costs in other mining projects as a proxy for their cost estimation. Nevertheless, in practice this approach may not be feasible because historical mining project data may not be publicly released. This means volatility needs to be used as an input variable to measure commodity price and operating cost (Shafiee and Knights, 2010). For example, Lima and Suslick (2006) found that mining project volatility does not dependent on production capacity but depends on increments in price and cost. Consequently, as an alternative solution each company uses its own data and estimated operating costs based on previous similar projects.
Figure 1 shows the revenue streams, operating cost and capital cost items in mining projects as a function of time. The main capital costs are overburden removal, haul road construction, equipment purchase and facilities construction. As soon as a mining project begins operation, revenue streams and operating costs will contribute to the mining project cash flow (Leinart and Schumacher, 2010; Leinart and Salzer, 2008).
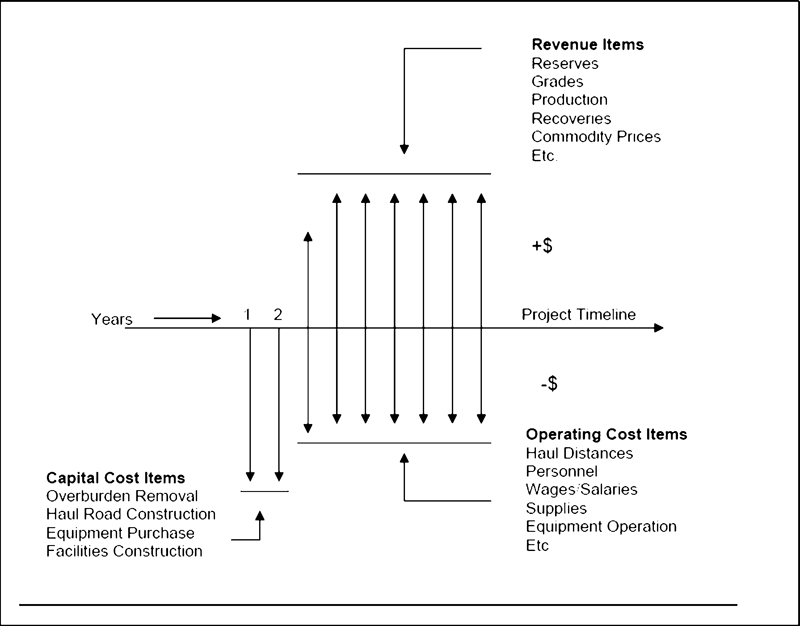
Project timeline depicting revenue and cost data items (Leinart and Schumacher, 2010)
This paper discusses methods for estimating mining costs. Subsequently, it reviews the most popular online available sources, ‘Mine and mill equipment cost calculator’ and ‘Mine cost’. The paper also introduces various cost indices to account for inflation and general movements in costs over time and discusses historical changes in costs. Operating costs in some Australian mines are compared with those of mines in Canada and the USA. Finally, an econometric model is proposed to calculate average operating costs for an Australian coal mine.
Literature review of mine cost estimation
There is no unique cost estimation method that can be used for all mining projects. Furthermore, there are some common problems in cost estimation that must be addressed in all mining projects, for instance, the uncertainty that is associated with the most significant variables, missing data, and lack of a uniform methodology. High stripping ratios, seams with complex metallurgical characteristics, grade and tonnage estimates, commodity prices, mines located in isolated regions, climatic conditions, lack of access to roads, electricity and water supply as well as mountainous topographic challenges, all contribute to uncertainty in the project. For this reason, the mining project evaluator may tend to overestimate the operating costs of the mine in order to take a conservative approach (Shafiee et al., 2009b). As projects proceed more data become available and crucial variables become more certain, and thus, operating costs should be revised. For instance, knowledge of the deposit in regards to energy consumption as well as metallurgical characteristics can be accessed through bore hole sampling. More accurate estimates of the overall project capital cost and operating costs can be obtained from a summation of cost items after assessing the local specific effect of conditions on each item of the capital and operating costs. Mineral commodity and oil price fluctuation are other factors that influence mining cost estimation. The prediction of commodity prices is focus in mining project evaluation (Shafiee and Topal, 2010a; Shafiee and Topal, 2010b).
The AusIMM (1993) published a cost estimation handbook for the Australian mining industry. This source computes capital and operating costs of surface and underground mines by using graph and formulation methods. Most of the coefficients in this book are out of date and need to be updated (Noakes and Lanz, 1993). In 1998, Mular published the latest version of CAPCOSTS, which is a fairly comprehensive handbook use in estimating mining and mineral processing equipment costs, capital expenditure and mining projects (Mular, 1998). This handbook applies graphs, tables and equations for rapid estimation of the cost item of major equipment used in mineral processing plants. Mular's equations use rules of thumb to estimate the cost of some items.
There are two main methods available for preliminary mining cost estimation. The first one is an online software tool called ‘Mine and mill equipment cost calculator’ which calculates all equipment costs in feasibility studies. InfoMine is an international company provides global mining cost data; its products are available in Australia under brand name R2Mining. These data are available in a complete equipment cost database, along with the mechanism to extract and adjust the data for specific projects. This online package includes more than 3000 different mining and milling equipments and supply costs (R2Mining, 2011b; CostMine, 2011). The second is ‘Mine cost’, which comprises mine cost spreadsheet models and operating cost information based on verifiable engineering production data peer reviewed by mining industry analysts. It includes spreadsheet models containing detailed production and mine economic data, in many cases back to 1991 as well as projections up to 2012. All models have cost curves showing the operation's comparative cost ranking against all other mines in the database (Mine Cost, 2009). The main shortcoming of this method is that it does not provide any details about the methods used to estimate mining cost curves and total cost for a specific mine. Since each mine has unique specifications, they should be reflected in its estimated costs. This approach focuses on establishing a range of capital and operating costs as opposed to the first approach, which is based on previous mining projects with parameters adjusted by appropriate indices.
O'Hara provides equations in the form of exponential functions for daily production and operating costs based on data from previous mining projects. Equation (1) shows some of the main equations that were estimated by O'Hara based on his data collection and his rule of thumb assumptions (O'Hara, 1980)
Mining cost indices
Mining industry cost indices provide a general mechanism for calibrating and updating cost information. One of the advantages of cost indices is that they can include the effect of inflation on mining costs. Figures 2–5 illustrate a variety of cost indices for specific mining scenarios computed by CostMine in 2009. These indices are based on general inflation in the US economy. InfoMine claims these indices are comparable to the inflation experienced in general by the mining industry (CostMine, 2009). This section reviews the fluctuations in cost indices from 1965 to 2008.
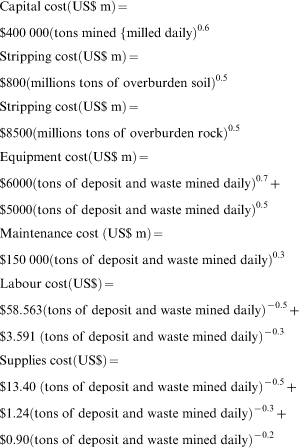
Mine and mill operating labour and mill construction labour for coal mining processing cost indices (CostMine, 2009)
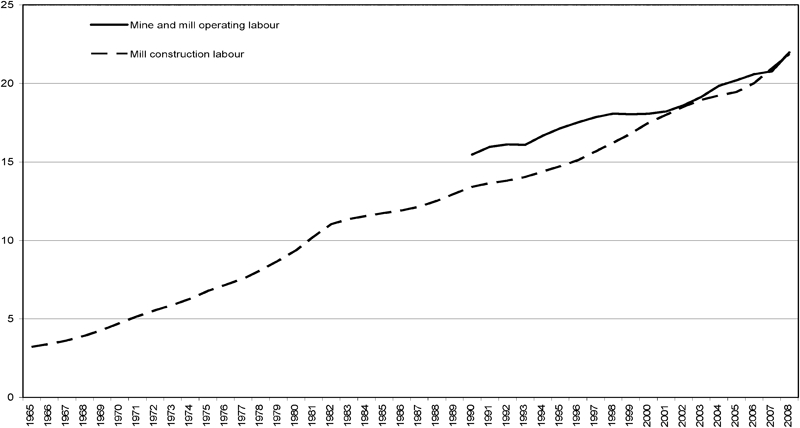
Machinery, heavy equipment, repair parts, truck tyres, scrapers, loaders and line haul railroads (all services) for coal mining and processing cost indices (CostMine, 2009)
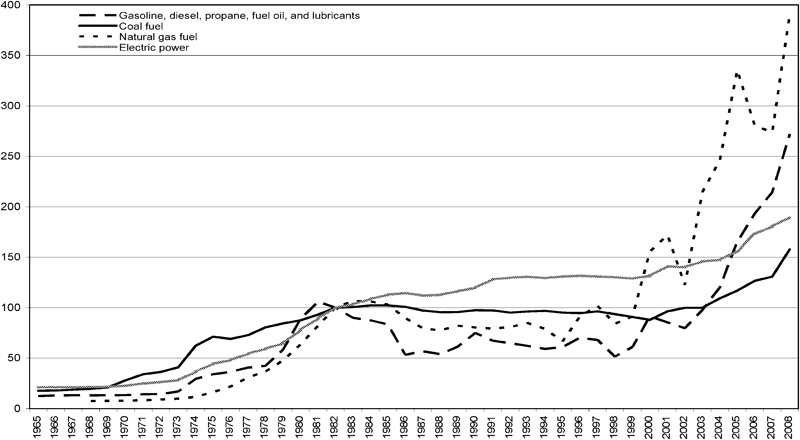
Petrol, diesel, propane, fuel oil, and lubricants, coal fuel, natural gas fuel and electric power for coal mining and processing cost indices (CostMine, 2009)
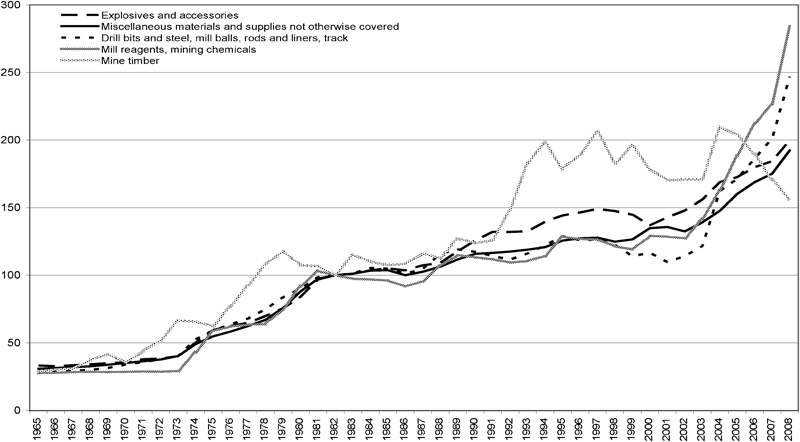
Explosives and accessories, miscellaneous materials and supplies not otherwise covered, drill bits and steel, mill balls, rods and liners, track mill reagents, mining chemicals and mine timber for coal mining and processing cost indices (CostMine, 2009)
Figure 2 illustrates two labour indices: ‘mine and mill operation labour’ and ‘mill construction labour’. Both labour indices move together throughout the periods. As shown, the labour index has increased by around six-fold over the last forty years. Figure 3 depicts ‘machinery, heavy equipment, repairs parts’, ‘trucks tyres, scrapers, loaders, etc.’ and ‘line haul railroads (all services)’ from 1965 to 2008. The trends in these three indices are similar to each other from 1965 to 1982. After 1982 ‘machinery, heavy equipment, repair parts’ and ‘line haul railroads (all services)’ indices increased by approximately the same rate as in the previous period to 2008, while the ‘truck tyres, scrapers, loaders, etc.’ index decreased until the early 2000s and slightly increased in the late 2000s. Figure 4 shows the trend in ‘petrol diesel, propane, fuel oil, and lubricants’, ‘coal fuel’, ‘natural gas fuel’ and ‘electric power’. As can be seen in Fig. 4, ‘petrol, diesel, propane, fuel oil, and lubricants’ and ‘natural gas fuel’ increased in comparison to the two other indices. ‘Natural gas’ has risen fifty-fold over the last 40 years. Figure 5 shows five operation indices from 1965 to 2008. ‘Explosives and accessories’, ‘miscellaneous materials and supplies not otherwise covered’, ‘drill bits and steel, mill balls, rods and liners, track’ and ‘mill reagents, mining chemicals’ fluctuated together over the period. ‘Mine timber’ fluctuated the same as other operation indices from 1965 to 1991, and then almost doubled in the four years to 1995. From 1995 to 2008, this index was relatively stable with minor oscillations. Consequently, all 14 indices over that period increased for coal mining and processing costs.
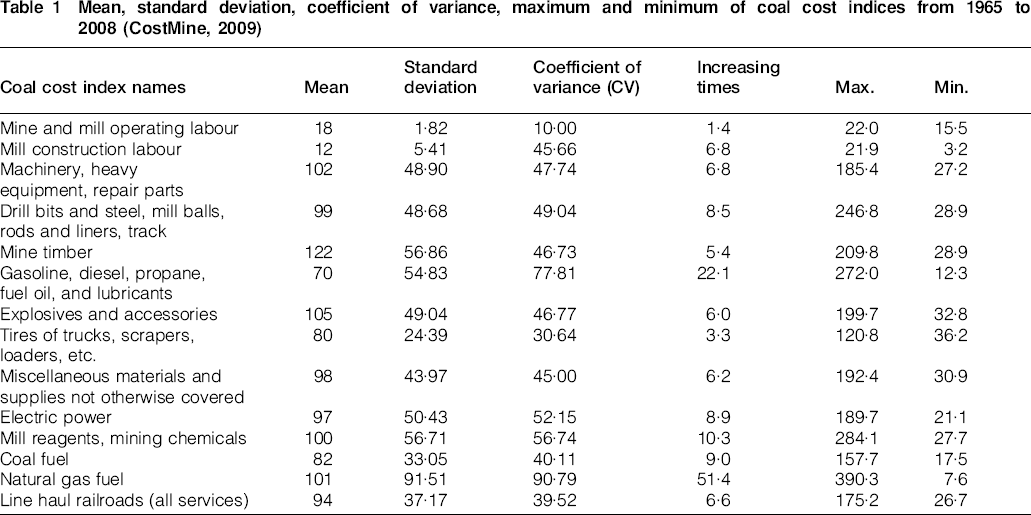
Table 1 shows some statistics of coal mining and processing indices from 1965 to 2008. As can be seen from the table, the labour cost index contributes the least increase to the mining cost while mine timber contributes most. The coefficient of variation demonstrates that fuel indices were the most volatile while the labour index varied least. All indices increased over the time period by factors of 6–10. Operating labour, costs increased by 40% over the last forty years, while oil and natural gas fuel soared 22 and 51 times respectively from 1965 to 2008.
Mean, standard deviation, coefficient of variance, maximum and minimum of coal cost indices from 1965 to 2008 (CostMine, 2009)
The Coal cost guide (CCG) and Australian coal cost guide (ACCG) are internally generated indices by the experts from CostMine centre that provide a reliable means of tracking the cumulative effect of cost inflation on mining projects in the USA, Canada and Australia (Leinart, 2010; R2Mining, 2011a). In 2006 and 2007, the USA had 802 surface and 559 underground mining activities. The largest producer of coal in 2007 was Wyoming with 411·5 million tonnes followed by West Virginia, Kentucky, Pennsylvania and Texas. Moreover, Alberta and British Columbia coal mines are the largest coal producing states in Canada (CostMine, 2009). In Australia, Queensland and New South Wales are the largest coal producers. Table 2 endeavours to collect operating and capital cost of 20 Australian open pit coal mines with their production rates. As can be seen in Table 2 real data for Australian mines were not readily available. However, the authors estimated a reliable range for those variables. An estimated combined capital and operating cost was used where expansions of projects had taken place since initial start up. The authors believe that the unavailability of mine data are the main reason for lack of research in cost estimation in Australia. The CCG and ACCG indices are used as proxies for estimating the cost of each item in Australian surface coal mining cost.
Data on main Australian surface coal mines*
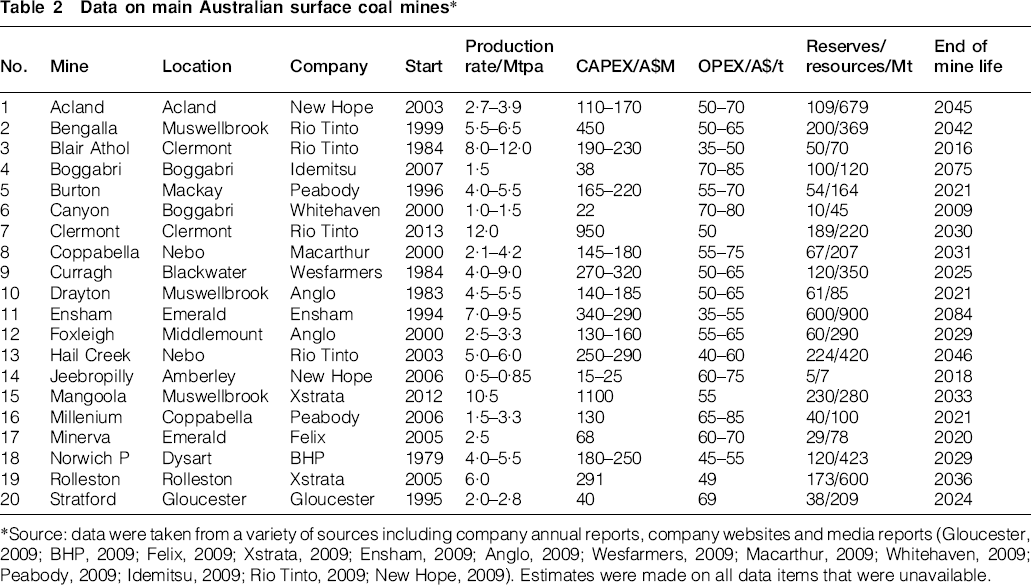
Source: data were taken from a variety of sources including company annual reports, company websites and media reports (Gloucester, 2009; BHP, 2009; Felix, 2009; Xstrata, 2009; Ensham, 2009; Anglo, 2009; Wesfarmers, 2009; Macarthur, 2009; Whitehaven, 2009; Peabody, 2009; Idemitsu, 2009; Rio Tinto, 2009; New Hope, 2009). Estimates were made on all data items that were unavailable.
Figure 6 depicts the ACCG and CCG indices for Australia, the USA and Canadian mining industries individually from 1986 to 2010, from 1999 to 2010 and from 1991 to 2008 respectively. The figures show that Australian operating cost and capital cost mine indices are much higher than the USA and Canadian mine indices. Australian operating cost index and capital cost index movements are similar to each other from 1986 to 2004; thereafter the operating cost index rose more than the capital cost index. Canadian operating cost index and capital cost index movements are similar from 1991 to 2003, thereafter the operating cost index increased more than the capital cost index. The capital cost and operating cost index in the US increased according to the same trend over the last 10 years. As a result, the operating cost and capital cost indices in Australia, the USA and Canada increased.
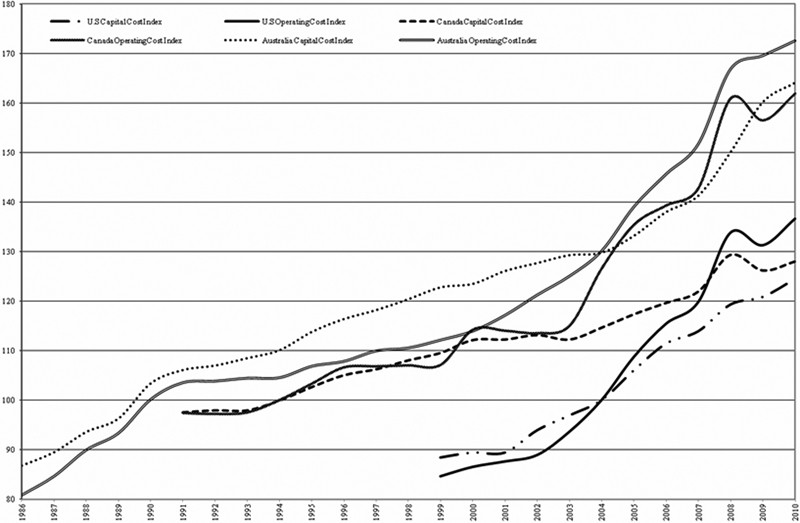
Capital and operating cost indexes for Australian, the USA and Canadian coal surface mine (InfoMine, 2011; R2Mining, 2011a)
Figure 7 illustrates the Marshall and Swift index, which is another index for mining and milling equipment costs. Marshall and Swift is one of the most comprehensive databases in industrial economics (Shafiee, 2011). This index is based on regular surveys of material prices, labour rates and equipment prices in different industries, resulting in >2500 databases of location-specific costs throughout Canada and the USA. Marshall and Swift provide quarterly data for mining and equipment cost indices. The main advantage of this index is its availability and frequency. However, the Marshal and Swift index provides just one figure for all sub-costs in mining projects and ignores other components of mining costs. Figure 7 illustrates the historical movement in costs plus an econometric linear trend of the Marshal and Swift equipment cost index from 1980 to 2009. Another advantage of this index is the expansion of the linear econometric trend for estimating future mining and milling equipment costs. For example, the operating cost for the next ten years will be close to the econometrics linear trend. Figure 7 again verifies that mining and milling equipment costs increased over the last 30 years.
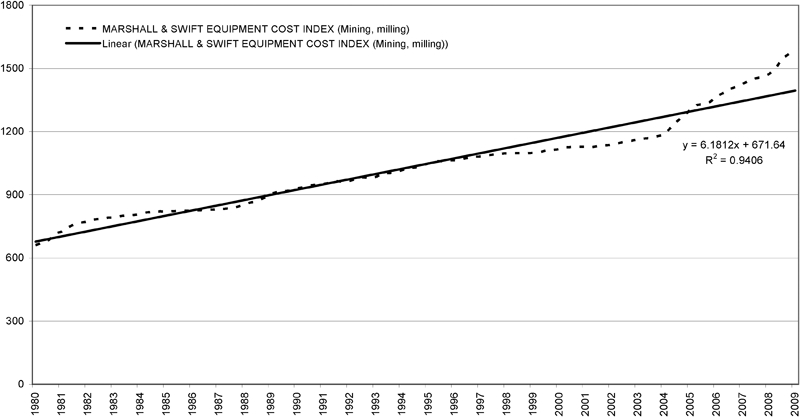
Historical movement and liner trend of Marshall and Swift equipment cost index for mining and milling (CHE, 1980–2009)
Proposed econometric model for operating cost estimation
In this section, the operating costs for Australian surface coal mines are estimated using an econometric model based on the InfoMine and R2Mining data bases. R2Mining has computed operating and capital costs in A$. As can be seen in Table 3, operating costs and capital costs are based on deposit average thickness, stripping ratio and daily production rate. Table 3 shows that as the deposit average thickness decreases and the stripping ratio increases with a fix coal production rate, operating costs and capital costs increase. Moreover, in a deposit with constant average thickness and stripping ratio, as long as the production rate increases, operating cost and capital cost increase as well.
Surface coal mine operating cost, capital cost, production rate, deposit average thickness and stripping ratio in different scenarios (CostMine, 2009)
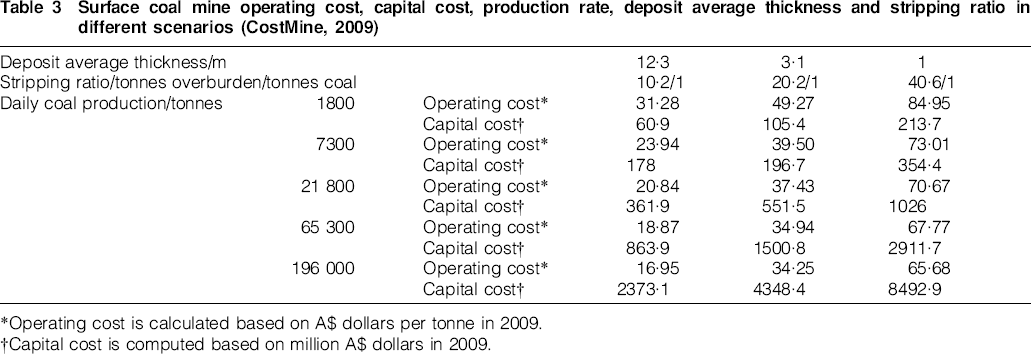
Operating cost is calculated based on A$ dollars per tonne in 2009.
†Capital cost is computed based on million A$ dollars in 2009.
The econometric model for estimating operating costs is based on deposit average thickness, stripping ratio, capital cost and daily production rate as the independent variables and operating cost as the dependent variable. This model has been developed to account for the influence of the independent variables on estimating the operating cost. This model is estimated by the Ordinary Least Square approach using R2Mining data in 2009 (Table 3). The result is given by equation (2) as follows
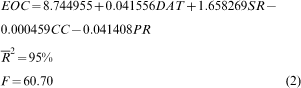
The econometric model estimates the relationship between DAT, SR, CC and PR with EOC. The model shows that the CC and PR have a negative effect on EOC while DAT and SR have a positive effect. For example, the model indicates that if the stripping ratio increases by 1 t of overburden per tonne coal, the operating cost will increase by a factor of 1·66 A$/t, ceteris paribus. Table 4 shows EOC based on the proposed econometric model and a comparison with operating cost (OC) calculated by InfoMine, R2Mining and Australian coal mine data from Table 2. As can be seen in Table 4, the model estimation has +20% range of accuracy as compared with the real data given in previous tables. In this model the range of input variables is too broad, e.g. a production rate from 1800 to 196 000 t/day, and 20% accuracy is acceptable for such broad range of independent variables. Additionally, the model has 95% significance and has no multicollinearity, heteroscedasticity or autocorrelation problems.
Surface coal mine deposit average thickness, stripping ratio, capital cost, production rate, InfoMine operating cost estimation, econometrics operating cost estimation and validity range of two estimations*
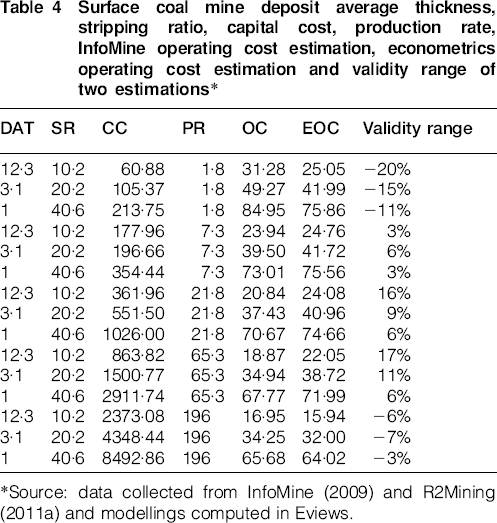
Source: data collected from InfoMine (2009) and R2Mining (2011a) and modellings computed in Eviews.
Conclusions
In the mining industry, the variability, and hence uncertainty, of the values of variables used in most cost estimations are based on past volatility as measured in other mining projects. As projects proceed, more information becomes available and the uncertainty of the most significant variables decreases, and thus, operating costs should be revised. For this reason, in order to take a conservative approach the mining project evaluator may tend to overestimate the operating cost of the mine. The accuracy of estimation of capital costs and operating costs depends on the quality of the technical assessment and knowledge of expected mining and mineral processing conditions. Consequently, mining companies extensively investigate alternative methods and the collection of more reliable data with the intention of increasing the accuracy of estimation accurate estimation and evaluation of mining projects.
Cost indices in the mining industry provide a general overview and a mechanism for calibrating historical data to current operating conditions. One of the advantages of cost indices is to include the effect of inflation in mining cost estimation. The study presented here uses the fluctuation of cost indices in InfoMine and R2Mining from 1965 to 2008 and the Marshal and Swift index from 1980 to 2009.
The econometric model developed presented here shows that the capital cost and production rate have a negative effect on the estimated operating cost and the deposit average thickness and stripping ratio have a positive effect on the operating cost. The estimated operating cost generated by the model is compared with the operating cost calculated in R2Mining and InfoMine, and shows that the model estimate is within +20% of the real data. Accurate estimation of mining project costs is very difficult; nevertheless these types of techniques could provide a reliable means of using uncertain variables in mining project.