
Abstract
Powder metallurgy (PM) nickel steels are often selected because they have high strength, high impact resistance and good abrasion resistance. The microstructure of slowly cooled PM nickel steels typically contains pearlite, bainite, martensite and a fair volume fraction of retained austenite. Since volume diffusion is really low at conventional sintering temperatures [1120–1150°C (≈2050–2100°F)], nickel rich areas are usually found where prior admixed nickel particles were located, i.e. at the surface of iron particles and in sintering necks. Therefore, there is a discrepancy between the rather low mechanical properties of austenite and the high strength of PM nickel steel. Hence, the hypotheses that stress induced or strain induced martensite formation takes place during mechanical testing have been investigated. Results show that martensite forms during mechanical testing, and its final volume fraction is proportional to nickel content.
Introduction
Powder metallurgy (PM) nickel steel (Metal Powder Industries Federation FN series) is one of the most popular series of alloys in the PM industry. These alloys, generally containing between 1 and 4 wt-% of nickel, are used when high strength, high impact resistance and good abrasion resistance are needed.1 Usually, admixed nickel leads to the formation of nickel rich areas (NRAs) in the sintered microstructure, since the diffusion coefficients of nickel in iron are still low at conventional sintering temperatures.2,3 The typical microstructures of PM nickel steels are mainly made of pearlite with various amounts of martensite, bainite, NRA and retained austenite. For a given carbon concentration, the proportion of each phase depends on the cooling rate and the local nickel content. Knowing that at typical sintering temperatures for PM nickel steels (1121°C–2050°F) volume diffusion is low compared to grain boundary and surface diffusion, NRAs are usually found where prior admixed nickel particles were located, i.e. at the surface of iron particles and in sintering necks. Similarly, it has been proven quantitatively that local nickel concentration >10 wt-% causes the formation of retained austenite, while low concentrations (1–2 wt-%) lead to the formation of bainite and eventually pearlite.3 Nevertheless, literature and PM standards identify PM nickel steels as being characterised by high strength.1,4 Thus, there seems to be a contradiction between the reported mechanical properties and the presence of significant volume fractions of retained austenite that is characterised with low strength and high ductility. Therefore, the hypothesis that stress or strain induced martensite formation takes place during mechanical testing could explain these high strength values. As far as we know, this topic has not been investigated for PM steels. Only Furukimi et al. 5 have reported that the fracture surface of their specimens might have a lower volume fraction of retained austenite linking it to this phenomenon without characterising it in detail. Thus, the main objective of this work is to determine if the proportions of retained austenite and martensite vary when mechanical testing is performed on alloys containing admixed nickel, which would clearly demonstrate that strain induced martensite formation takes place and is in part responsible for the improved mechanical properties of these alloys. It is important to note that in this article, the expression strain induced martensite is used even though the exact determination of the transformation product, between stress induced and strain induced martensite, is not discussed.
Strain induced martensite
Strain induced martensite formation
Strain induced martensite (α’) has been well investigated in highly alloyed wrought steels and austenitic stainless steels.6– 15 Its formation is attributed to the deformation of austenite (γ) that produces the proper structural defects that act as embryo sites for the martensitic transformation. These nuclei are referred to as ‘shear bands intersections’ and can take the form of ϵ’ (hcp) martensite, mechanical twins and/or dense stacking fault bundles.7,8,15 An example of these defects is presented in Fig. 1. For ferrous materials, the presence of these defects, i.e. increased probability of strain induced martensite formation, is promoted when austenite has low stacking fault energy (SFE).6
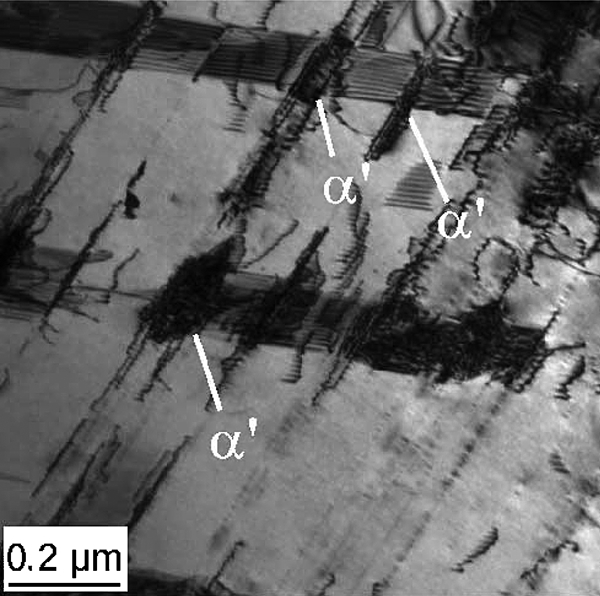
Transmission electron micrograph showing shear band intersection and strain induced martensite (α′) in EN 1·4318 2B steel deformed to 5% engineering strain (reprinted with permission from authors11)
Strain induced martensite formation is also favoured when shear stresses are generated. This is not the situation for normal stress (tensile stress) that can either help or hinder transformation, depending if the normal stress is in the direction of the volume change or not.8
Stacking fault energy influencing factors
The presence of substitution elements in the face centred cubic (fcc) structure usually decreases the SFE. As an example, brass has a lower SFE than copper, and all aluminium alloys have a lower SFE than pure aluminium.16 Figure 2 illustrates this fact, showing that a higher zinc concentration in brass enhances twinning, which is known to be favoured by low SFE. This is explained by the fact that low SFE promotes the dissociation of dislocations into partial dislocations that hinder dislocation climb and cross-slip. This mechanism reduces the propensity of the material to deform by slip alone and therefore favours twining.17 Equation (1) illustrates this fact by showing that twining stress (σT) is lowered by a smaller SFE16

 is the Burgers vector.
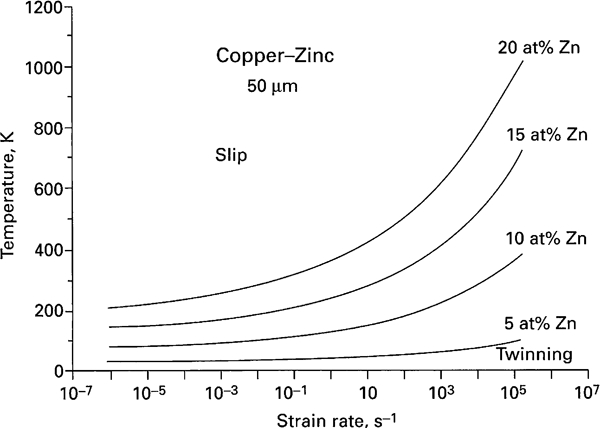
Influence of Zn as solid solution element on SFE of Cu–Zn binary alloy (reprinted with permission from authors16)
In the case of steels, results from the literature state that nickel (Ni) decreases austenite SFE more than chromium and molybdenum, which are popular alloying elements in PM steels.7 Therefore, its presence in large concentrations in NRA increases the probability of twinning and strain induced martensite formation.
Grain size is another parameter that affects SFE. As shown in Fig. 3, a smaller grain size significantly increases the SFE.18
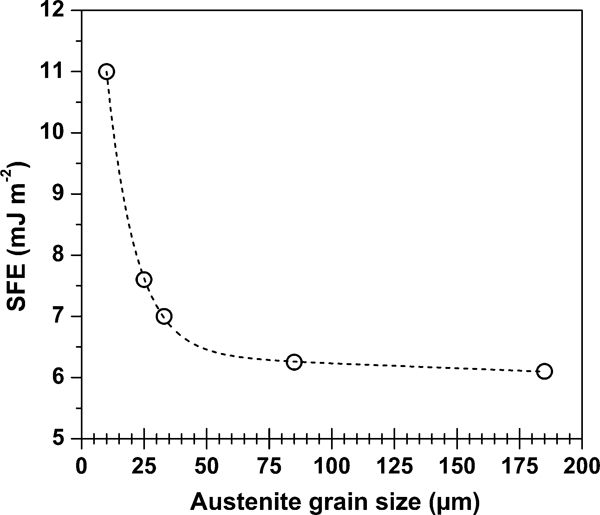
Influence of austenitic grain size on SFE in Fe–18%Mn
Finally, temperature also has a significant impact on SFE. Indeed, SFE increases with temperature.11 This is the main reason why a higher strain rate, causing an increase in local temperature, was found to suppress the formation of strain induced α′-martensite.8
Methodology
Specimen preparation and testing
Seven premixes were prepared with different proportions of admixed nickel (0, 1, 2, 3, 4, 5 and 10 wt-%) and 0·65 wt-% of graphite to obtain 0·6 wt-% of combined carbon after sintering. The base iron powder selected was Rio Tinto Metal Powders ATOMET 1001HP. Nickel Inco T123 (D50 = 8 μm) was used, and carbon was provided by TIMREX Synthetic graphite KS6. Lubrication was provided by adding 0·75 wt-% of ethylene bis stearamide to each premix.
Five transverse rupture bars (TRS) per blend were pressed to a green density of 6·8 g cm−3 and sintered at 1121°C (2050°F) for 30 min in a 90–10 vol.-%N2–H2 atmosphere. No specific debinding operation was carried out. Specimens were sintered in a continuous belt furnace. The sintering zone heating rate was 45°C min−1. The cooling rate between 900 and 450°C (1650–840°F) was 0·75°C s−1. Following sintering, dimensional change compared to green size, apparent hardness (HV 1 kgf), three-point rupture tests at a rate of 2 mm min−1 (MPIF standard 44, 43 and 41 respectively19) and image analysis to measure the proportion of each phase were performed.
Strain induced martensite characterisation
Strain induced martensite proportions were characterised on etched TRS bars with an image analysis system (Clemex Vision PE 5·0 software) linked to an Olympus GX51 optical microscope. Phase identification was confirmed with microhardness measurements. The proportions of martensite and retained austenite were evaluated at the flank of the ruptured edges and in sections far from the fracture surfaces (core) (Fig. 4). Ten fields were analysed per blend per area of interest, for a total of 20 fields per series of specimens. To corroborate image analysis, apparent hardness was also performed at those two locations to study the effect of strain induced martensite formation on hardness.
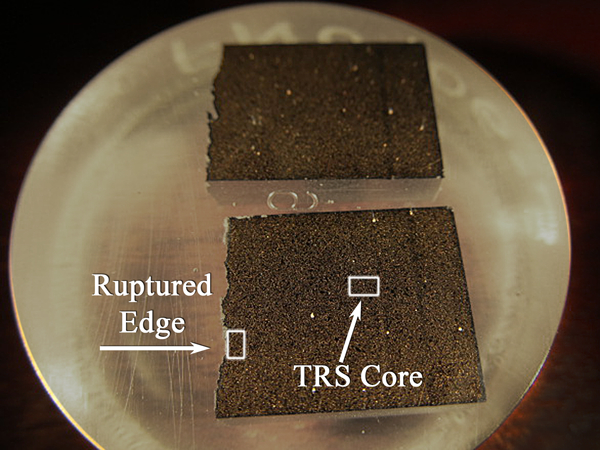
Mounted ruptured TRS bar used for images analysis: typical areas characterised are arrowed
Before characterisation, polished specimens were etched between 3 and 5 min (time being function of the nickel content of the specimens) with a solution of 4·5 vol.-% of hydrochloric acid (HCl), 0·5 vol.-% of sodium sulphite (Na2SO3) and 95 vol.-% of distilled water. This etchant was used because common etchants (nital and/or picral) did not provide enough contrast to clearly distinguish NRA from martensite in the microstructures.
The nickel proportion of each phase was also evaluated for the two locations. A minimum of 25 analyses per phase per location have been performed using a scanning electron microscope with energy dispersive spectroscopy.
Results and discussion
Mechanical properties
Figure 5 presents the results of the average dimensional change and transverse rupture strength for each series of specimens studied. As shown, the increase in nickel content enhances the relative densification and strength. Dimensional change follows a linear relationship with nickel content. In the case of transverse rupture strength, it increases linearly for the first 5 wt-% and then tends to level off as the nickel content reaches 10 wt-%. As it will be presented in the next section, this levelling is related to the increasing proportion of retained austenite with high nickel content, which is softer than the pearlite matrix. Figure 6 presents the apparent hardness function of the admixed nickel content and also of the location (core or near the ruptured edge). The results clearly show that the hardness increases with increasing nickel content and also that the edge is harder than the core.
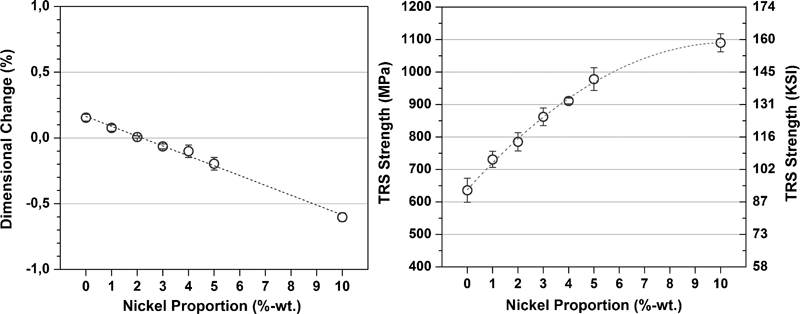
Average dimensional change from green size and TRS results
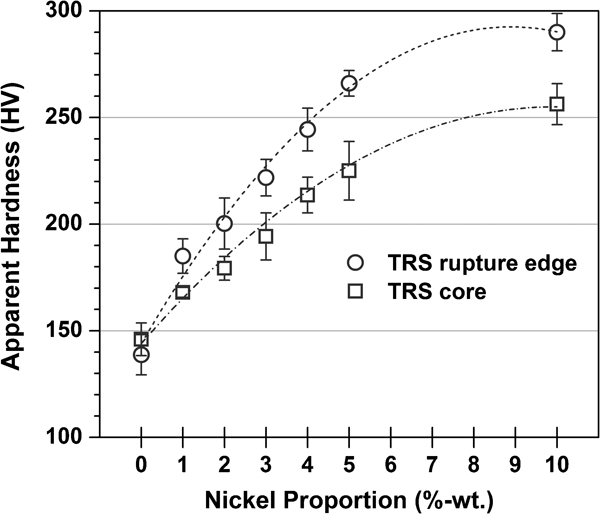
Average apparent hardness at ruptured edge and in core of TRS samples
Microstructures and strain induced martensite
Typical sintered microstructures are presented in Fig. 7. These micrographs were taken near the fracture surface and at a fair distance from it (core microstructure) for series 2 and 10 wt-% nickel. As expected, pearlite (P), bainite (B), martensite (M) and retained austenite (A) are present. However, their proportions differ with nickel content and also with the location from which the micrographs were acquired (core or ruptured edge). Comparisons between Fig. 7a and b, and c and d, clearly reveal that the area near the fracture surface contains significantly more martensite than the core of the specimen.
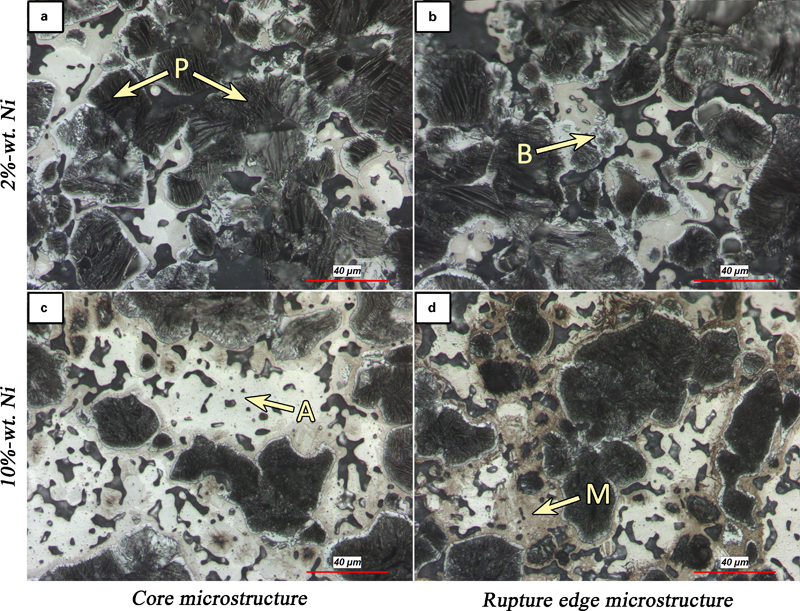
Typical microstructure at far and rupture edge is presented for sample: a, b 2 wt-%Ni and c, d 10 wt-%Ni. Micrographs a and c were taken far from ruptured edge, while b and d were taken at rupture edge
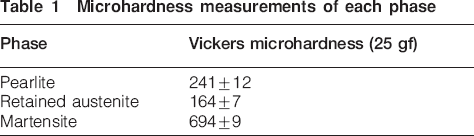
To confirm this observation, image analysis was carried out to quantify the proportion of martensite and retained austenite in each location of interest. The phase's identification was confirmed with microhardness measurements. Results are presented in Table 1.
Microhardness measurements of each phase
The results in Fig. 8 show that the proportion of martensite and retained austenite increases with nickel content. Interestingly, the results also show that the area near the fracture surface has a significantly larger proportion of martensite than the core of the specimen.
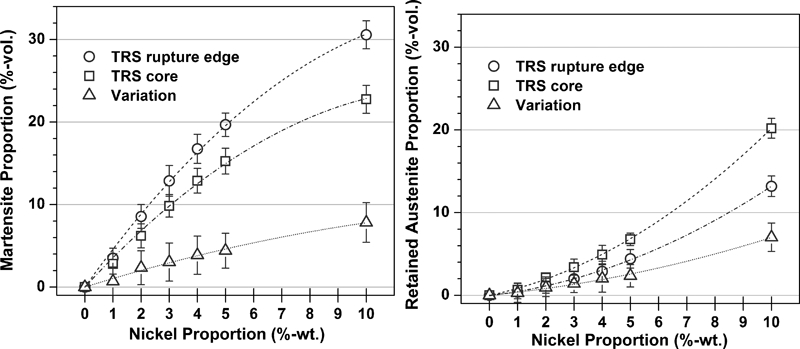
Martensite and retained austenite average proportion comparison between rupture edges and TRS cores
Data analysis shows that the sum of the proportions of retained austenite and martensite in both locations is equal (Fig. 9). This graph proves that the larger proportion of martensite near the fracture surface comes from the transformation of retained austenite taking place during mechanical testing. Figure 8 also shows that the higher the nickel content, the larger the proportion of retained austenite, leading to a larger proportion of strain induced martensite. Additionally, Fig. 10 illustrates that there is a linear relationship between the proportion of admixed nickel up to 5 wt-% and the amount of strain induced martensite.
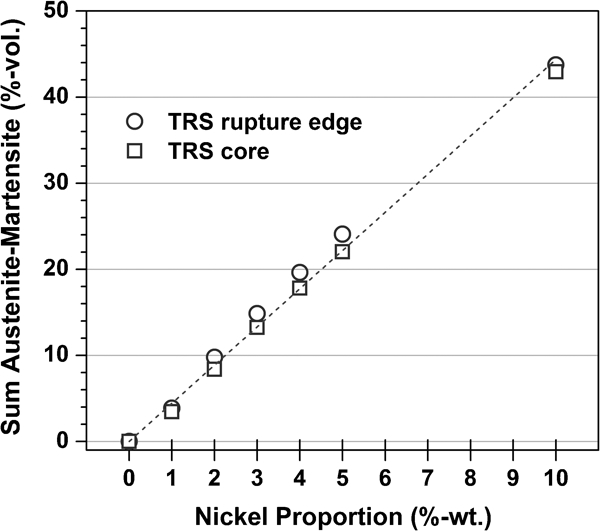
Sum of martensite and retained austenite average proportions for rupture edges and TRS cores
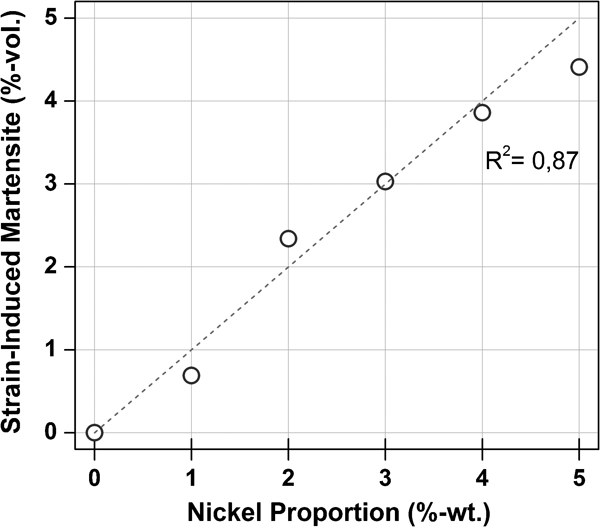
Calculated average proportions of strain induced martensite formed in specimens containing between 1 and 5% of admixed nickel
The nickel content of each phase has been evaluated at the two locations of interest, i.e. TRS core and ruptured edge. The results presented in Fig. 11 show the concentration intervals of nickel that promote the formation of each phase for each location. As can be seen, a significant proportion of martensite located at the ruptured edge has a higher nickel content than the martensite present in the core. This is linked to the higher nickel content of the retained austenite that was transformed in martensite through mechanical testing. Moreover, only austenite containing a large proportion of nickel did not transform.
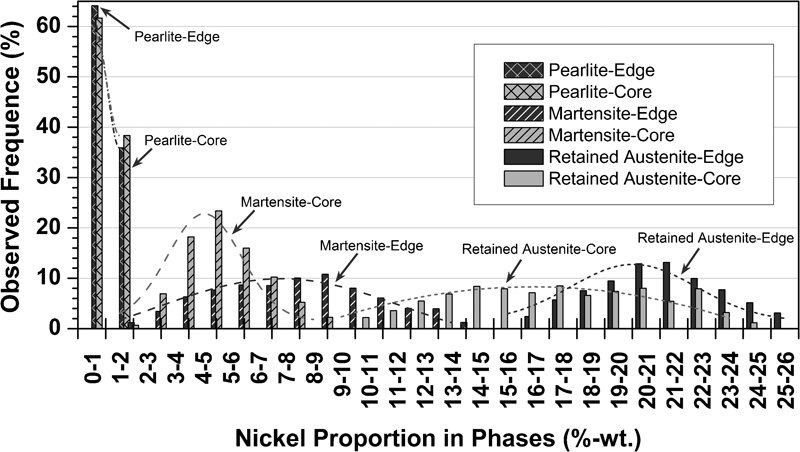
Nickel concentration comparison between core and ruptured edge with normally distributed intervals where each phase is favoured
Conclusion
In PM parts, admixed constituents that diffuse as substitution elemental addition have the tendency to produce solute rich areas when sintering conditions do not permit homogenisation. A well established case for PM steel parts is the use of admixed nickel that forms NRA. However, its addition produces an increase in mechanical properties even if the NRA microstructure is mainly retained austenite with lower mechanical properties. Therefore, a study has been made to establish if this increase is due to strain induced martensite formation through mechanical testing.
The main conclusions of our study are the following.
Strain induced martensite is formed in the NRA of PM steel parts (FN-XX05).
Strain induced martensite formation explains in part the improved mechanical properties of PM nickel steels.
Owing to the strain induced martensite formation, the hardness at the ruptured edge is significantly higher than in the core.
The volume fraction of strain induced martensite in the TRS specimens is proportional to the nickel content.
Fracture surfaces have a higher proportion of martensite than the rest of the specimen.
The volume fraction of strain induced martensite follows a linear relationship with admixed nickel up to 5 wt-%.
Ruptured edge martensite has a significantly higher nickel content than core martensite.
Footnotes
Acknowledgements
This work has been carried out with the financial support of the Natural Sciences and Engineering Research Council of Canada (NSERC) and of the Rio Tinto Metal Powders. The authors would like to acknowledge Mme M. Larouche for the image analysis.